


Institutional transparency concerns the amount of information government bodies provide about their decision-making and the implementation of their policies (e.g., Stasavage, Reference Stasavage2003; Hollyer et al., Reference Hollyer, Rosendorff and Vreeland2014). In recent years, transparency has gained increased attention in the good governance literature, as it is claimed to result in better decisions, policies, and processes without causing a fundamental shift in the political regime (Öge, Reference Öge2016). Importantly, transparency is not a coherent concept, with several different types having been identified: goal transparency, operational transparency, and procedural transparency (Libich, Reference Libich2006). The focus of what is made transparent varies between the three types. Goal transparency means communicating institutional goals openly, operational transparency implies performance measurement and admission of errors in planning or meeting goals, and procedural transparency relates to the provision of information regarding how decisions are arrived at by the institution.
In general, it is argued that good transparent policies contain methods of accountability. Transparent policies provide information to citizens that improve their ability to make choices about the services they receive and the rules and regulations they are required to follow. Finkelstein (Reference Finkelstein2000) asserts that a transparent policy is in fact deemed effective when the public acts on the information the policy provides. Therefore, a reasonable gauge of the success of institutional transparency, in which ever guise it takes, is the extent to which actions are motivated by the policy information communicated.
The present study focuses specifically on procedural transparency and examines the impact it has on actions taken by businesses, specifically compliance with authorities’ regulations. The role of procedural transparency for rule compliance is highly relevant, since enforcement mechanisms and the so-called management approach based on trust-building mechanisms such as making procedures transparent are not exclusively perceived as competing strategies but even claimed to be most effective when combined (Tallberg, Reference Tallberg2002).
If as is outlined by Finkelstein (Reference Finkelstein2000), the utilization of policy information communicated is effective because a causal association can be drawn between it and actions in accord with it, then by extension we test the underlying assumption that procedural transparency, if successful, will encourage compliance. Some support for this claim can be found in the domain of behavioral change. Defaults used to steer choice behavior often work in the background without the individual's knowledge. Paunov et al. (Reference Paunov, Wänke and Vogel2019a, Reference Paunov, Wänke and Vogel2019b, Reference Paunov, Wänke and Vogel2020) successfully showed that under conditions where their presence and a rationale for them were made explicit, more people maintained the default than opting out. Support for the impact of transparency on behavior has also been reported in the domain of tax behavior. Here transparency is considered as a prerequisite of citizens’ tax compliance (Torgler, Reference Torgler2002) and a causal connection is often drawn between transparency of procedures and higher acceptance of authorities, ultimately enhancing trust and leading to voluntary compliance (Kirchler, Reference Kirchler2007).
Contrary to these findings, there is also work suggesting that there are limits to the constructive effects of transparent policies. For instance, recent work examining behavioral change interventions also shows that transparency does not guard against backfires and may in fact contribute to them because explicit communication of policies (e.g., public campaigns) is misaligned with public motivations to change (Osman et al., Reference Osman, McLachlan, Fenton, Neil, Löfstedt and Meder2020). In line with this, there is work showing that increasing transparency does not necessarily increase trust in the judgment of public officials and public institutions (De Vries & Sobis, Reference De Vries and Sobis2016). Also, it is suggested that enforcement agencies should be cautious in expecting reliable improvements resulting from increased transparency. In this vein, Meijer (Reference Meijer2007) emphasizes that differences in enforcement organizations and their policies and how these relate to transparency have to be taken into account. He argues transparency might be applicable for a certain policy whereas it may cause frictions with other policies and claims that enforcement agencies should try to enhance their understanding of the relation between transparency and compliance.
As the current scientific evidence concerning the effect of procedural transparency is rather inconclusive, the present study explores the effect of procedural transparency on compliance with authorities. Importantly, we focus on a situation where transparency might have a potentially negative effect on compliance. Given that there is some evidence of backfiring effects of procedural transparency, we focus on whether transparency can lead to reduced compliance with regulations. Accordingly, we investigate whether the usually positive effect of higher penalties on compliance can be diminished due to transparently communicating information on penalty rates for other stakeholders.
The specific setting of the study refers to businesses’ compliance with safety rules. Research in the domain of safety rules has often focused on increasing compliance in the workplace by encouraging employees to operate more in line with the companies’ guidelines. For instance, making more transparent safety guidelines was aimed at targeting job demands in reducing emotional exhaustion and workplace injuries (Li et al., Reference Li, Jiang, Yao and Li2013). Other work has examined efforts to improve communication of safety rules to generally improve the relationship between perceptions of fairness and organizational safety climate (Ayim Gyekye & Haybatollahi, Reference Ayim Gyekye and Haybatollahi2014), as well as actual safety behavior in the fire service (Smith et al., Reference Smith, DeJoy, Dyal, Pu and Dickinson2019). In contrast to these studies, the novelty of the present work is that it deals with businesses’ adherence to safety regulations administered by responsible governmental authorities.
To consider the impact of increasing transparency of safety guidelines on business compliance, we consider work on corporate illegality. In general, theories of corporate illegality (e.g., Finney & Lesieur, Reference Finney and Lesieur1982; Coleman, Reference Coleman1987; Baucus, Reference Baucus1994) assume three preconditions for illegal business behavior: (1) the motivation to break the law in order to achieve goals that either proactively maximize profits or proactively prevent the business from failing; (2) the opportunity to engage in illegal behavior; and (3) no effective controls to deter from illegal behavior. Where the first precondition can be seen as attributing responsibility to the business and the last two might reflect limitations in how regulations are devised and how they are enforced. In line with the economics-of-crime paradigm (Becker, Reference Becker, Fielding, Clarke and Witt1968), the traditional view is that illegal behavior, as noncompliance with safety standards and regulations, should be negatively related to the level of deterrence. Thus, high compared to low penalties are expected to result in a lower level of noncompliance.
It is worth also highlighting that research on procedural fairness revealed that in certain situations, severe penalties might backfire and have a negative effect on compliance with authorities’ decisions. For instance, Verboon and Van Dijke (Reference Verboon and Van Dijke2011) reported that procedural fairness moderates the effect of sanction severity on compliance with authorities’ regulations. Severe sanctions increased compliance with the authority more than mild sanctions, but only when authorities’ actions were perceived as fair. Similarly, Van Prooijen et al. (Reference Van Prooijen, Gallucci and Toeset2008) observed that inconsistent punishment procedures can have detrimental effects on cooperation, as participants in their study cooperated less if punishment procedures were inconsistent between persons.
Importantly, the impact of transparency and how it is assumed to be related to perceived fairness and trust in governmental institutions has to be considered, especially in the context of punitive actions taken resulting from noncompliance. For instance, in the domain of tax compliance research, it is argued that transparency provides a great opportunity to enhance taxpayers’ compliance, and conversely, when taxpayers perceive that the government is not transparent, they will react negatively, attempting to evade taxes (Siahaan, Reference Siahaan2014). However, disclosure of information that outlines strategies and elements certain policies are based on can be influenced by subtle differences in the presentation of such information, and this can ultimately affect compliance (Porumbescu et al., Reference Porumbescu, Lindeman, Ceka and Cucciniello2017).
Relating work on transparency to work on the deterrent effect of penalties in the present study, we investigate experimentally how transparent communication of penalties influences compliance with safety regulations. More specifically, we examine how the relative size of fines for businesses’ noncompliance with safety regulations impacts the decision to comply or not. The structure of penalty rates for different-sized businesses offers a relevant context to study transparency, as previous research on safety compliance has identified a positive association between the size of a business and the level of safety compliance (Arpanutud et al., Reference Arpanutud, Keeratipibul, Charoensupaya and Taylor2009).
In line with this finding, there are several studies that report differences in compliance considering the size of businesses. Parker and Nielsen (Reference Parker and Nielsen2011) argue that larger, better-resourced, and better-managed businesses might have a stronger sense of the calculative reasons for compliance and do more to comply because they are institutionally programed to act in conformance with social norms of compliance. In the same vein, Bickerdyke and Lattimore (Reference Bickerdyke and Lattimore1997) present evidence for small firms exhibiting lower compliance rates than large businesses, as about 40% of 360 small businesses in their study did not fully comply with the regulations. These authors cite ignorance with respect to the rules as the most common cause of this noncompliance. They also argue that typically large firms face a higher probability of inspection, so that small companies may face rather low expected penalties from noncompliance.
Importantly, small businesses often argue that regulations and the tax system involve unfair burdens on small businesses, as they lack the resources of larger businesses, but are still expected to undertake similar types, and volume, of paperwork in order to comply with uniform regulations (Bickerdyke & Lattimore, Reference Bickerdyke and Lattimore1997). Accordingly, several studies suggest that size is a dominant corporate characteristic in explaining business compliance, indicating a positive relationship between firm size and the firm's level of compliance (e.g., Cerf, Reference Cerf1961; Al-Shammari, Reference Al-Shammari2011; Galani et al., Reference Galani, Alexandridis and Stavropoulos2011; Juhmani, Reference Juhmani2012; Sucuahi, Reference Sucuahi2013).
To sum up, we connect three different strands of the literature on compliance with authorities’ regulations, which allow the following inferences: First, in general, a positive effect of transparency on compliance is assumed. However, some insist that a more fine-grained approach is necessary, especially with regard to procedural transparency. Second, higher penalties for noncompliance are expected to increase compliance, but some studies indicate that the disciplining effect of higher penalties is sometimes attenuated, for instance, in case of perceived unequal or unfair treatment. Third, small- and big-size businesses often differ in their compliance motivations, for instance, due to differences in fairness perceptions with regard to the bureaucratic burden they face or diverging subjective perceptions of the likelihood to be audited.
Based on our interpretation of this relevant literature as offering rather inconclusive evidence, the aim of the present study was (i) to investigate whether an unequal penalty rate for small-size in contrast to big-size businesses has a different effect on compliance when this difference is transparent compared to when it is not transparent. Accordingly, we tested whether the effectiveness of different proportional penalty rates for small- and big-size businesses is attenuated or even undermined when such policies are transparent. We also tested (ii) how different income levels, different relative compliance costs, and different audit probabilities influence compliance with safety regulations over repeated compliance decisions. The respective assumptions were that lower compliance costs and higher probability of an audit result in higher compliance, while there was no clear expectation regarding the effect of income level. Additionally, we explored (iii) whether business size (small-size vs big-size companies) affects relative compliance when equal penalty rates were applied. These research questions were preregistered on the Open Science Framework (OSF) website using the As-Predicted templateFootnote 1. Data and analyses code are also available on the OSFFootnote 2.
Method
Participants
A total of 666 participants (243 males, 418 females, 5 other; M age = 34.89 years, Mdn = 31; SD = 12.86) living in the UK were recruited via the research platform Prolific Academic between March 24 and 26, 2020. Their mean payoff was £ 6.18 (SD = 0.89), consisting of a basic payment (£ 3.50) and additional incentive compatible payment dependent on the decisions made in the study. The sample size decision was based on the available monetary resources. A sensitivity power analysis in G*Power (Faul et al., Reference Faul, Erdfelder, Lang and Buchner2007) for an ANOVA with three factors (two levels each) indicates that the smallest effect detected given N = 666 for power = 80% is d = 0.26Footnote 3. The Ethics Review Board (ERB) of Tilburg University granted ethics approval for this study to the first author.
Design
The experiment was programed on the SoSci Survey online research platform (https://www.soscisurvey.de) and had the following 2 (Business Size: small vs big) × 2 (Penalty Rate: equal vs unequal) × 2 (Penalty Scheme: transparent vs nontransparent) between-subjects design. Thus, participants were either assigned a small or a big business, and the penalty rates were equal (both business sizes paid 50% of evaded compliance costs) or unequal (small-size businesses paid 50% of evaded compliance costs and big-size businesses paid 150%). Importantly, the penalty scheme was either nontransparent (participants were only informed about own penalty rate) or transparent (participants were also informed about penalty rate for the other business size). Figure 1 presents an overview of these different experimental conditions.
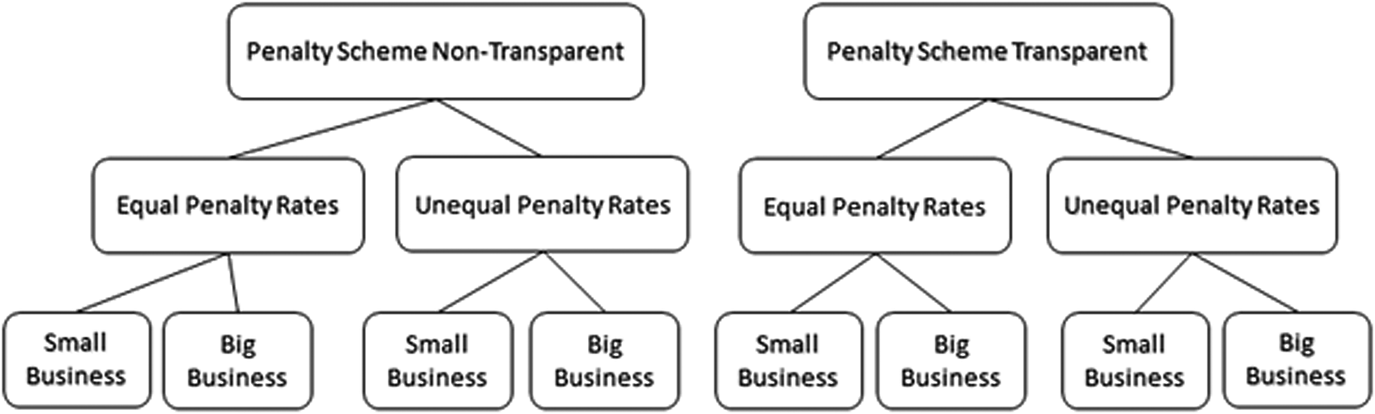
Figure 1. Overview of the eight conditions in the experiment. Note: These condition result from three factors with two levels each: transparency of penalty scheme (nontransparent/only informed about own penalty rate vs transparent/also informed about penalty rate for other business size); penalty rates (equal: 50% of evaded compliance costs for both business sizes vs unequal: 50% of evaded compliance costs for small-size businesses and 150% of evaded compliance costs for big-size businesses); business size (small-size vs big-size business).
Participants in all conditions went through 18 rounds of compliance decisions. Each round represented a unique combination of the different levels of the within-subject factors business income, compliance costs due, and audit probability (3 × 2 × 3 levels). Income was either 1,000, 1,500, or 2,000 ECU (Experimental Currency Units; small-size companies) or 1,500, 2,000, or 2,500 ECU (big-size companies). Compliance costs were either 20% or 40% of the round income. The audit probability was set at 10%, 15%, or 20%, and audits were determined based on these probabilities in each round. The key dependent variable was relative compliance with safety regulations, measured as the amount of paid safety costs divided by the due safety costs.
Procedure
Participants were informed that during the study they would take on the role of owner of a business that manufactures toys. Before the actual experiment started, participants were presented with three exemplary rounds of safety compliance decisions, for which they were asked to indicate the resulting net income in ECU to check whether they understood the instructions.
Next, in each round of the actual experiment, they received business income which varied for both small- and big-size businesses over the rounds but was always higher for the big-size businesses in comparison to the small-size businesses. They were instructed to spend a certain amount of their income as compliance costs to adhere to safety rules. Accordingly, on the screen, they were informed about their income in the respective round and the due safety compliance costs, as well as the chance to be audited by the responsible authorities and the potential penalties in case of detected noncompliance.
In each round, participants indicated on a form their decision as to whether or not to comply with the safety regulations. The final payoff was determined by one randomly drawn round, depending on the compliance decision in this round and whether an audit took place and—subsequently—a penalty was collected.
Post-experimental questionnaire
After the experiment, participants filled in a questionnaire consisting of six blocks of questions (all items are listed in the Appendix). First, participants were presented with four memory/attention check items (e.g., “What was the penalty rate that applied to your company?”), with three to five multiple-choice options per item. Second, a manipulation check item referred to the penalty size information (“Which statement/s is/are true about the penalties?”), with four multiple-choice options addressing whether there was only information about the penalty for the own business or also for other business sizes, and whether the penalty was the same, relatively smaller, or relatively larger for big-size businesses. Third, the severity of fines and perceived fairness was assessed with one or two items depending on whether participants were in one of the transparent or nontransparent conditions (“The penalty rate that applied to my company was too high.”; “Comparing the penalty rates for small size and big size companies, the penalty scheme was fair.”; with the second item only present when penalty rates for other businesses were transparent) (all rated on: 1 = do not agree at all; 7 = fully agree). Forth, risk propensity was assessed using six items by indicating the likelihood of engaging in different described activities (e.g., “Betting a day's income at the horse races.”) (1 = extremely unlikely; 7 = extremely likely). Fifth, norm following was measured with seven items, where participants had to indicate how characteristic presented descriptions were of them or their beliefs (e.g., “I always do my best to follow society's rules.”) (1 = extremely uncharacteristic; 5 = extremely characteristic). Sixth, three questions relating to the COVID-19 pandemic (e.g., “How worried are you about the current COVID-19 pandemic?”) (1 = not at all; 7 = extremely), in order to control for potential undesired effects in the experiment. Finally, demographic data (age, gender, country of residence) and language skills, attention to and understanding of the presented information were recorded.
Results
Below, we first report on the manipulation check and items that assessed attention to and understanding of the presented information. Next, we present the analyses of the main research questions investigating the effects of the experimental manipulations on relative compliance in the study. Finally, we analyze the extent to which the concepts measured in the post-experimental questionnaire are related to the actual decisions in the study.
Attention, understanding, and manipulation check
The answers to the questions before the start of the experiment indicate that the participants paid attention. The questions as to how their decisions and potential audits influence their payoff were answered correctly by the vast majority of participants (correct answers: 83.3%, 87.5%, and 91.6%, respectively). Regarding the memory and attention checks, 42.9% recalled the presented compliance cost rates correctlyFootnote 4, 75.1% the audit probabilities, 92.8% the penalty size that applied to their business, and 88.4% the size of their business. Furthermore, the participants indicated that they did carefully read all instructions (M = 4.82; SD = 0.42), that they completely understood all instructions (M = 4.59; SD = 0.67), and they rated their English skills as very high (M = 4.92; SD = 0.30; all on a five-point scale).
The manipulation check was a multiple-choice item referring to several details. It checked for accuracy of knowledge of information on the penalty size, whether or not information was presented about the penalty size for other business sizes, and if so, whether that penalty was the same, relatively smaller, or relatively larger to the penalty imposed on the participant's own business. Of the sample, 65.2% responded completely correct on all four presented statements and another 17.3% were incorrect on only one of the presented options.
Compliance with safety regulations
Effect of transparent different penalty schemes on compliance (between-subject effects)
Figure 2 indicates the overall mean compliance for all eight experimental conditions. To analyze whether an unequal penalty rate for small compared to big-size businesses affected compliance differently based on whether it was transparent or not, a linear mixed-effects model with the dependent variable relative complianceFootnote 5 over all 18 rounds of the experiment and the independent variables business size, penalty rate, and transparency of penalty scheme, as well as the respective two-way and the three-way interactions were run (see Table 1). As the results reveal, a higher penalty rate led to more compliance for big businesses in comparison to small businesses when this unequal penalty scheme is nontransparent, with compliance of big-size businesses over 10% higher than smaller ones. This is indicated by the significant interaction effect of business size × penalty rate. We do not observe this pattern when the different penalty scheme was transparent, since the three-way interaction business size × penalty rate × transparency was not significant. In this case, compliance of big-size businesses was not different from small-size companies, although the big businesses faced a higher penalty rate. This suggests that the deterring effect of a higher penalty rate was attenuated when participants were aware of the different relative penalties.
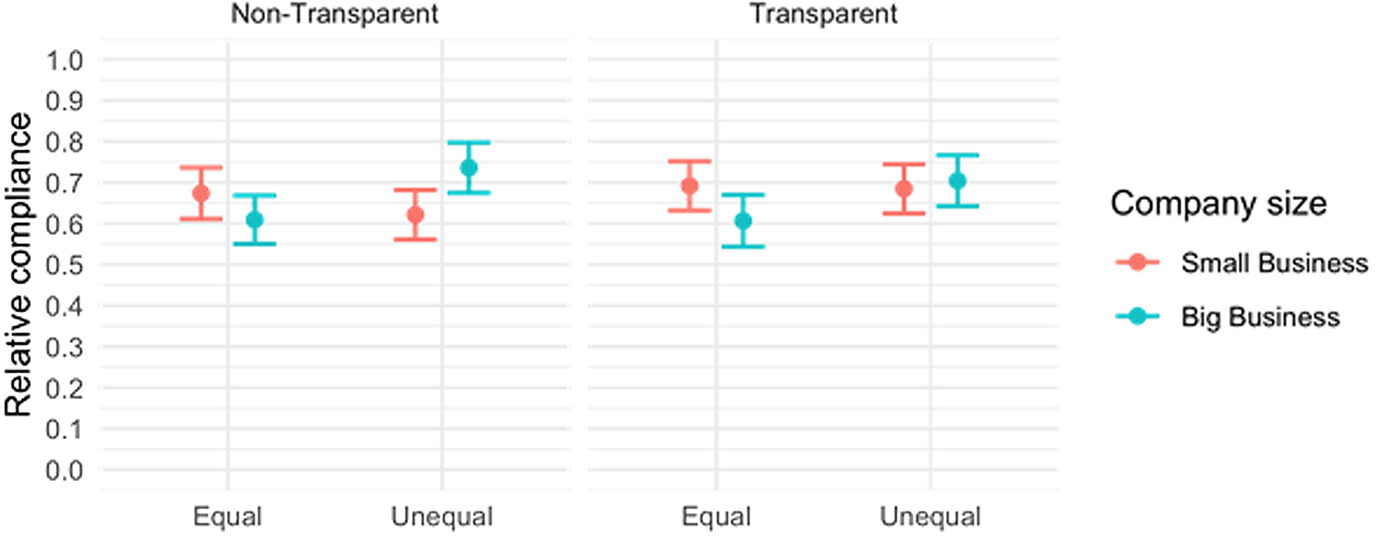
Figure 2. The effect of transparent and different penalty rates on compliance of small-size and big-size companies. Note: The y-axis indicates relative compliance, the x-axis the experimental condition, as indicated by business size (small vs big), penalty rate (equal vs unequal), and transparence (nontransparent vs transparent). Points represent means and the lines represent the standard errors of the means.
Table 1. The effect of business size, penalty scheme, and transparency on compliance
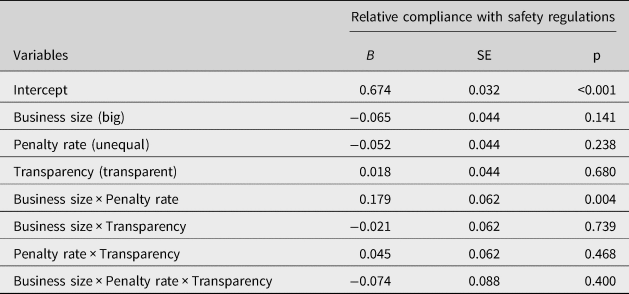
Note: N = 11,988 observations. Random intercept for N = 666 participants. Independent variables were dummy coded with the following reference categories (Business size = small; Penalty rate = equal; Transparency = nontransparent).
Effect of income, compliance costs, and audit probability (within-subject effects)
Relative compliance was clearly influenced by the level of compliance costs as well as the probability of an audit, and—to a lesser extent—by the size of income (see Figure 3). As can be seen in Table 2, higher compliance costs (i.e., 40% of the round income) resulted in lower relative compliance compared to lower compliance costs (i.e., 20% of round income). Higher levels of audit probability increased relative compliance, with a probability of 20% leading to higher compliance than a probability of 15%, and both elevating relative compliance compared to an audit probability of 10%. We also observe a—rather small—effect of income size. In the rounds with the highest level of income, compliance was lower than in the rounds with the lowest level of income, while the medium income level did not differ from the lowest level.
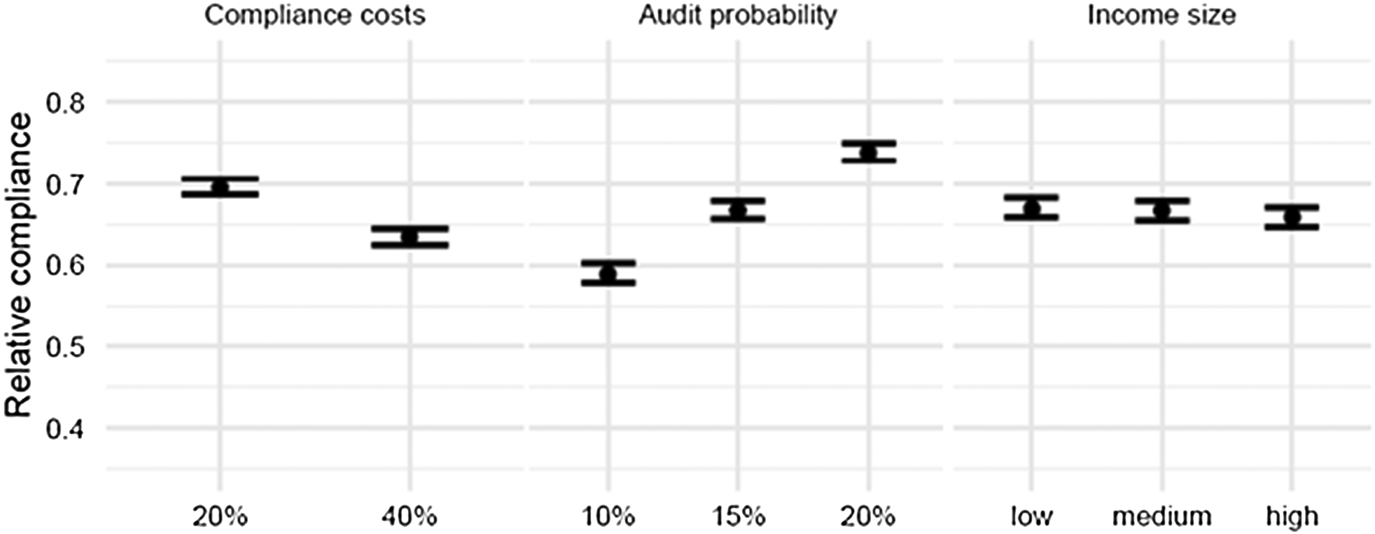
Figure 3. The effect of audit probability, compliance costs and income size on compliance with safety regulations. Note: The y-axis indicates relative compliance, the x-axis audit probability (10%, 15%, or 20% probability), safety compliance costs (20% or 40% of round income) and income size (low, medium, or high amount). Note that in each round big-size businesses have a higher income than small-size businesses, but for both business sizes, three different income levels were provided. Points represent means and the lines represent the standard errors of the means.
Table 2. The effect of audit probability, compliance costs and income size on compliance.
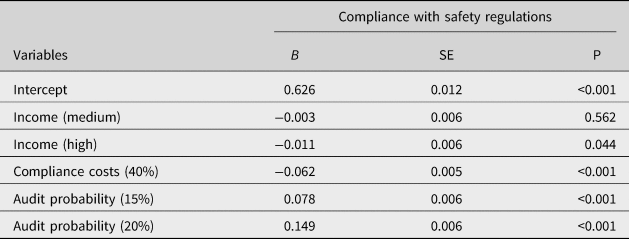
Note: N = 11,988 observations. Random intercept for N = 666 participants. Independent variables were dummy coded with the lowest level as reference category (Income = low; Compliance costs = 20%; Audit probability = 10%).
Effect of business size on compliance (between-subject effects)
When focusing only on the experimental conditions where big- and small-size companies faced the same penalty rates, we find a difference in compliance. Big businesses exhibited significantly lower compliance compared to small businesses (N = 332; B = −0.075, SE = 0.031, p < 0.001)Footnote 6.
Post-Experimental Questionnaire
The post-experimental questionnaire reveals that the evaluation of the size of the penalty rate for the own business did not differ between different experimental conditions, F(7, 658) = 0.74, p = 0.641. In the four transparent conditions, participants were also asked to evaluate the penalty scheme considering the penalty size for both types of businesses; a one-factorial ANOVA did not reveal a significant difference, F(3, 327) = 1.76, p = 0.155. However, for the transparent conditions, perceived fairness of the penalty scheme in general (i.e., independent of the respective experimental condition) was associated with higher compliance (N = 331; B = 0.02, SE = 0.01, p = 0.034). Overall, risk preference was negatively associated with compliance (N = 666; r = −0.22, p < 0.001) and norm following was positively associated with compliance (N = 666; r = 0.09, p = 0.028). Also, when looking at the questions specifically probing the impact of COVID-19, it is evident that participants were personally affected (M = 5.45; SD = 1.40) and worried (M = 5.59; SD = 1.40), but they indicated that these experiences did not influence their behavior in the experiment (M = 1.80; SD = 1.41).
Discussion
The aim of this study was to empirically investigate the claim that the efficacy of transparent policy information can be shown through its use in actions. Support for this claim has been mixed, and so to add clarity, we experimentally investigated the effect of procedural transparency related to the applied procedures in a novel domain (i.e., penalizing businesses’ noncompliance with safety regulations). Our findings suggest that the deterring effect of a higher penalty rate for big-size compared to small-size businesses under a nontransparent unequal penalty scheme is attenuated when the same information is publicly available. This observation is suggestive of transparency of higher penalties causing a backfiring effect under conditions in which the penalty scheme treats businesses of different sizes not the same. More specifically, we observe that in case of a higher penalty rate for big businesses that is transparently communicated, compliance of big-size businesses does not differ from small-size businesses, although this higher threat of punishment should result in enhanced compliance of big businesses.
Backfiring effects of penalties in contrast to the predictions of the classical deterrence approach (Becker, Reference Becker, Fielding, Clarke and Witt1968; see also Allingham & Sandmo, Reference Allingham and Sandmo1972) have been observed in some previous studies (see, for instance, Iyer et al., Reference Iyer, Reckers and Sanders2010; Kirchler et al., Reference Kirchler, Muehlbacher, Kastlunger, Wahl, Alm, Martinez-Vasquez and Torgler2010). Importantly, where the present study makes an original contribution is that it explores procedural transparency as a potential cause for such backfiring effects of penalties for noncompliance. In the context of safety compliance, the findings show that transparent information about the enforcement process relating to competitors mitigates the deterrent effect of penalties for noncompliance, although the penalty rates that apply to the own business are the same. This is an important finding, as it seems to conflict with recent evidence that targeted behavior can be positively enhanced by making procedural elements transparent (e.g., Paunov et al., Reference Paunov, Wänke and Vogel2019a, Reference Paunov, Wänke and Vogel2019b, Reference Paunov, Wänke and Vogel2020). However, as discussed by Paunov and colleagues, this corroborates the idea that the effect of transparency is context dependent, as it might be beneficial in some situations but not in others. The diminished effect of penalties when an unequal penalty scheme is transparent is in line with claims that the effects of transparency in public policy might be limited (De Vries & Sobis, Reference De Vries and Sobis2016; Meijer, Reference Meijer2007). Our findings also lend further support to work suggesting that it is not enough to advocate transparency without a clear idea of why and how procedures should be made transparent and what the public understanding of such information is (Osman et al., Reference Osman, Heath and Löfstedt2018; Gold et al., Reference Gold, Lin, Ashcroft and Osman2023).
The present study also lends support to previous evidence that inconsistent punishment procedures can have detrimental effects on compliance behavior (Van Prooijen et al., Reference Van Prooijen, Gallucci and Toeset2008). The finding that higher penalties do not lead to more compliance in case of providing information that others face lower penalty rates might be related to fairness perceptions. Those who are confronted with higher penalty rates might show less compliance as a consequence, while those facing lower penalty rates could even react with increased compliance. However, it remains unclear whether this effect works via perceptions of procedural fairness. Verboon and Van Dijke (Reference Verboon and Van Dijke2011) identified procedural fairness as a moderator of the effect of penalties on compliance. In the present study, when the penalty scheme was transparent, perceived unfairness of the penalty scheme was associated with lower compliance in general, but we did not find a significant overall difference between conditions of equal and unequal schemes.
Importantly, on top of assigning individuals to different experimental conditions based on the factors business size, penalty rate, and transparency, we varied compliance costs, audit probability, and business income in all these conditions over the course of the experiment. Structurally similar studies in other domains of compliance behavior reveal that participants tend to react strongly to such within-subjects manipulations (e.g., Kogler et al., Reference Kogler, Olsen and Bogaers2020). Thus, this specific feature of our experimental design represents a rigorous test of our main factors of interest (i.e., the penalty scheme and whether it was transparent), which were manipulated only at the beginning of the study with no salient changes throughout the experimental task. We find that participants react in a similar way to changes in compliance costs and audit probability, but in cases where they face a transparent unequal penalty scheme, compliance is reduced. Considering effect size, we observe that the crucial interaction effect indicating higher compliance in case of a higher penalty rate only in case of lower penalties for others not being transparent is based on a standardized beta coefficient of 0.47 (standard error of 0.16). The underlying difference in relative compliance between big-size and small-size businesses in case of nontransparent unequal penalty rates was 11.5% higher compliance of big-size businesses threatened by a higher fine. We believe this represents a meaningful finding and also suggests that our sample size based on available monetary resources was sufficient. This observed effect of transparency in cases where a penalty scheme treats businesses differently may be even more prominent in reality, where changes in compliance costs or audit probabilities might not be as salient.
One finding of our study that should be interpreted with caution is that big businesses exhibited significantly lower compliance compared to small businesses, when exclusively considering the experimental conditions in which they faced the same penalty rates (i.e., the equal conditions). This is not in line with several other studies indicating a positive relationship between business size and compliance (e.g., Cerf, Reference Cerf1961; Bickerdyke & Lattimore, Reference Bickerdyke and Lattimore1997; Al-Shammari, Reference Al-Shammari2011; Galani et al., Reference Galani, Alexandridis and Stavropoulos2011; Juhmani, Reference Juhmani2012; Sucuahi, Reference Sucuahi2013). However, here it is important to emphasize, compared to previous studies, in the present experimental setting audit probabilities were the same for all businesses and explicitly communicated. Furthermore, factors as additional available resources, business expertise, or visibility of the business did not play a role in our setting. In the present study, the only way that business size was determined was income, where there was a higher overall income of big compared to small businesses. While this is an advantage for the goal of our study, this does not allow for direct inferences about the relation of business size and rule compliance in general given that there are other factors that correspond with the size of business besides income. Consequently, this raises the critical question of the external validity of our findings. In recent years, the debate on how far findings from laboratory experiments can be generalized has gained new momentum (see, for instance, Pritchett & Sandefur, Reference Pritchett and Sandefur2015; Findley et al., Reference Findley, Kikuta and Denly2021). With regard to compliance, there is conflicting evidence on whether lab studies are representative of actual behavior outside the lab (e.g., Alm et al., Reference Alm, Bloomquist and McKee2015) or not (Choo et al., Reference Choo, Fonseca and Myles2016). While it is debatable whether our findings are directly applicable to actual safety compliance decisions of businesses of different sizes or more indicative of decisions of individuals with different incomes, we are quite confident that our core observation is generalizable. Accordingly, making unequal treatment of businesses or citizens transparent can impair the effect of sanctions on compliance.
Besides the behavioral data and the fairness and penalty relevant items, the post-experimental questionnaire also included measures of norm compliance and risk seeking. In line with other studies (e.g., Bobek et al., Reference Bobek, Hageman and Kelliher2013; Alm & Malézieux, Reference Alm and Malézieux2021), we observe a moderate negative correlation between risk preference and compliance and a low positive correlation between norm following and compliance. In combination with the encouraging results on the multiple attention, understanding, and manipulation checks, we interpret these findings as an indication of good data quality and high reliability of our experiment.
In conclusion, the present study presents evidence that more transparency with regard to the procedures of authorities does not automatically result in higher compliance. In contrast, we observe that transparent information on the penalty scheme for businesses noncompliance with authorities’ regulations can attenuate the deterring effect of higher penalties, in case the provided information includes unequal treatment of different stakeholders. As a consequence, authorities need to carefully consider what information about their procedures they decide to communicate and whether there is potential for perceptions of unfairness or even misunderstanding in general.
Supplementary material
To view supplementary material for this article, please visit https://doi.org/10.1017/bpp.2022.42.
Author contributions
C.K. conceptualized the whole article, conducted a formal analysis and investigation, developed the methodology, wrote the original draft. J.O. conducted data curation and conducted a formal analysis and investigation, developed the software, wrote the review and edited the article. M.O. conceptualized the whole article, developed the methodology, wrote the review and edited the article. M.Z. conceptualized the whole article, developed the methodology, wrote the review and edited the article.
Funding statement
This manuscript presents independent research funded by the Office of Product Safety (OPSS)/Department for Business, Energy & Industrial Strategy (BEIS) of the UK Government. The views expressed in this publication are those of the authors and not necessarily those of the OPSS/BEIS.
Appendix—Post-Experimental Questionnaire:
Memory/attention checks (3–5 multiple-choice options per item)
-
What were the different compliance cost rates?
-
What were the different audit rates?
-
What was the penalty rate that applied to your company?
-
What type of company were you assigned to?
Manipulation check (4 multiple-choice options)
-
Which statement/s is/are true about the penalties?
-
I was only informed about the penalty that applied to my company size.
-
The penalty for big-size companies was relatively larger than the one for small-size companies.
-
The penalty for big-size companies was relatively smaller than the one for small-size companies.
-
The penalties for small- and big-size companies were the same.
-
I don't remember.
Severity of fines and perceived fairness (1—do not agree to 7—fully agree)
-
The penalty rate that applied to my company was too high.
-
Comparing the penalty rates for small-size and big-size companies, the penalty scheme was fair. (this item was only asked when penalty rates for other businesses were transparent)
Risk propensity (1—extremely unlikely to 7—extremely likely)
-
For each of the following statements, please indicate the likelihood that you would engage in the described activity or behavior if you were to find yourself in that situation:
-
Betting a day's income at the horse races.
-
Investing 10% of your annual income in a moderate growth mutual fund.
-
Betting a day's income at a high-stake poker game.
-
Investing 5% of your annual income in a very speculative stock.
-
Betting a day's income on the outcome of a sporting event.
-
Investing 10% of your annual income in a new business venture.
Norm following (1—extremely uncharacteristic to 5—extremely characteristic)
-
Please rate the extent to which these items are characteristic of you or what you believe:
-
I go out of my way to follow social norms.
-
If more people followed society's rules, the world would be a better place.
-
People need to follow life's unwritten rules every bit as strictly as they follow the written rules.
-
People who do what society expects of them lead happier lives.
-
Our society is built on unwritten rules that members need to follow.
-
I am at ease only when everyone around me is adhering to society's norms.
-
I always do my best to follow society's rules.
COVID-19 related control questions (1—not at all to 7—extremely)
-
Finally, we would like to ask you about your perceptions and feelings with regard to the COVID-19 pandemic (i.e., corona virus pandemic). This is not directly related to our study, but we would like to know how you personally feel in the current situation:
-
How much do you feel personally affected by the current COVID-19 pandemic?
-
How worried are you about the current COVID-19 pandemic?
-
To what extent would you say did the current COVID-19 pandemic influence your responses in this study?
Demographics
-
What is your gender?
-
What is your age in years?
-
What country do you live in?
Understanding
-
How would you rate your English language skills? (1—very low to 5—very high)
-
Did you carefully read all the information that was given? (1—no, not at all to 5—yes, completely)
-
Did you understand all the information? (1—no, not at all to 5—yes, completely)


 Open access