


Child undernutrition remains one of the greatest challenges for public health nutrition in rural areas in developing countries. Stunting, which affects one out of four of the world’s children under 5 years old( 1 ), is about 1·5 times higher in rural areas than in urban areas( Reference Black, Victora and Walker 2 ). In Guatemala, 46 % of children under 5 years are stunted, but it can reach up to 70 % in the poorest rural regions( 3 ). Agricultural interventions have been a common approach to improve food security( Reference Borlaug 4 , 5 ) and, consequently, child nutrition. However, some of these interventions have had detrimental effects on the environment and human health( Reference Dwivedi, Lammerts van Bueren and Ceccarelli 6 , Reference Pingali 7 ). Their intensive use of natural resources and chemical inputs have polluted, degraded and disturbed terrestrial ecosystems, reducing their resilience and sustainability. Also, their narrow focus on a limited range of starchy crops (e.g. wheat, rice, maize)( Reference Khoury, Bjorkman and Dempewolf 8 – Reference Pingali 10 ) might have contributed to decreased agrobiodiversity( Reference Tuxill 11 , Reference Phalan, Bertzky and Butchart 12 ) and increased micronutrient deficiencies( Reference Burchi, Fanzo and Frison 13 , Reference Kataki 14 ). Consequently, there is an urgent need for environmentally sustainable, nutrition-sensitive alternatives to these agricultural interventions.
In this regard, interventions focused on conservation and sustainable use of agrobiodiversityFootnote ‡ seem to be promising alternatives to sustainably improve child nutrition( Reference Thrupp 15 – Reference Frison, Smith and Johns 18 ). These interventions account for diversified farming systems( Reference Kremen, Iles and Bacon 19 ); homestead food production, such as home gardens and small animal husbandry( 20 ); and conservation, utilization and marketing of neglected, underutilized species,Footnote * such as wild edible plants( Reference Grivetti and Ogle 21 , Reference Cernansk 22 ).Footnote † Nutrition is expected to be affected by these interventions through three main pathways (Fig. 1): (i) increasing availability of and accessibility to food types and dietary nutrients( Reference DeClerck, Fanzo and Palm 23 , Reference Vinceti, Eyzaguirre and Johns 24 ); (ii) strengthening ecosystem functions and providing ecosystem services that could enhance the sustainability of farming systems( Reference Cardinale, Duffy and Gonzalez 25 , Reference Kremen and Miles 26 ); and (iii) conserving genetic resources in situ/on-farm to enhance crops’ nutritional content( Reference Johns and Eyzaguirre 27 ) or adaptability to climate change( Reference Chivenge, Mabhaudhi and Modi 28 , 29 ). But, although the pathways are clear, the existing literature on these interventions is not conclusive about their effectiveness in combating child undernutrition( Reference Powell, Thilsted and Ickowitz 30 – Reference Webb Girard, Self and McAuliffe 33 ).
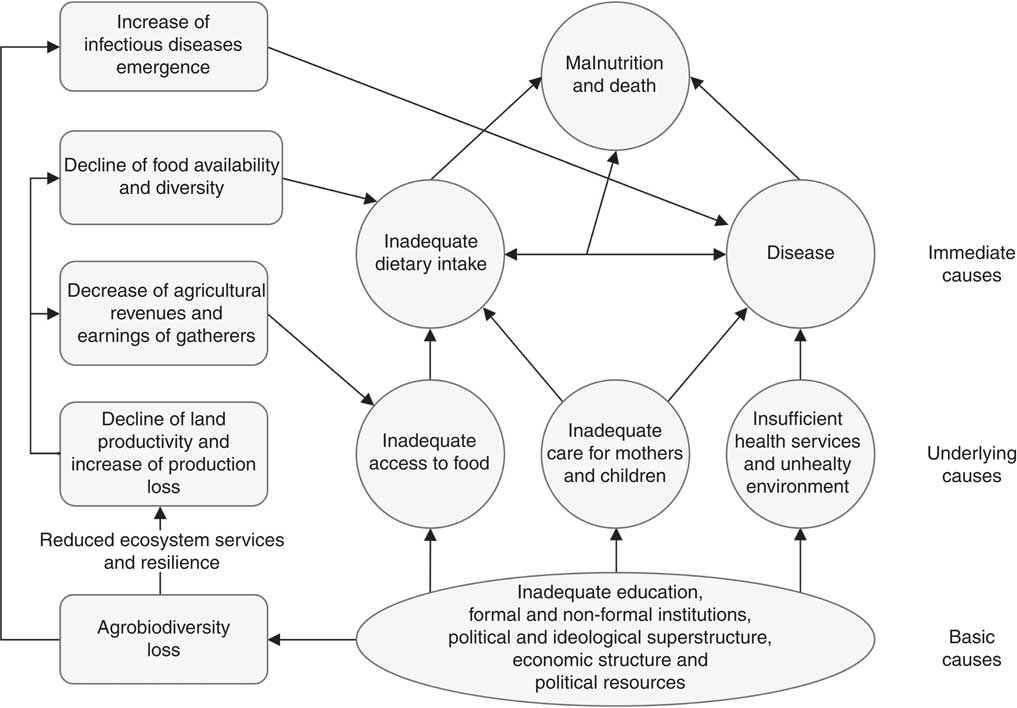
Fig. 1 Hypothetical relationship between agrobiodiversity degradation and causes of undernutrition (adapted from UNICEF( 106 ))
Studies on the association among agrobiodiversity, diet and nutrition have delivered inconsistent results. Some scholars showed that cultivated agrobiodiversity can enhance food self-sufficiency( Reference Dewey 34 – Reference Oyarzun, Mary Borja and Sherwood 36 ) and food security( Reference Yeudall, Sebastian and Cole 37 – Reference Vanek, Jones and Drinkwater 39 ), diversify diets and nutrient intakes( Reference Jones 35 , Reference Yeudall, Sebastian and Cole 37 , Reference M’Kaibi, Steyn and Ochola 38 , Reference Jones, Shrinivas and Bezner-Kerr 40 – Reference Roche, Creed-Kanashiro and Tuesta 52 ) and increase agricultural revenues to purchase food( Reference Kumar, Harris and Rawat 41 , Reference Koppmair, Kassie and Qaim 42 , Reference Bellon, Ntandou-Bouzitou and Caracciolo 48 , Reference Sibhatu, Krishna and Qaim 53 , Reference Hoddinott, Headey and Dereje 54 ). However, other scholars found that it can negatively affect nutrition; cultivated agrobiodiversity can limit the available time for child care and feeding( Reference Jones, Cruz Agudo and Galway 55 , Reference Malapit, Kadiyala and Quisumbing 56 ), offer lower yields and revenues than specialized agriculture( Reference Sibhatu, Krishna and Qaim 53 ) and increase child morbidity due to livestock ownership( Reference Azzarri, Zezza and Haile 57 ). Moreover, evidence on wild agrobiodiversity showed that wild edible plants barely contributed to the daily nutrient requirements of farmers( Reference Powell, Ouarghidi and Johns 58 – Reference Termote, Bwama Meyi and Dhed’a Djailo 60 ) (except for subsistence farmers( Reference Roche, Creed-Kanashiro and Tuesta 52 )) despite wild edible plants’ high micronutrient content( Reference Roche, Creed-Kanashiro and Tuesta 52 , Reference Ogle, Xuan Dung and Thanh Do 61 , Reference Boedecker, Termote and Assogbadjo 62 ). In addition, the majority of the studies were carried out in Africa and Asia( Reference Powell, Thilsted and Ickowitz 30 ), neglecting America. Therefore, no conclusion could be drawn with respect to the effect of agrobiodiversity on nutrition from the existing studies. These inconsistencies expound the complexity of the association among agrobiodiversity, diet and nutrition( Reference Jones and Ejeta 63 ) and call for a systematic, transdisciplinary approach( Reference Ericksen 64 ).
We explored the relationship among agrobiodiversity, diet and nutrition using a food system framework and cross-disciplinary approach. We attempted to explore this relationship in Latin America, a neglected region in this subject of interest, combining methods from ethnobotany, ecology and nutritional science. Our framework correlates agrobiodiversity and child nutrition through dietary diversity, and explores the exogenous factors influencing the relationship, such as socio-economic status, ethnicity, agricultural extension services, maternal education and age, market distance, and land and livestock ownership (see Fig. 4). We hypothesized that higher agrobiodiversity is associated with a more diversified diet and better anthropometric status in rural Guatemala. This framework, although it does not attempt to be exclusive or complete, can be useful to systematically study this relationship in rural areas and evaluate nutrition-sensitive agricultural interventions.
Methods
Location and population
The study took place in a rural municipality in the department of Baja Verapaz in Guatemala. This municipality is characterized by a large Indigenous population of the Mayan Achí ethnic group, extensive traditional ecological knowledge( Reference Turreira-García, Theilade and Meilby 65 ), wide practice of subsistence agriculture and high rates of child undernutrition and poverty. The mean annual temperature is 22·39°C with a mean annual precipitation of 769 mm. Two seasons are reported by informants: a dry season, starting in November, when maize (Zea mays L.) is harvested; and a rainy season, beginning in May, when maize is planted.
Six villages in the highlands of the municipality were selected after considering ecological and geographical characteristics to ensure that the range of edible species produced in the villages does not vary. Altitude ranged between 1300 and 1800 m above sea level and supported subtropical wet and moist forest( 66 ) on entisols and inceptisols according to US Department of Agriculture soil taxonomy( 67 ). In addition, the villages were located at increasing distance from the main market to test the association between remoteness to the market and dietary diversity( Reference Sibhatu, Krishna and Qaim 43 ).
The sample was composed of 154 randomly selected children aged 6–60 months and their 127 caregivers (e.g. mother, grandmother, aunt, sister), whom we refer to as ‘mothers’ in the present paper (Table 1). We used a sample size calculator( 68 ) with a confidence level of 95 %, a total population size (n) of 260 children aged 6–60 months, a CI of 5 % and a population proportion of stunted children of 60 %( Reference Arevalo-Jucub 69 ). Households were selected by convenience sampling due to the lack of demographic and cartographic data to randomize participants. Households with children were identified by a snowball sampling technique: asking people where children between 6 and 60 months of age lived.
Table 1 Characteristics of the sample of Mayan Achí people (154 randomly selected children aged 6–60 months and their 127 caregivers) from six rural villages in Guatemala, March–July 2016

IQR, interquartile range; masl, metres above sea level; QA, agricultural extension services promoting home gardening and agroecology; SES, socio-economic status; IYCDDS, infant and young child dietary diversity score; IDDS, individual dietary diversity score.
* Characteristics measured at and from the village school (point of reference).
† Data presented as median and IQR.
‡ Data presented as mean and sd.
Between March and July of 2016, face-to-face structured interviews were conducted to gather demographic and socio-economic information. The topics addressed were the following: demographic characteristics of the household (e.g. number of persons, level of education, age), agricultural practices (e.g. number of plots, edible species cultivated, agricultural inputs) and socio-economic information (e.g. housing conditions, assets ownership, sanitary conditions, income-generating activities). The last category helped to calculate the socio-economic status according to the method used by the Institute of Nutrition of Central America and Panama( Reference Méndez 70 , Reference Arroyave 71 ). This method includes the following variables in the calculation: housing conditions, number of household members, economic activity of household head, assets ownership, and water, sanitation and hygiene (WASH).
We collaborated with a local non-governmental associationFootnote * who approved our research and facilitated our access to the participants and local authorities. This association provides agricultural extension services and conducts nutrition-sensitive interventions based on the conservation of traditional ecological knowledge, utilization of native wild edible plants, and sustainable use of agrobiodiversity on home gardens and Milpas.Footnote † In addition, the study followed the International Society of Ethnobiology Code of Ethics to work with Indigenous people and biocultural diversity (traditional knowledge, biodiversity and cultural diversity)( 72 ). The objectives and procedures of the study were explained to all mothers and they provided verbal informed consent before the interview. We conducted the interviews in Spanish; no interpreter was needed.
Agrobiodiversity assessment
The crops cultivated by the participants were listed and identified to assess the agrobiodiversity status of the food systems.Footnote ‡ During the interviews, the mothers recalled the crops cultivated for food, but edible plants used solely for medicinal purposes were omitted from the data organization. Then, during the visit to the participant’s food systems (i.e. home gardens, Milpas, coffee plantations, tomato nurseries), we extended the list of cultivated crops, and we took plant pictures and specimens with the mothers’ permission. Specimens were identified in collaboration with the herbarium staff at the University of San Carlos of Guatemala using dichotomous keys from the ‘Flora of Guatemala’( Reference Standley, Williams and Steyermark 73 ) and corroborating the latest accepted scientific names in The Plant List ( 74 ). The correct taxonomic identification of species was essential to the present study because we calculated the nutritional functional diversity based on the features of each plant.
Three indicators of agrobiodiversity richness were calculated with the data gathered: (i) ‘crop species richness’ was determined by the number of edible crop species, both cultivated and wild, found in the participants’ food systems; (ii) ‘livestock ownership’ was measured as the number of domestic animals bred for food by participants; and (iii) the ‘nutritional functional diversity’ (NFD) metric( Reference Petchey and Gaston 75 ) was used to quantify the functions (i.e. dietary nutrients) provided to diet by the agrobiodiversity found in the participants’ food systems( Reference DeClerck, Fanzo and Palm 23 , Reference Petchey and Gaston 75 , Reference Luckett, Declerck and Fanzo 76 ). The NFD metric was used as a proxy of nutritional diversity of the food systems. For instance, systems comprising crops with similar nutritional values (e.g. maize, banana and potato) would have a lower NFD score than systems with the same number of crops but with different nutritional values (e.g. maize, beans and amaranth leaves).
The NFD scores were calculated using the nutritional values of the crops identified in the participants’ food systems. The nutrient values were gathered from two food composition databases, those of the Institute of Nutrition of Central America and Panama( 77 ) and the US Department of Agriculture( 78 ), where data are presented per 100 g edible portion of food. Macronutrients (protein, fat, carbohydrate, fibre), minerals (Ca, P, Fe, Zn, Mg) and vitamins (thiamin, riboflavin, niacin, vitamin C, vitamin A, folate) content of the identified crops were gathered and used for the calculation of the NFD scores. These nutrient content values depended on the part of the crop utilized by the participants (e.g. both amaranth grain and leaves were included), the condition of the crop when consumed (e.g. mango was included twice because it is consumed in its green and ripe form), the preparation of the food (e.g. raw v. cooked) and the species variety cultivated (e.g. red, white and black beans). The data were entered as percentage of the RDA of a male adult( 79 ). The NFD scores reported are percentages of the potential NFD, when all the crops available in the municipality are included in one hypothetical parcel.
Child dietary assessment
The children diets were assessed using 24 h recalls and by estimating dietary diversity scores. The mothers were asked to recall their child’s food intake during the previous two days; if the child’s diet of one of those days was atypical (due to festivities or visits to town or friends), another day was recalled. The foods recalled were classified into the sixteen food groups( Reference Swindale and Bilinsky 80 ) of the Food and Nutrition Technical Assistance Project (Table 2) and, then, the food groups were used to calculate the dietary diversity scores. The infant and young child dietary diversity score (IYCDDS)( 81 ) was calculated for children aged 6–23 months using seven food categories, while the individual dietary diversity score (IDDS)( 82 ) was calculated for children aged 24–60 months using nine food categories (Table 2). Moreover, the mothers were asked whether the foods consumed were self-produced, gathered in the forest or on the shore of the river, purchased, gifted, borrowed or provided as food aid.
Table 2 Classification of crops cultivated in the municipality according to the IYCDDS and IDDS food groups

IYCDDS, infant and young child dietary diversity score; IDDS, individual dietary diversity score; FANTA, Food and Nutrition Technical Assistance Project; NA, not applicable.
The food group ‘Spices, condiments and beverages’ included foods used in very small quantities as seasoning; hence, some foods (e.g. carrots, red pepper and coriander) were categorized into this and another group because the quantity consumed depended on the preparation of the dish.
Crop name [part or condition of the crop consumed] (scientific name of crop, identified with plant specimens)( Reference Standley, Williams and Steyermark 73 , 74 ) {local common names for crops}. Names are underlined when they are native to Mesoamerica( Reference Standley and Steyermark 108 , 109 ).
* Wild edible plants.
† Crops that were not identified with plant specimens, but using pictures( Reference Standley, Williams and Steyermark 73 ).
‡ Neglected underutilized species.
Child anthropometric assessment
Anthropometric measures were conducted to determine the nutritional status of child participants. The weight of all children was measured using a digital scale (Tecnipesa, Guatemala); the length of the children aged 6–23 months and the height of the children aged 24–60 months were measured with a wooden stadiometer. Measurements were taken in collaboration with participating local nutritionists trained in anthropometric assessment. Height/length-for-age Z-score (HAZ), weight-for-age Z-score (WAZ) and weight-for-height/length Z-score (WHZ) were determined using the WHO Anthro macros( 83 ) in R version 3.4.2. The children with HAZ < −2·0 were categorized as stunted, children with WAZ < −2·0 were categorized as underweight and children with WHZ < −2·0 were categorized as wasted.
Statistical analysis
Correlations and comparison of groups were run on the collected data. The normality of the data was always checked using graphical and numerical methods. Spearman (r s) and Pearson (r p) correlations were used to quantify and determine the direction of the association between two variables, such as agrobiodiversity and dietary diversity scores. The t test and Mann–Whitney U test were used to compare two unpaired groups, such as Mayan Achí people and Ladino people (non-Indigenous). All data were analysed using R version 3.4.2 and the statistical software package IBM SPSS Statistics version 24.0.
Results
Agrobiodiversity
The participants’ food systems were rich in agrobiodiversity. Five different systems supplied food to the participants; listed in decreasing order of crop species richness, they are: (i) the market, (ii) home gardens, (iii) Milpas, (iv) forest and river banks, and (v) coffee plantations and tomato nurseries (Fig. 2). These systems collectively contained ninety-two crop species; forty-two species were native to Mesoamerica and twenty-one were wild edible plants. The richest system in cultivated biodiversity, a home garden, contained twenty-eight edible species, the richest Milpa contained six species and the richest coffee plantation contained four species; all the tomato nurseries were monocultures. The ten most commonly cultivated crops were the following: (i) banana (Musa × paradisiaca L.); (ii) American black nightshade (Solanum americanum Mill.); (iii) peach (Prunus persica (L.) Batsch); (iv) maize (Z. mays L.); (v) coriander (Coriandrum sativum L.); (vi) amaranth (Amaranthus spp.); (vii) radish (Raphanus raphanistrum subsp. sativus (L.) Domin); (viii) coffee (Coffea arabica L.); (ix) orange (Citrus sinensis (L.) Osbeck); and (x) avocado (Persea americana Mill.).
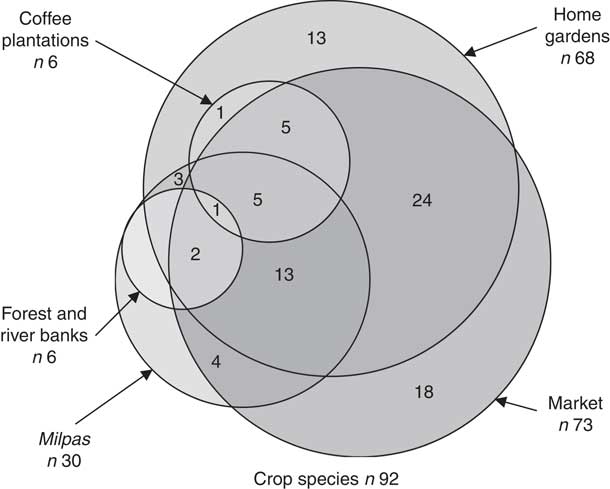
Fig. 2 Venn diagram of species found in the food systems of the sample of Mayan Achí people (154 randomly selected children aged 6–60 months and their 127 caregivers) from six rural villages in Guatemala, March–July 2016
The market was the richest food system in agrobiodiversity. The market was open all week long, but the main market days were Thursday and Sunday. On these days, farmers from different geographic regions took their produce to the market to sell it; thus, consumers could purchase a wide diversity of foods coming from the municipality villages (e.g. coffee from the highlands and tamarind from the lowlands), other regions of Guatemala (e.g. pineapple (Ananas comosus (L.) Merr.) and cantaloupe (Cucumis melo var. cantalupo Ser.)) or other countries (e.g. mangoes from Mexico). A substantial proportion of the sellers and consumers observed in the market were women who bought, sold and exchanged food.
Cultivated agrobiodiversity was not associated with the remoteness to the market. The price of public transportation to the market increased with the distance travelled. Consequently, a greater distance to the market was negatively correlated to the frequency of visits to it ( $r_{{(153)}}^{{\mathop{\rm s}\nolimits} } $
= −0·25, P < 0·01). Hence, it was expected that participants living far from the highly food-diverse market were more likely to cultivate higher agrobiodiversity in their own food system to increase food self-sufficiency and to compensate for the infrequent visits to the market. However, agrobiodiversity richness did not increase with the distance to the market. On the contrary, Village A, the closest village to the market, was more biodiverse than further villages, probably because the former was nearer to the river used for irrigation than the latter. Likewise, Village F, the remotest village to the market, showed the lowest cultivated agrobiodiversity, probably because the population of Village F was composed mainly of Ladino people; thus, their traditional ecological knowledge was smaller than other villages with more Mayan Achí people (e.g. Village A and Village E).
$r_{{(153)}}^{{\mathop{\rm s}\nolimits} } $
= −0·25, P < 0·01). Hence, it was expected that participants living far from the highly food-diverse market were more likely to cultivate higher agrobiodiversity in their own food system to increase food self-sufficiency and to compensate for the infrequent visits to the market. However, agrobiodiversity richness did not increase with the distance to the market. On the contrary, Village A, the closest village to the market, was more biodiverse than further villages, probably because the former was nearer to the river used for irrigation than the latter. Likewise, Village F, the remotest village to the market, showed the lowest cultivated agrobiodiversity, probably because the population of Village F was composed mainly of Ladino people; thus, their traditional ecological knowledge was smaller than other villages with more Mayan Achí people (e.g. Village A and Village E).
Women heading households reported the importance of cultivating greater biodiversity for food consumption and commercialization. However, there was no statistical difference between women- and men-headed households for crop species richness and NFD scores, probably due to the disproportionate sample size. Many of these women were widows from the civil war in the municipality and described agriculture as their main or sole economic activity. Similarly, women in male-headed households reported that home gardens, small animal husbandry (e.g. chickens and turkeys) and gathering of wild edible plants provided them with an extra income to complement their spouse’s earnings and to cover expenses related to health and education of their children.
The NFD scores showed that higher agrobiodiversity was associated with higher nutrient availability for participants, and that each food system was specialized in providing a specific set of nutrients, such as minerals, carbohydrates and proteins (Table 3). Home gardens were good suppliers of minerals (median NFDminerals = 33·37, interquartile range = 11·57) because they contained a large number of species from the ‘Dark-green leafy vegetables’ food group. Milpas supplied considerable quantities of carbohydrates and proteins (median NFDmacronutrients = 21·58, interquartile range = 34·84) because they contained maize and beans. But coffee plantations and tomato nurseries were mediocre suppliers of nutrients due to their low agrobiodiversity rate and the inclusion of nutrient-poor species, such as coffee. Farmers who cultivated diverse food systems could cover the nutrient requirements of their household; one food system could complement the nutrients supplied by another food system. Moreover, an increment of one species within the food systems was associated with a higher NFD by 1·52 % (r 2 = 0·77, P < 0·01); thus, increasing cultivated agrobiodiversity could also increase the probability of covering the nutrient requirements of a farmer’s household.
Table 3 Agrobiodiversity indicators of food production systems of the sample of Mayan Achí people (154 randomly selected children aged 6–60 months and their 127 caregivers) from six rural villages in Guatemala, March–July 2016

NFD, nutritional functional diversity; IQR, interquartile range.
Participation in nutrition-sensitive programmes, ethnicity and home garden ownership were good predictors of agrobiodiversity status. The participants who received local extension services, Extension Service(+), cultivated more crop species overall (median = 17·00 species) than people who did not receive assistance, Extension Service(–) (median = 14·00 species), U (131) = 2658·00, P < 0·05. Similarly, Extension Service(+) cultivated more crop species in their home gardens (mean = 13·27, sd = 5·29 species) compared with Extension Service(–) (mean = 11·20, sd = 5·03 species in home gardens), t (129) = 2·30, P < 0·05. In addition, results showed that crop species richness in the food systems belonging to Mayan Achí people (median = 16·00 species) was higher than that recorded in the Ladino people’ systems (median = 13·00 species), U (154) = 2129·50, P < 0·05. Also, Mayan Achí people cultivated more crop species in their home gardens (mean = 12·06, sd = 5·49 species) compared with Ladino people (mean = 9·23, sd = 4·37 species), t (154) = 2·48, P < 0·05. Finally, participants who owned a home garden, HG(+), cultivated more crop species overall (median = 16·00 species) than participants without a home garden, HG(–) (median = 7·50 species), U (151) = 3368·00, P < 0·01; meaning that home garden ownership encourages biodiversity conservation and use for food and nutrition.
Dietary diversity
The ‘Cereals’ food group was the most consumed group, while animal-source foods were the least consumed food type. Foods included in the ‘Cereals’ group represented 28·14 % of all the foods recalled by the participants. They recalled the consumption of ‘Cereals’ in every mealtime in the form of maize tortilla, the main food in Guatemala, or atol, a hot beverage made using nixtamalizedFootnote * maize, oats, amaranth or wheat flour. In contrast, foods included in the food groups of ‘Fish and seafood’, ‘Organ meats’ and ‘Flesh meats’ were the least consumed by the participants: 0·05, 0·13 and 1·01 %, respectively. The high cost and low availability of animal-source foods caused their low consumption; participants recalled their consumption exclusively during festivities or market days. However, participants had access to other good sources of proteins, such as the food groups of ‘Eggs’ (3·85 % of the foods recalled), ‘Milk and milk products’ (2·37 % of foods recalled) and ‘Legumes, nuts and seeds’ (5·29 % of foods recalled). Yet, consumption of beans was lower and less frequent than expected; it is possible that participants underestimated their consumption as the frequent consumption of beans was locally seen as a ‘poor people habit’.
Micronutrient-poor and energy-dense foods were frequently consumed in high quantities by participants. The ‘Sweets’ food group was the second most consumed food group: 19·28 % of the foods recalled were part of this group. Sugar was added to flavoured water, coffee and atol; often, participants mentioned that when sugar was lacking, they preferred not to drink any of those beverages. In addition, the food groups of ‘Spices, condiments and beverages’ and ‘Oils and fats’ respectively represented 13·22 and 2·22 % of all the foods recalled. High quantities of salt and oil were added to foods when cooking to enhance the taste of meals, and in the most limited situations, ‘tortilla with salt’ became a meal. Ultra-processed foods, such as pre-cooked noodles and potato chips, rich in salt and fats, represented 6·00 % of the foods consumed by the participants. The high consumption of sugar, salt and fats could explain the high prevalence of stunted child–overweight mother pairs observed in the region. In addition, the frequent consumption of coffee by children could also have contributed to the high prevalence of undernutrition because it prevents the correct utilization of nutrients, such as Fe absorption( Reference Dewey, Romero-Abal and de Sarrano 84 ).
Nutrient-rich plants were neglected in the diet of the participants. Foods included in the food groups of ‘Vitamin-A rich vegetables’, ‘Vitamin-A rich fruits’ and ‘Dark-green leafy vegetables’ accounted for 0·67, 1·16 and 3·79 % of all the foods recalled by the participants, respectively. This demonstrates a disparity between production and consumption; although American black nightshade, coriander, amaranth, radish and chayote were the top foods cultivated by participants, they did not lead the list of consumed foods (Fig. 3). Probably, self-produced foods were not sufficient to cover the household requirements, so the participants relied on purchasing additional foods in the market, which seemed to be unhealthy foods rich in sugar, salt and fats.

Fig. 3 Comparison of edible species consumed (![]() ) and produced (
) and produced (![]() ) by the sample of Mayan Achí people (154 randomly selected children aged 6–60 months and their 127 caregivers) from six rural villages in Guatemala, March–July 2016
) by the sample of Mayan Achí people (154 randomly selected children aged 6–60 months and their 127 caregivers) from six rural villages in Guatemala, March–July 2016

Fig. 4 Graphical summary of results: impact of agrobiodiversity on child nutrition through dietary diversification among the sample of Mayan Achí people (154 randomly selected children aged 6–60 months and their 127 caregivers) from six rural villages in Guatemala, March–July 2016
Higher dietary diversity scores of the participants were positively associated with increased agrobiodiversity status. The IYCDDS was positively correlated to total crop species richness ( $r_{{(58)}}^{{\mathop{\rm s}\nolimits} } $
= +0·26, P < 0·05) and home garden crop species richness (
$r_{{(58)}}^{{\mathop{\rm s}\nolimits} } $
= +0·26, P < 0·05) and home garden crop species richness ( $r_{{(58)}}^{{\mathop{\rm s}\nolimits} } $
= +0·31, P < 0·05). The IDDS was also positively correlated to total crop species richness (
$r_{{(58)}}^{{\mathop{\rm s}\nolimits} } $
= +0·31, P < 0·05). The IDDS was also positively correlated to total crop species richness ( $r_{{(96)}}^{{\mathop{\rm s}\nolimits} } $
= +0·39, P < 0·01) and home garden crop species richness (
$r_{{(96)}}^{{\mathop{\rm s}\nolimits} } $
= +0·39, P < 0·01) and home garden crop species richness ( $r_{{(96)}}^{{\mathop{\rm s}\nolimits} } $
= +0·43, P < 0·01). Similarly, NFD scores were positively correlated with IDDS (
$r_{{(96)}}^{{\mathop{\rm s}\nolimits} } $
= +0·43, P < 0·01). Similarly, NFD scores were positively correlated with IDDS ( $r_{{(96)}}^{{\mathop{\rm s}\nolimits} } $
= +0·32, P < 0·01), but were not correlated with IYCDDS. Livestock ownership was positively correlated to IYCDDS (
$r_{{(96)}}^{{\mathop{\rm s}\nolimits} } $
= +0·32, P < 0·01), but were not correlated with IYCDDS. Livestock ownership was positively correlated to IYCDDS ( $r_{{(58)}}^{{\mathop{\rm s}\nolimits} } $
= +0·29, P < 0·05) and IDDS (
$r_{{(58)}}^{{\mathop{\rm s}\nolimits} } $
= +0·29, P < 0·05) and IDDS ( $r_{{(96)}}^{{\mathop{\rm s}\nolimits} } $
= +0·33, P < 0·01). Ducks, chicken and turkeys were used for eggs and meat; pigs for meat; and cows for milk and rarely for meat production.
$r_{{(96)}}^{{\mathop{\rm s}\nolimits} } $
= +0·33, P < 0·01). Ducks, chicken and turkeys were used for eggs and meat; pigs for meat; and cows for milk and rarely for meat production.
Food self-sufficiency of participants increased along with cultivated agrobiodiversity. Self-produced foods accounted for 13·23 % of participants’ diets, and it was positively correlated to total crop species richness ( $r_{{(154)}}^{{\mathop{\rm s}\nolimits} } $
= +0·48, P < 0·01). Also, the percentage of food items included in the diet coming from home gardens (8·44 % on average) was positively correlated to crop species richness of home gardens (
$r_{{(154)}}^{{\mathop{\rm s}\nolimits} } $
= +0·48, P < 0·01). Also, the percentage of food items included in the diet coming from home gardens (8·44 % on average) was positively correlated to crop species richness of home gardens ( $r_{{(154)}}^{{\mathop{\rm s}\nolimits} } $
= +0·50, P < 0·01). Similarly, results showed that the percentage of self-produced food items included in the diet was different between HG(+) (median(117) = 13·33 %) and HG(−) (median(34) = 0·00 %), U
(151) = 3035·50, P < 0·01.
$r_{{(154)}}^{{\mathop{\rm s}\nolimits} } $
= +0·50, P < 0·01). Similarly, results showed that the percentage of self-produced food items included in the diet was different between HG(+) (median(117) = 13·33 %) and HG(−) (median(34) = 0·00 %), U
(151) = 3035·50, P < 0·01.
Consumption of wild edible plants was not different between Mayan Achí and Ladino people. It was expected that Indigenous Mayan Achí people would consume wild edible plants more frequently than Ladino people because they possess more traditional ecological knowledge( Reference Turreira-García, Theilade and Meilby 65 ); however, the difference between the groups was not statistically significant, U = 870·50, P = 0·486. The proportion of consumed food items gathered in the forest or on the shore of the riverbank (1·94 % on average) was very small in comparison to the proportion of self-produced (13·23 % on average) or purchased food items (~60 %). Many participants pointed out that wild edible plants are less frequently observed in the parcels and forest due to the increased use of ‘poison’, the term they used for chemical pesticides and herbicides, that ‘have killed the soil’.
The correlations between maternal education and IYCDDS and IDDS were not significant. Yet, longer maternal schooling (years) was positively correlated with better socio-economic status ( $r_{{(150)}}^{{\mathop{\rm s}\nolimits} } $
= +0·40, P < 0·01), greater food items included in the child diet (
$r_{{(150)}}^{{\mathop{\rm s}\nolimits} } $
= +0·40, P < 0·01), greater food items included in the child diet ( $r_{{(150)}}^{{\mathop{\rm s}\nolimits} } $
= +0·19, P < 0·05) and higher household dietary diversity scores (
$r_{{(150)}}^{{\mathop{\rm s}\nolimits} } $
= +0·19, P < 0·05) and higher household dietary diversity scores ( $r_{{(150)}}^{{\mathop{\rm s}\nolimits} } $
= +0·21, P < 0·05), a proxy of food accessibility(
Reference Cafiero, Melgar-Quiñonez and Ballard
85
). Probably, more educated women were more likely to get a better job and higher income than less-educated women, which improved their food access. However, socio-economic status was not directly correlated with IYCDDS nor IDDS; probably, the extra income was used to purchase foods other than nutrient-rich ones, such as sugar or ultra-processed foods. The frequency of visits to market was positively correlated to items included in the daily diet (
$r_{{(150)}}^{{\mathop{\rm s}\nolimits} } $
= +0·21, P < 0·05), a proxy of food accessibility(
Reference Cafiero, Melgar-Quiñonez and Ballard
85
). Probably, more educated women were more likely to get a better job and higher income than less-educated women, which improved their food access. However, socio-economic status was not directly correlated with IYCDDS nor IDDS; probably, the extra income was used to purchase foods other than nutrient-rich ones, such as sugar or ultra-processed foods. The frequency of visits to market was positively correlated to items included in the daily diet ( $r_{{(153)}}^{{\mathop{\rm s}\nolimits} } $
= +0·19, P < 0·05), household dietary diversity scores (
$r_{{(153)}}^{{\mathop{\rm s}\nolimits} } $
= +0·19, P < 0·05), household dietary diversity scores ( $r_{{(153)}}^{{\mathop{\rm s}\nolimits} } $
= +0·22, P < 0·01) and IDDS (
$r_{{(153)}}^{{\mathop{\rm s}\nolimits} } $
= +0·22, P < 0·01) and IDDS ( $r_{{(96)}}^{{\mathop{\rm s}\nolimits} } $
= +0·22, P < 0·05).
$r_{{(96)}}^{{\mathop{\rm s}\nolimits} } $
= +0·22, P < 0·05).
Child anthropometric status
Child undernutrition was extensive in the municipality. Stunting was the most prevalent malnutrition issue (60·40 % of participant children) followed by underweight (19·50 %) and wasting (1·30 %). No statistically significant correlation was found between child anthropometric status and dietary diversity scores, as expected, but there were other variables (i.e. child morbidity, socio-economic status, and maternal education and age) with a stronger association to child anthropometric status than diet.
Child morbidity was negatively associated with child anthropometric status. Children who had suffered from infections the month prior to the interview were more likely to have lower weight than healthy children. WAZ was statistically smaller in sick children (mean = −1·40, sd = 0·95) than in healthy children (mean = −0·86, sd = 0·96), t (83) = 2·45, P < 0·05; and WHZ was statistically smaller in sick children (mean = −0·17, sd = 1·13) than in healthy children (mean = 0·33, sd = 0·86), t (83) = 2·06, P < 0·05.
Socio-economic status might affect anthropometric status through WASH conditions. Agrobiodiversity status and dietary diversity scores were not correlated to anthropometric status nor socio-economic status. But, better socio-economic status was positively correlated to greater HAZ ( $r_{{(154)}}^{{\mathop{\rm p}\nolimits} } $
= +0·17, P < 0·05) and greater WAZ (
$r_{{(154)}}^{{\mathop{\rm p}\nolimits} } $
= +0·17, P < 0·05) and greater WAZ ( $r_{{(154)}}^{{\mathop{\rm p}\nolimits} } $
= +0·22, P < 0·01). Probably, socio-economic status was associated with nutrition through pathways other than diet. In fact, socio-economic status reflected the housing conditions that could impact child health status, such as regular and drinking-water availability, management of residues and sanitation condition. Therefore, we speculate that socio-economic status determines the risk of sickness and thereby the anthropometric status of children.
$r_{{(154)}}^{{\mathop{\rm p}\nolimits} } $
= +0·22, P < 0·01). Probably, socio-economic status was associated with nutrition through pathways other than diet. In fact, socio-economic status reflected the housing conditions that could impact child health status, such as regular and drinking-water availability, management of residues and sanitation condition. Therefore, we speculate that socio-economic status determines the risk of sickness and thereby the anthropometric status of children.
Maternal education, age and number of children were associated with the children’s anthropometric status. Longer maternal schooling was positively correlated with greater HAZ ( $r_{{(150)}}^{{\mathop{\rm p}\nolimits} } $
= +0·20, P < 0·05) and greater maternal age was correlated with greater WAZ (
$r_{{(150)}}^{{\mathop{\rm p}\nolimits} } $
= +0·20, P < 0·05) and greater maternal age was correlated with greater WAZ ( $r_{{(149)}}^{{\mathop{\rm p}\nolimits} } $
= +0·20, P < 0·05). Yet, age can be a confounding variable because mother’s age was positively associated to the number of people living in the house (
$r_{{(149)}}^{{\mathop{\rm p}\nolimits} } $
= +0·20, P < 0·05). Yet, age can be a confounding variable because mother’s age was positively associated to the number of people living in the house ( $r_{{(146)}}^{{\mathop{\rm s}\nolimits} } $
= +0·44, P < 0·01), which in turn could reduce availability of and access to resources, such as food.
$r_{{(146)}}^{{\mathop{\rm s}\nolimits} } $
= +0·44, P < 0·01), which in turn could reduce availability of and access to resources, such as food.
Figure 4 presents a graphic summarizing the present results on the impact of agrobiodiversity on child nutrition through dietary diversification.
Discussion
Interventions focused on conservation and sustainable use of agrobiodiversity have the potential to improve public health nutrition by increasing dietary diversity. In the present and other studies, cultivated agrobiodiversity (i.e. crop species richness and livestock ownership) was associated with higher dietary quality (i.e. dietary diversity scores)( Reference Jones 35 , Reference Jones, Shrinivas and Bezner-Kerr 40 – Reference Ekesa, Walingo and Abukutsa-Onyango 44 , Reference Bellon, Ntandou-Bouzitou and Caracciolo 48 , Reference Pellegrini and Tasciotti 86 ). The farmers cultivating more agrobiodiversity consumed more micronutrient-rich food groups (i.e ‘Dark-green leafy vegetables’ and ‘Vitamin A-rich vegetables and fruits’)( Reference Jones, Shrinivas and Bezner-Kerr 40 ) and had better dietary diversity scores( Reference Jones 35 , Reference Olney, Talukder and Iannotti 46 , Reference Keding, Msuya and Maass 87 ) than farmers cultivating less agrobiodiversity. Agrobiodiverse food systems can supply nutritious foods and diversify diets, and, in turn, improve nutrition.
In fact, higher cultivated agrobiodiversity can supply more variety and increased availability of nutrients (i.e. NFD scores). We found that the more species farmers cultivated, the more chances nutrient variety and availability would increase. This was especially true when local wild edible plants were cultivated by farmers because these species are good sources of Fe, Ca, vitamin C and vitamin A( 77 ). Our results are consistent with studies in Malawi( Reference Luckett, Declerck and Fanzo 76 ), Kenya( Reference DeClerck, Fanzo and Palm 23 ) and in the Millennium Villages Project in Africa( Reference Remans, Flynn and DeClerck 88 ) where higher crop species richness was correlated with higher NFD scores, and, thus, with more nutritional diverse food systems.
Likewise, food self-sufficiency can be improved by cultivated agrobiodiversity. The farmers producing more food types consumed a higher proportion of self-produced nutritious foods( Reference Jones 35 , Reference Oyarzun, Mary Borja and Sherwood 36 , Reference Olney, Talukder and Iannotti 46 , Reference Faber, Phungula and Venter 89 ). However, they consumed more micronutrient-poor, energy-dense food groups (i.e. ‘Cereals’ and ‘Sweets’ and ‘Oils and fats’) than micronutrient-rich food groups. The production of micronutrient-rich foods was probably not sufficient to cover the participants’ nutritional requirements, and their price was higher than the price of unhealthy foods. Consequently, participants preferred to buy unhealthy foods to cover their requirements and, on some occasions, to sell their self-produced nutritious foods. Therefore, yields of nutritious foods should be increased and sustained over time to improve food self-sufficiency and dietary diversity.
For the reasons listed above, we support the idea that agrobiodiverse agriculture can provide higher nutritional benefits to farmers’ households than specialized agriculture. The excessive consumption of ultra-processed foods makes us think that interventions based on specialization for improving agricultural revenues, supported by some scholars( Reference Koppmair, Kassie and Qaim 42 , Reference Sibhatu, Krishna and Qaim 43 ), would not increase consumption of healthy foods. Our view is that specialization will accelerate the dietary transition towards processed foods that is already happening in the region( Reference Dewey 34 ) and thus worsen the incidence of diet-related diseases. Enhancing nutritional education( Reference Jones, Shrinivas and Bezner-Kerr 40 , Reference Faber, Phungula and Venter 89 – Reference Brauw, de Eozenou and Moursi 92 ), empowering women( Reference Olney, Talukder and Iannotti 46 , Reference Jones, Cruz Agudo and Galway 55 , Reference Malapit, Kadiyala and Quisumbing 56 , Reference Keding, Msuya and Maass 87 ) and increasing yields of vegetables and fruits over time could motivate cultivation and consumption of nutritious foods.
However, agrobiodiversity cannot improve nutrition if food utilization is hampered by morbidity. Food utilization, the way the body makes the most of dietary nutrients, can be enhanced through improving health status, household characteristics and WASH conditions. In the present study and others, the association between dietary diversity scores and child anthropometric status was not significant( Reference Vanek, Jones and Drinkwater 39 , Reference Remans, Flynn and DeClerck 88 , Reference Schipani, van der Haar and Sinawat 93 , Reference Makhotla and Hendriks 94 ) probably because children were frequently sick; we found a strong correlation between child morbidity and undernutrition( Reference Kidala, Greiner and Gebre-Medhin 51 , Reference Azzarri, Zezza and Haile 57 , Reference English and Badcock 95 ). Infections could compromise the integrity of the digestive and immunological system, affecting the absorption and proper use of consumed nutrients( Reference Humphrey, Jones and Manges 96 ). Poor WASH and housing conditions, reflected in the socio-economic status, could increase the risk of infections in children and thus child undernutrition.
Other underlying factors, such as poverty and low education, can also affect food utilization and prevent agrobiodiversity from improving nutrition. In the present study, poor family planning( Reference Sereebutra, Solomons and Aliyu 97 ) and the number of household members( Reference Koppmair, Kassie and Qaim 42 ) were negatively associated with child anthropometric status, probably because they compromised sanitation conditions and food availability. Other studies carried out in Guatemala have also shown that low maternal education and poor housing quality( Reference Pebley and Goldman 98 ), frequent parasitic infections( Reference Sereebutra, Solomons and Aliyu 97 ), Mayan ethnicity( Reference Reurings, Vossenaar and Doak 99 ) and early age at first parturition( Reference Martorell and Young 100 ) negatively affected child anthropometric status. In Guatemala, poverty and undernourishment are persistent problems within the ethnic Mayan people because they are severely discriminated against and have limited access to jobs and public services (e.g. roads, water, electricity, health care and education)( Reference Loewenberg 101 , Reference Solomons, Vossenaar and Chomat 102 ).
Finally, agrobiodiverse agriculture can be translated into improved nutrition only if the nutritious foods produced are consumed by growing children and women of reproductive age. Especially children in their first 1000 d of life and pregnant or lactating women require more nutrients than people in another life stage. However, in some regions, such as Guatemala, food is preferably allocated to older boys, men and elders( Reference Webb Girard, Self and McAuliffe 33 ). Nutritional education and empowerment of women can also help to overcome the poor understanding and awareness of undernutrition( Reference Chary, Messmer and Sorenson 103 , Reference Brown, Henretty and Chary 104 ) and the unequal allocation of food within members of the household( Reference Webb Girard, Self and McAuliffe 33 , Reference Brown, Henretty and Chary 104 , Reference Wehr, Chary and Webb 105 ).
The present study used a cross-sectional design, so it could picture the status of agrobiodiversity and its impact on dietary diversity at a particular moment. Future studies would benefit from adopting a longitudinal design that would better describe the changes in food production systems due seasonal variations (e.g. rainfall and climate changes), fluctuations in food prices and availability at the market, and the changes in the height and weight of children.
Conclusion
Agricultural interventions that increase agrobiodiversity of both crops and livestock, for food production, are promising alternatives diversifying diets and increasing nutrient intakes. However, such interventions need to be accompanied with substantial improvements in WASH and housing conditions to reduce child morbidity and thus increase food utilization. In addition, these interventions need to include an important level of focus on family planning, nutritional education, and Indigenous and women’s empowerment. We propose that agricultural interventions including all these elements could improve child nutrition through dietary diversification.
Acknowledgements
Acknowledgements: The authors are grateful for the help and guidance provided by Juan Jose Castillo Mont and David Elías Mendieta Jiménez from the herbarium of University of San Carlos of Guatemala and Stephen Onakuse from University College Cork. Also, special thanks are extended to the Association X for its kind support, especially Rosalia, Sarah and the team of nutrition extensionists. The authors thank the two anonymous reviewers and Dr Brian W.W. Grout whose comments helped improve and clarify this manuscript. Financial support: This study was supported by the National Council of Science and Technology of Mexico (CONACYT) (scholarship number 383742). CONACYT had no role in the design, analysis or writing of this article. Conflict of interests: None. Authorship: D.V.L.-G. formulated the research question, designed the study, carried out the fieldwork and collected the plant specimens, analysed the gathered data and wrote the manuscript. M.S. was involved in the research question formulation, study design, taxonomic identification and manuscript review. All authors read and approved the final manuscript. Ethics of human subject participation: Verbal consent was witnessed and formally recorded.


