


A move to a more sustainable diet has been promoted as a way to reduce the impact of human activities on the planet(1) and improve population health(2). Food consumption is responsible for up to 30% of the environmental impact of households(Reference Notarnicola, Tassielli and Renaulli3–4). Diet-associated GHGE (greenhouse gas emissions) have been estimated in several studies, however, very few have estimated them from diets recorded by consumers themselves (self-selected diets)(Reference Perignon, Vieux and Soler5). The aim of this study was to update estimates of diet-associated GHGE(Reference Green, Milner and Dangour6–Reference Horgan, Perrin and Whybrow7) for the whole of the UK population using self-selected diets from years 1–6 of the NDNS(8) by developing a new GHGE database for all foods in the NDNS food nutrient database.
GHGE data for individual foods and dishes were matched to NDNS nutritional tables. Where a GHGE value for a specific item was not available, reasonable substitute data was used based on similarities in food type and composition. Mean daily GHGE per person were estimated for all individuals in the NDNS (years 1–6). Percentage contribution of food groups to mean daily GHGE was calculated using the NDNS food groups. Statistical significance between demographic groups was tested using ANOVA and general linear model. Statistical significance level from two-sided hypotheses was set at P ≤ 0·05. NDNS data was obtained from the UK Data Archive.
GHGE data were matched to 91% of the individual foods or food products in the NDNS.
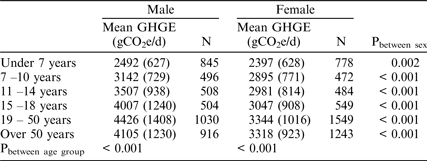
For the UK population the mean individual daily diet-associated GHGE ranged from 170 to 13,673 gCO2e/d. Adults had significantly higher mean GHGE than children (under 18 years) for both males 4,273 gCO2e/d (range 354 – 13,673) vs 3,149 gCO2e/d (ranging from 658 to 9,043) and females 3,364 gCO2e/d (range 532 – 8,483) vs 2,765 gCO2e/d (ranging from 170 to 9,996) (Table). GHGE was significantly different between males and females (P ≤ 0.001).
Meat and dairy were the major contributors to the GHGE associated with UK diets. In adults, this was from beef dishes (9%) and in children (under 18 years) chicken dishes (6%). The contribution of beef dishes increased with age. Between males and females beef dishes contributed similarly to GHGE (8%).
This study is unique in estimating dietary GHGE across the population including children and one of the first studies to include all the food groups in the diet. If we are to reduce dietary GHGE in line with recommendations, we need to understand the patterns of existing consumption.

