


Implications
The results of this study showed that the protein quality in products from dairy systems (milk and beef) is up to 1.87 higher than the quality of the potentially human-edible protein input via feeds. This suggests that these differences must be considered when evaluating the role of livestock systems for human food supply and probably also when assessing environ1mental impacts of the production of different protein sources.
Introduction
Proteins are among the most important nutrients in human diets, and an adequate protein supply is a prerequisite for normal growth and development of all organs in the body (Boye et al., Reference Boye, Wijesinha-Bettoni and Burlingame2012). Adequate protein supply is defined as the ability of dietary proteins to meet the body’s nutritional demands and depends not only on the amount of protein provided, but also on the protein quality in terms of the balance of (essential) amino acids and their digestibility (Neumann et al., Reference Neumann, Harris and Rogers2002; World Health Organization (WHO) et al., 2007). For the assessment of protein quality, the digestible indispensable amino acid score (DIAAS) has been proposed recently by the Food and Agriculture Organization of the United Nations (FAO) as the preferred method to describe dietary protein quality (FAO, 2013). It will replace the protein digestibility-corrected amino acid score (PDCAAS) (FAO and WHO, 1991), which was used to assess protein quality for more than 20 years. Amino acid scores are defined as the content of the first limiting indispensable amino acid in the test protein over the content of the same amino acid in a reference protein (Schaafsma, Reference Schaafsma2012). For PDCAAS, the amino acid score is corrected for true faecal nitrogen digestibility, whereas DIAAS uses true ileal amino acid digestibility (TID) of each indispensable amino acid (Rutherfurd et al., Reference Rutherfurd and Moughan2015). Regarding quality, animal-source proteins are usually superior as compared with plant proteins and they are an important contributor to the human protein supply worldwide. However, in terms of food security, the production of animal-source proteins is often criticized because of the low conversion efficiency of plant proteins from feeds into animal proteins (<15%) (Aiking, Reference Aiking2011). Although this general critique may be justified, it does not take into account that not all animal feeds are suitable for direct human consumption and that the transformation of these human-inedible feedstuffs via livestock can have strong positive effects on food security (FAO, 2011; Smith et al., Reference Smith, Sones, Grace, MacMillan, Tarawali and Herrero2013; Reynolds et al., Reference Reynolds, Wulster-Radcliffe, Aaron and Davis2015).
Among various existing concepts, one way to measure the net contribution of livestock to human food supply is the human-edible feed conversion efficiency (heFCE), defined as human-edible output via the animal products divided by the potentially human-edible input via feedstuffs (Wilkinson, Reference Wilkinson2011; Ertl et al., Reference Ertl, Klocker, Hörtenhuber, Knaus and Zollitsch2015).
Concepts such as heFCE, however, are only quantitative measurements of the (relative) net contribution of livestock to human food supply and do not consider the profound differences in protein quality between animal products and potentially human-edible plant protein inputs. To adequately assess the contribution of livestock to human protein supply, however, both quantitative and qualitative aspects need to be considered. Therefore, the aim of the present work was to develop an approach for determining the changes in protein quality that result from the transformation of human-edible protein from plants into animal products via livestock systems and to combine these changes with the quantitative concept of the heFCE. Data from commercial dairy farms were used as a case study and protein quality was assessed using DIAAS, as well as PDCAAS.
Material and methods
Data sources and calculations
On-farm data were derived from 30 dairy farms during a national research project assessing the sustainability status of different Austrian dairy production systems. On average, these farms kept 28 dairy cows, with an annual milk yield of about 7540 kg energy-corrected milk/cow and an average concentrate supplementation of 0.287 kg/kg energy-corrected milk (Hörtenhuber et al., Reference Hörtenhuber, Kirner, Neumayr, Quendler, Strauss, Drapela and W Zollitsch2013). A more detailed overview of the main farm characteristics and production data has been given elsewhere (Ertl et al., Reference Ertl, Klocker, Hörtenhuber, Knaus and Zollitsch2015). Calculations of potentially human-edible protein inputs via feedstuffs, as well as protein outputs via animal products were performed as described in detail in Ertl et al. (Reference Ertl, Klocker, Hörtenhuber, Knaus and Zollitsch2015). The amount of potentially human-edible protein from feedstuffs was estimated based on current standard technology for protein extraction for each feedstuff (i.e. the medium scenario; Ertl et al., Reference Ertl, Klocker, Hörtenhuber, Knaus and Zollitsch2015). For the calculations in this study, only feedstuffs containing potentially human-edible protein were considered, as protein quality of human-inedible feedstuffs (such as forages) is not relevant for the research question. CP content, as well as amino acid composition of feedstuffs were obtained from an online feed database (National Institute of Agricultural Research et al., 2015).
Calculation of protein digestibility-corrected amino acid score
The PDCAAS of each individual human-edible input via feedstuffs and human-edible output via animal products was calculated according to FAO and WHO (1991) as follows:
 $$\eqalignno{ & {{\rm PDCAAS}\,{\rm (\,\%\,)} \,{\equals}}\,{\displaystyle{{\rm mg} \ {\rm of} \ {\rm limiting} \ {\rm amino} \ {\rm acid} \ {\rm in} \ {\rm 1}\:{\rm g} \ {\rm of} \ {\rm the \ dietary} \ {\rm protein}} \over \displaystyle{{\rm mg} \ {\rm of} \ {\rm same} \ {\rm amino} \ {\rm acid} \ {\rm in} \ {\rm 1}\:{\rm g} \ {\rm of} \ {\rm the \ reference} \ {\rm protein}}} \cr &\qquad\qquad\qquad {\times}{\rm true} \ {\rm faecal} \ {\rm digestibility} \ {\rm (\,\%\,)}{\times}{\rm 100} $$
Values for true faecal digestibility for rye, barley, wheat bran and all other feedstuffs as well as milk and meat were obtained from Pedersen and Eggum (Reference Pedersen and Eggum1983a, Reference Pedersen and Eggum1983b), Rutherfurd et al. (Reference Rutherfurd and Moughan2015) and FAO and WHO (1991), respectively. The reference indispensable amino acid profile in the reference protein was the amino acid requirement pattern for a 6-month to 3-year-old child as suggested in FAO (2013). Values of PDCAAS>100 where either truncated to 100% (PDCAAS t ) as suggested when the PDCAAS was introduced (FAO and WHO, 1991), or kept without truncation (PDCAAS) to include the potential of high-quality proteins to complement proteins lacking in indispensable amino acids in mixed diets (Boye et al., Reference Boye, Wijesinha-Bettoni and Burlingame2012; Rutherfurd et al., Reference Rutherfurd and Moughan2015). In addition to calculating PDCAAS for single inputs and outputs, PDCAAS were calculated on a barn-gate level, considering all human-edible inputs and all human-edible outputs together as an input and an output mixture, respectively, in order to account for a potentially higher protein quality of mixtures as compared with individual protein sources. The content of each amino acid in these mixtures was calculated as the sum of human-edible faecal digestible protein (kg) for each input and output times the respective amino acid content, divided by the original amount of human-edible protein present in the diet as proposed by Boye et al. (Reference Boye, Wijesinha-Bettoni and Burlingame2012).
Calculation of digestible indispensable amino acid score
The DIAAS for individual human-edible inputs and outputs were calculated as suggested by the FAO (2013) as follows:
 $${\rm DIAAS} \ {\rm (\,\%\,)\,{\equals}} & \,{\displaystyle{{\rm mg} \ {\rm of} \ {\rm digestible} \ {\rm indispensable} \ {\rm amino} \ {\rm acid} \atop {\rm in} \ {\rm 1}\:{\rm g} \ {\rm of} \ {\rm the} \ {\rm dietary} \ {\rm protein}} \over \displaystyle{{\rm mg} \ {\rm of} \ {\rm the} \ {\rm same} \ {\rm indispensable} \ {\rm amino} \ {\rm acid} \atop {\rm in} \ {\rm 1}\:{\rm g} \ {\rm of} \ {\rm the} \ {\rm reference} \ {\rm protein}}}{\times}100$$
For the amino acid profile of the reference protein, the amino acid requirement pattern for a 6-month to 3-year-old child was taken (FAO, 2013). Due to limited data on ileal digestibility in humans, TID was predicted as suggested in FAO (2013) from TID in pigs based on the following equation of Deglaire and Moughan (Reference Deglaire and Moughan2012):
 $${\rm TID} \ {\rm in} \ {\rm humans}\,(\,\%\,)\,{\equals}\,1.05{\times}{\rm TID} \ {\rm in} \ {\rm pigs} \ {\rm (\,\%\,)}\,{\minus}\,0.06$$
TID for pigs was obtained from the French Association for Animal Production et al. (2000), and DIAAS values exceeding 100% were not truncated (FAO, 2013). For all soy protein inputs, TID values for soy concentrates were taken. The DIAAS for the mixture of human-edible inputs and outputs at the barn-gate were calculated based on weighted average true ileal digestible amino acid contents of the mixtures as stated in FAO (2013). Data were analysed using the GLM procedure of the statistical software package SAS 9.2 (SAS Institute Inc., Cary, NY, USA), with ‘farm’ included as a fixed effect in the model.
Results
Protein scores for inputs and outputs
Values for PDCAAS t , PDCAAS and DIAAS, as well as the differences between PDCAAS t and DIAAS for all individual potentially human-edible protein inputs and outputs of selected dairy farms are shown in Table 1. The PDCAAS t for plant proteins were on average 30.2% points lower than for the animal-source proteins, whereas for PDCAAS and DIAAS these differences were 45% and 52.6% points, respectively.
Table 1 Protein digestibility-corrected amino acid scores truncated (PDCAAS t ) or without truncation (PDCAAS) and digestible indispensable amino acid scores (DIAAS) for individual protein sources

For mixtures of human-edible protein outputs, PDCAAS t , PDCAAS and DIAAS were on average 1.40, 1.66 and 1.87 times higher, respectively, when compared with scores for human-edible protein input mixtures on the barn-gate level (Table 2). A strong relationship was found between DIAAS and the ratio of kilogram CP supplied by cereal feeds (all concentrate feedstuffs with a CP content <20% on a dry matter basis) to kilogram CP derived from protein feeds (>20% CP on a dry matter basis) (Figure 1). This relationship was similar for PDCAAS (data not shown).
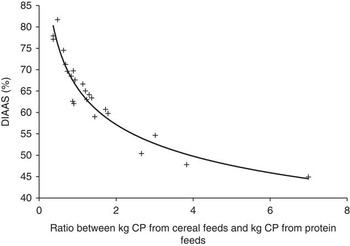
Figure 1 Relationship between digestible indispensable amino acid score (DIAAS) for a mixture of potentially human-edible inputs and the ratio of kilogram CP supplied by cereal feeds (all feedstuffs containing a potential human-edible fraction with a CP content of <20% in the dry matter) to kilogram CP supplied by protein feeds (>20% CP in the dry matter) on selected dairy farms (n=29); y=65.69 ×−0.2 (R 2=0.92).
Table 2 Least square means for protein digestibility-corrected amino acid score truncated (PDCAAS t ) or without truncation (PDCAAS), as well as digestible indispensable amino acid score (DIAAS) for mixtures of human-edible protein inputs and outputs at barn-gate of selected dairy farms (n=30)

a,b,cValues within a row with different superscripts differ at P<0.01.
Protein quality changes and their combination with quantitative changes
The method used to assess protein scores had strong effects on the protein quality ratio (PQR), defined as protein score of the output divided by the protein quality score of the input. The PQR was lowest for PDCAAS t (1.40) and highest for DIAAS (1.87) (Table 2). Combining this qualitative ratio (PQR) with the quantitative changes in human-edible protein for the same farms (with an average heFCE of 1.15 (Ertl et al., Reference Ertl, Klocker, Hörtenhuber, Knaus and Zollitsch2015)), resulted in one single value (heFCE×PQR), which was on average between 1.61 and 2.15 for the 30 case study farms, depending on the method used to determine protein quality. The effect of the combination of the quantitative heFCE with the qualitative PQR (heFCE×PQR) on the net contribution to human protein supply of the individual farms compared with heFCE alone, is shown in Figure 2 (using DIAAS to calculate PQR). Considering only the quantitative heFCE for protein, not >50% of the farms achieved a value >1, but when PQR is included (heFCE×PQR), 90% of the case study farms reached values >1.
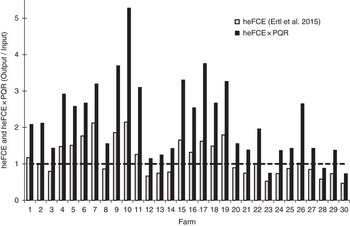
Figure 2 Human-edible feed conversion efficiency (heFCE) and human-edible feed conversion efficiency times protein quality ratio(PQR) (heFCE×PQR) for selected Austrian dairy farms (using digestible indispensable amino acid score to determine protein quality).
Discussion
Protein quality evaluation and methodological limitations
Over the last few decades, several methods have been established for evaluating protein quality, as reviewed by Boye et al. (Reference Boye, Wijesinha-Bettoni and Burlingame2012). In 1989, a group of FAO and WHO expert consultants proposed the use of the PDCAAS to determine protein quality (FAO and WHO, 1991) and it has been the preferred method since then. However, the approach has also been criticized for its technical limitations. Especially, the use of faecal rather than ileal protein digestibility, as well as the truncation of PDCAAS>100% to 100% were considered inaccurate, leading to an underestimation of high-quality proteins (Schaafsma, Reference Schaafsma2012; Leser, Reference Leser2013). To overcome these limitations, the DIAAS was proposed as a more accurate method of evaluating protein quality. Before its general implementation, however, more scientific data, mainly on TID, are needed (FAO, 2013). Nevertheless, both PDCAAS and DIAAS were calculated in this study because it has been shown recently that the use of PDCAAS compared with DIAAS overestimates the nutritional value of lower quality (plant) proteins (Rutherfurd et al., Reference Rutherfurd and Moughan2015). Thus, calculating only PDCAAS might, with the current scientific understanding of protein quality evaluation, lead to inaccurate conclusions on the magnitude of protein quality changes when potentially human-edible feed plant protein is transformed into animal protein.
Protein scores of >100% (both for DIAAS and PDCAAS) can never be used when assessing the protein quality of complete diets, or when the score is used to adjust protein intake to meet nutritional requirements (safe protein intake=safe protein requirement/DIAAS or PDCAAS), because this would mean that for high-quality proteins, the safe intake is lower than the safe requirement (Millward, Reference Millward2012; FAO, 2013). Although human-edible plant protein inputs and animal protein outputs were considered as mixtures to calculate scores on a barn-gate level (Table 2), these mixtures are neither sole protein sources in the human diet, nor are scores used to adjust protein intakes; therefore, no truncation of DIAAS or PDCAAS>100% is necessary. Truncation of scores >100% is particularly critical when comparing the value of animal and legume proteins because in this case, using truncated scores suggests that these proteins are of similar quality, whereas absolute values show that animal-source proteins are superior (Tome, Reference Tome2012). Thus, regarding protein quality in the debate on feed v. food competition, the truncation of scores >100% is an important issue. This is demonstrated by the results in Table 2, where the ratio of PDCAAS for animal protein output to plant protein input was 18.6% higher when using PDCAAS as compared with PDCAAS t .
Depending on the study, TID can vary strongly for the same foods (Gilani et al., Reference Gilani, Xiao and Cockell2012a), resulting in variations in DIAAS. For example, DIAAS of 58% (Rutherfurd et al., Reference Rutherfurd and Moughan2015), 64% (FAO, 2013) and over 70% (Wolfe, Reference Wolfe2015) have been reported for peas, as compared with the 65% calculated in this study. In addition, DIAAS and PDCAAS also vary for the same protein source, depending on the type of processing involved. For cooked peas for example, the DIAAS (58%) and PDCAAS (60%) are much lower than for a pea protein concentrate (82% and 89%, respectively) (Rutherfurd et al., Reference Rutherfurd and Moughan2015). Consequently, the scores presented in Table 1 for individual commodities represent only average values and may vary to a smaller or greater extent in practice, depending on various factors such as variety or processing technology.
Our calculated scores also only consider digestible, but not available amino acids, which might be inadequate for some essential amino acids especially in processed foods (Rutherfurd and Moughan, Reference Rutherfurd, Fanning, Miller and Moughan2012; FAO, 2013). Furthermore, these scores do not include potential negative effects of antinutritional factors present in plant protein sources on amino acid digestibility (Gilani et al., Reference Gilani, Tomé, Moughan and Burlingame2012b). Nor do scores for input and output mixtures consider potential interactions between the different protein sources, affecting overall digestibility (e.g. fibre content or antinutritional factors). Nevertheless, the calculated DIAAS show a reasonable consensus with published DIAAS (e.g. for wheat, barley and rye DIAAS of 40%, 47% and 48%, respectively, were calculated in this study, whereas Cervantes-Pahm et al. (Reference Cervantes-Pahm, Liu and Stein2014) reported DIAAS of 43%, 51% and 47% for these cereal grains). This suggests that calculating DIAAS (and also PDCAAS) based on available data is probably sufficient to demonstrate the magnitude of quality changes that occur during the transformation of potentially human-edible plant proteins to animal proteins via livestock systems.
Relevance of protein quality in the contribution of dairy cows to net protein supply
Excluding the differences in protein quality from the debate about plant v. animal proteins has been justified recently by the fact that modern western diets include more proteins than needed (Nijdam et al., Reference Nijdam, Rood and Westhoek2012). From a global perspective, however, this argumentation is a problematic generalization for several reasons: protein quality is very important for the assessment of the adequacy of the protein supply in developing and newly industrialized countries. It has been shown, for example, that at a national level the quality of available protein is connected to the prevalence of stunting (Ghosh et al., Reference Ghosh, Suri and Uauy2012). The consumption of high-quality milk proteins is also linked to a reduced prevalence of some metabolic disorders, not only in the developing world (McGregor and Poppitt, Reference McGregor and Poppitt2013). Furthermore, essential amino acid requirements can be met with a lower caloric intake when amino acids are supplied via high-quality proteins as compared with lower quality proteins, which is especially important for elderly people, for whom a protein intake above requirements is connected to a better health status (Wolfe, Reference Wolfe2015). Thus, when evaluating the role of dairy cows in terms of their contribution to human protein supply, for example, via the heFCE (Wilkinson, Reference Wilkinson2011; Ertl et al., Reference Ertl, Klocker, Hörtenhuber, Knaus and Zollitsch2015) or the land use ratio (LUR) (van Zanten et al., Reference van Zanten, Mollenhorst, Klootwijk, van Middelaar and de Boer2015), it is essential to consider not only the quantities of CP or of digestible protein. The protein quality differences between the human-edible animal protein output and the potentially human-edible plant protein input in terms of digestible amino acids also need to be taken into account.
The quality of the potentially human-edible protein input strongly depends on the ratio between dietary CP inputs via cereal feedstuffs and CP via protein-rich feedstuffs (Figure 1). This is due to the fact that cereal feeds have usually a lower protein quality compared with protein feeds (Table 1) (Leser, Reference Leser2013; Rutherfurd et al., Reference Rutherfurd and Moughan2015). These differences also explain differences between the individual dairy farms. The farms number 7 and 10 in Figure 2 for example, have a similar heFCE of about 2.1, whereas their contribution to human protein supply with quality differences included (heFCE×PQR), is 3.2 and 5.3 for farms number 7 and 10, respectively. Hence, PQR is higher for farm number 10 as compared with farm number 7. This is because potentially human-edible protein on farm number 10 originates solely from cereal feeds (barley, corn, triticale and rye), whereas on farm number 7, over 70% of human-edible protein is sourced from soy and rapeseed proteins. Thus, when mainly high-quality plant proteins such as soy are fed, the PQR decreases, as does the necessity to consider differences in protein quality via PQR, whereas at higher inclusion rates of cereal feeds, these differences are more profound.
Practical implications
For an adequate assessment of the net contribution of dairy and other animal production systems to the human food supply, changes in protein quality need to be considered together with quantitative changes in human-edible protein (kilogram output compared with kilogram input, e.g. via heFCE). Combining quantitative (heFCE) and qualitative changes (PQR) results in one single value (heFCE×PQR), describing the efficiency of transforming potentially human-edible plant proteins from feeds into animal-source proteins. The average heFCE×PQR value of 2.15 implies that for the 30 farms in this study, the value of the proteins in the animal products for human consumption (i.e. milk and beef) is, on average, 2.15 times higher than that of the potentially human-edible plant protein inputs. Our concept of combining the quantitative evaluations with the PQR suggests that, even when heFCE is <1, the net contribution of livestock systems to the protein supply for human consumption can be positive. For example, for the dairy farms investigated in this study, even a heFCE of as low as 0.55 would mean that via the transformation through animals, the value of proteins available for human consumption still increases (heFCE×PQR >1). However, when correcting for PQR, it is important that the quantitative measurement (e.g. heFCE) does not consider any qualitative aspects (such as digestible protein, for example), as this would lead to a double correction for quality. The approach of correcting for protein quality differences between output and input via PQR could also be used for other, already established concepts that quantitatively evaluate the net contribution of livestock to the human protein supply, such as the LUR, for example. The LUR is defined as the maximum amount of human-digestible protein derived from food crops on all land used to cultivate feed required to produce 1 kg animal-source food over the amount of human-digestible protein in that 1 kg animal-source food (van Zanten et al., Reference van Zanten, Mollenhorst, Klootwijk, van Middelaar and de Boer2015). Thus, as discussed in van Zanten et al. (Reference van Zanten, Mollenhorst, Klootwijk, van Middelaar and de Boer2015) animal and plant proteins are corrected for their respective digestibility, but not for differences in their amino acid composition. We argue that considering these differences would result in significantly lower LUR, thus land use efficiency of livestock systems would increase. To illustrate the effects of including PQR when calculating LUR, data from the laying hen (van Zanten et al., Reference van Zanten, Mollenhorst, Klootwijk, van Middelaar and de Boer2015) are taken as an example: the weighted average human protein digestibility for the presumed three main feed ingredients (corn, soybean, wheat) and for the animal outputs for laying hens (eggs and chicken meat) is 81.6% and 94.2%, respectively. The weighted average DIAAS for these three plant proteins would be 71.1% compared with a weighted average DIAAS of 115.8% for the animal output (own calculations based on data from van Zanten et al. (Reference van Zanten, Mollenhorst, Klootwijk, van Middelaar and de Boer2015); DIAAS for egg (116.4) and chicken meat (108.2) were calculated using amino acid composition from United States Department of Agriculture (USDA) National Nutrient Database (USDA, 2016)). This results in a ratio between animal and plant protein digestibility of 1.15 and a PQR of 1.63. Thus, correcting for PQR instead of protein digestibility would lead to an increase in the land use efficiency of the laying hens of about 30%. It can be assumed that LUR for other livestock systems would be affected in a similar way when corrected for PQR instead of protein digestibility.
The profound differences between the quality of animal and plant proteins found in this study lead to the question of whether the use of kilogram (digestible) protein as a functional unit in the evaluation of the environmental impacts of protein production is adequate. Functional units are generally used in evaluations such as life cycle assessments to compare systems on the basis of equivalent functions (Klöpffer and Grahl, Reference Klöpffer and Grahl2014). However, dietary proteins differing in quality are not equivalent in terms of their ability to meet nutritional requirements (DIAAS for milk and beef protein, for example, are about 2.8 times higher than for wheat protein (Table 1)). To account for these different functions, the environmental impacts of different protein sources (e.g. de Vries and de Boer, 2010; Nijdam et al., Reference Nijdam, Rood and Westhoek2012) should be corrected for differences in protein quality by dividing the impact per kilogram protein by the protein score for the respective protein source. This would result in a functional unit corrected for protein quality (environmental impacts per kilogram protein with a protein quality score of 100%) and would take into account that proteins differ widely in their ability to meet human nutritional demands. It should be further investigated whether this approach is applicable and how this would affect the calculated environmental impacts of the production of different proteins.
Conclusions
Dietary proteins differ widely in their ability to meet human nutritional requirements. Depending on the method used, results of this study showed that the scores for protein quality of animal products (milk, beef) were between 1.40 and 1.87 times higher than those for potentially human-edible plant protein inputs in dairy production systems. This emphasizes the necessity of including these differences when assessing the role of animal production systems in terms of protein supply or when comparing the environmental impacts of the production of animal v. plant-source proteins. Changes in protein quality can be combined with existing concepts that quantitatively compare human-edible protein outputs and potentially human-edible protein inputs in animal production systems by multiplying the two ratios (output/input) for quantity and quality. The resulting value allows an interpretation of the efficiency of an animal production system in transforming potentially human-edible protein inputs into animal proteins from a perspective which integrates quantitative and qualitative aspects.
Acknowledgements
The authors would like to thank the staff of the Department of Animal Science at UC Davis, California, as well as Gerhard Piringer from the Department of Sustainable Agricultural Systems at BOKU-University of Natural Resources and Life Sciences Vienna for their important ideas on this manuscript. Furthermore, the authors are thankful to Kathleen Knaus for editing assistance and to two anonymous reviewers for their valuable comments on an earlier version of this manuscript.


