


Implications
Detailed knowledge in terms of carcass cut composition is of considerable importance in the meat industry because each carcass cut has a different saleable market value. In this study, weight and growth rate changes of organs and carcass cuts over a large BW span were monitored in pigs fed two dietary protein and amino acid (AA) levels. The results show that allometric growth of organs, lean meat, and fat cuts differ among cuts and organs depending on the diet and sex. In the area of livestock precision farming, these results can contribute to the optimization of production strategies.
Introduction
In recent years, consumers’ demand for leaner pork cuts has constantly increased (Marcoux et al., Reference Marcoux, Pomar, Faucitano and Brodeur2007). To fulfill this demand, EU pig carcass classification is based on the objective measurements of carcass traits using calibrated devices to predict lean meat percentage (Font-i-Furnols et al., Reference Font-i-Furnols, Čandek-Potokar, Daumas, Gispert, Judas and Seynaeve2016). However, the carcass lean meat percentage gives limited information on the proportion of the primal cuts (Knecht et al., Reference Knecht, Duziński and Lisiak2016), which differs markedly in terms of saleable value. To improve the production efficiency for an optimal slaughter weight, the accurate knowledge of carcass cuts development is primordial for many stakeholders in pig production, such as breeding companies, pig producers, abattoirs and retailers (Gispert et al., Reference Gispert, Font-i-Furnols, Gil, Velarde, Diestre, Carrión, Sosnicki and Plastow2007; Knecht and Duziński, Reference Knecht and Duziński2016). Landgraf et al. (Reference Landgraf, Susenbeth, Knap, Looft, Plastow, Kalm and Roehe2007) found significant differences in growth rates between different carcass cuts, suggesting the need for an estimation of their growth patterns.
Due to increased awareness of environmental issues linked to a greater demand for a sustainable livestock production, current meat production systems are subjected to great challenges (Verbeke et al., Reference Verbeke, Pérez-Cueto, Barcellos, Krystallis and Grunert2010). One of the priorities in pig production is the sustainable use of feed sources, especially those rich in CP. In a recent study, Ruiz-Ascacibar et al. (Reference Ruiz-Ascacibar, Stoll, Kreuzer and Bee2019) found marked differences in CP, fat and AA deposition rates in the empty body (EB) (defined as the sum of carcass, blood, bile, organs, intestines, hairs and hooves) of entire males (EM), castrates (CA) and females (FE) fed two levels of dietary CP and essential AA, which suggest differences in the growth rate of body tissues between treatments and sex. Since body chemical composition is linked to different body tissues in the EB (Wiseman et al., Reference Wiseman, Mahan, Peters, Fastinger, Ching and Kim2007), differences in the carcass composition are also expected between sexes and dietary treatments. Numerous studies reported changes in the carcass composition in relation to the diet at a given BW or age (Kerr and Easter, Reference Kerr and Easter1995; Gispert et al., Reference Gispert, Font-i-Furnols, Gil, Velarde, Diestre, Carrión, Sosnicki and Plastow2007; Ruusunen et al., Reference Ruusunen, Partanen, Pösö and Puolanne2007; Mas et al., Reference Mas, Llavall, Coll, Roca, Diaz, Gispert, Oliver and Realini2010). However, there is a lack of information regarding changes in growth patterns of primal cuts in relation to the diet. By fitting allometric equations and calculating their first derivatives, model parameters with straightforward biological interpretation for describing the body composition and growth rate over a defined growth period can be calculated (Landgraf et al., Reference Landgraf, Susenbeth, Knap, Looft, Plastow, Kalm and Roehe2007).
The first objective of the present study was to monitor the changes in weights of carcass cuts and organs from birth to 140 kg BW in EM, CA and FE. The second objective was to assess differences in the growth dynamics of carcass cuts and organs among sexes and dietary CP and essential AA supply.
Material and methods
Animals, experimental diets and design
Detailed experimental design, management protocol and genetic background of the pigs was previously described by Ruiz-Ascacibar et al. (Reference Ruiz-Ascacibar, Stoll, Kreuzer, Boillat, Spring and Bee2017). Briefly, a total of 190 Swiss Large White pigs (66 EM, 58 CA and 66 FE) originating from the Agroscope Posieux sow herd were slaughtered in two series (series one: July 2012 to April 2013; series two: August 2013 to May 2014). At birth, eight FE and eight EM weighing 1.4±0.44 kg (mean ± SD) were slaughtered. Subsequently, at 8.9±0.20 kg and 20.8±1.66 kg, two FE, two CA, two EM and eight FE, eight CA, eight EM were sacrificed, respectively. The remaining 144 pigs were equally allotted per sex to one of the six subsequent slaughter weight categories (40, 60, 80, 100, 120 or 140 kg BW) and assigned to either a control (C) or a low-CP (LP) diet (Supplementary Table S1). The grower (20 to 60 kg BW), finisher I (60 to 100 kg BW) and finisher II diets (100 to 140 kg BW) of C-group were formulated according to the Swiss standard feeding recommendations for pigs weighing 40, 80 and 120 kg BW and analyzed CP of 161, 140, 123 g/kg (as-fed), respectively (Agroscope, 2017). Compared to the respective C diets, the LP diets were formulated to contain 80% digestible CP, lysine, methionine + cystine, threonine and tryptophan. To account for their greater protein deposition potential, the grower, finisher I, and finisher II C and LP diets for the EM had 5% more digestible CP, lysine, methionine + cystine, threonine and tryptophan than those for CA and FE (Agroscope, 2017). All diets were designed to be isocaloric (13.2 MJ digestible Energy/kg). When the individual pig reached the initial BW defined for the grower, finisher I and finisher II period (BW greater than 19, 59 and 98 kg, respectively), it was allocated to the following diet: starter to grower, grower to finisher I, finisher I to finisher II. The analyzed composition of the experimental diets has been published by Ruiz-Ascacibar et al. (Reference Ruiz-Ascacibar, Stoll, Kreuzer, Boillat, Spring and Bee2017) and can be found in the Supplementary Table S1.
Slaughter procedure
The serial slaughter procedure was used to study the growth dynamics of the different organs and carcass cuts. A description of the slaughter methods is given by Ruiz-Ascacibar et al. (Reference Ruiz-Ascacibar, Stoll, Kreuzer, Boillat, Spring and Bee2017). Briefly, when the experimental pigs reached their target BW for slaughter, they were fasted for approximately 16 h, stunned with CO2, and exsanguinated. The semitendinosus muscle from the left carcass side was removed and weighed within 30 min after exsanguination.
Quantitative organ and carcass measurements
Carcasses were eviscerated, the head was removed by cutting at the occipital–atlas joint, and then carcasses were split into two halves. The stomach, intestine and hindgut (intestinal tract) were emptied and rinsed with clean water to remove remaining digesta. Before weighing, each of the aforementioned gut components was squeezed by hand to remove excess water. Kidneys, liver and omental fat were also weighted in each animal.
The eviscerated carcasses were chilled overnight at 2°C and dissected 1-day postmortem as previously described (Bee et al., Reference Bee, Gebert and Messikommer2002). Briefly, the cold left carcass side of each animal was fabricated into ham, loin, shoulder and belly primal cuts. External fat of the loin, ham and shoulder was completely removed. Carcass length (cm) was measured from the base of the tail to the base of the ear.
Calculations and statistical analysis
The empty gastrointestinal tract (GIT) was considered the sum of the empty stomach, gut and hindgut. The primal cuts were considered the sum of the defatted loin, ham and shoulder. Accordingly, carcass fat was considered the sum of back, ham and shoulder fat. The weight of defatted total lean cuts was the sum of the aforementioned defatted primal cuts expressed as a weight percentage of the left carcass side excluding head, tail, diaphragm and omental fat. Significant differences in the empty BW (EBW) between diets and sex within each slaughter weight category were observed. Therefore, a pre-treatment of the data was necessary to normalize the original individual EB organ weight and carcass to standardized EBW categories (Supplementary Material S1). Ranks were then assigned to the transformed data within each BW category from 40 to 140 kg. The ranked data were analyzed using the ANOVA procedure of SYSTAT 13 (SYSTAT Software Inc.) considering the experimental groups (C-EM, C-FE, C-CA, LP-EM, LP-FE, LP-CA), series, and the two-way interactions as fixed effects. To assess whether any of the diet × sex combinations could be plotted in the same regression equation, the following predefined orthogonal contrasts were tested:
∙ FE v. CA, fed either C or LP diet
o C-FE v. C-CA
o LP-FE v. LP-CA
∙ EM pigs v. FE/CA, fed either C or LP diet
o C-EM v. C-FE/CA
o LP-EM v. LP-FE/CA
∙ C diet v. LP diet, regardless of sex
o C-FE/CA per EM v. LP-FE/CA per EM
Based on the outcome of the orthogonal contrast, the untransformed data of the organ and carcass component weights were grouped and fitted, using the non-linear procedure of SYSTAT 13, to the following allometric regression: Y=a×EBW b , where Y is the predicted organ or carcass component weight or carcass length, b the scaling exponent or allometric coefficient and a the constant. The weight gain or growth in carcass length, expressed in g/kg EBW gain or cm/kg EBW gain, were calculated as the first derivative of the aforementioned allometric function for each EBW (Y’= a×b×EBW(b−1)). The coefficient of determination (R 2) was used to check the goodness of fit. In addition, the residual standard error was used to evaluate the variability in the dependent variable unexplained by the model. The results for the carcass components are presented for the left carcass side.
Results
Growth performance
Detailed results on growth performance were presented previously by Ruiz-Ascacibar et al. (Reference Ruiz-Ascacibar, Stoll, Kreuzer, Boillat, Spring and Bee2017). Briefly, despite similar feed intake, daily gain and feed efficiency were impaired (P<0.01) from 20 to 100 kg BW in the LP- compared with the C-pigs. As a consequence, LP-pigs needed more (P<0.05) time than C-pigs to achieve the same BW. In the same growth period, CA had the greatest feed intake but, together with FE, displayed the lowest (P<0.01) feed efficiency. Thus, among the three sexes, EM were the most (P<0.05) energy efficient in the grower and finisher I periods.
Average weights of organs, gastrointestinal tract, semitendinosus muscle and carcass cuts
Average weights of kidneys, liver, GIT, lean cuts, belly, omental fat and subcutaneous fat and average length of the carcasses across the BW categories from 40 to 140 kg are presented for the treatments in Table 1. Average length and weight of each of the aforementioned traits for the pigs at birth, 10 and 20 kg BW are reported in Supplementary Tables S2 to S4. Overall, kidneys were heavier (P<0.05) in the C- than LP-group and were heavier (P<0.05) in EM than FE and CA pigs. Furthermore, in the LP- but not the C-treatment, kidneys were heavier (P<0.05) in CA than FE. Livers of EM were heavier (P<0.05) than livers of CA and FE when fed the LP-diets. The weight of the GIT was greater (P<0.05) in EM than FE and CA, regardless of dietary treatment. On average, carcasses were shorter (P<0.05) in C- than LP- and in CA- than FE-pigs. In the LP-, but not the C-group, carcasses of CA and FE were shorter (P<0.05) than those of EM. Total primal cuts were 2.4% heavier in C- than LP-pigs (20.01 v. 19.54 kg; P<0.05). When comparing CA and FE, primal cuts were lighter (P<0.05) in C-CA than C-FE but not in the LP-group. The loins, hams and shoulders were 1.6%, 2.8% and 3.2% heavier, respectively, in C- than LP-pigs. Regardless of the diet, hams were lighter (P<0.05) in CA- than FE-pigs. Belly and omental fat weight were lower (P<0.05) in EM- than FE- and CA-pigs. Overall belly and omental fat were lighter (P<0.05) in the C- than LP-group and heavier (P<0.05) in CA than FE. The amount of back, ham, shoulder and total subcutaneous fat differed among dietary treatments and sex, resulting in six distinct groups, except for ham fat. Overall, the total amount of subcutaneous, back, ham and shoulder fat was lower (P<0.05) in C- than LP-pigs. Interestingly, C-CA had a 3.4% greater (P<0.05) amount of subcutaneous fat than C-FE, whereas in the LP-group, this difference was more marked and amounted to 16.5% (P<0.05). Within dietary treatments, the same difference in the pattern of deposited back and shoulder fat was observed between CA- and FE-pigs. The amount of deposited ham fat was greater (P<0.05) in LP-CA than LP-FE, but not in C-CA and C-FE, and was lower (P<0.05) in EM compared to CA and FE regardless of dietary treatment. Lower (P<0.05) semitendinosus muscle weights were observed in C-CA compared to C-FE pigs, whereas no sex effect was observed in the LP-groups.
Table 1 Average and standard deviation [in brackets] of the transformed data of the weight of organs, gastrointestinal tract, carcass cuts and semitendinosus muscle from female (FE), castrated (CA) and entire male (EM) pigs fed either a control (C) or low-CP (LP) grower (20 to 60 kg), finisher I (60 to 100 kg) and finisher II (100 to 140 kg) dietFootnote 1, Footnote 2

The values are estimated across the BW categories of 40, 60, 80, 100, 120 and 140 kg.
1 The way to obtain the transformed data is detailed in the Supplementary Material S1.
2 C=formulated to meet nutrient requirements for grower-finisher pigs in the grower, finisher I and finisher II periods according to the Swiss feeding recommendations for pigs; LP=formulated to contain, expressed as percentage of C diets, 80% of dietary CP, lysine, methionine + cystine, threonine and tryptophan.
3 Significant (P<0.05) orthogonal contrasts evaluated were a=C-FE v. C-CA; b=LP-FE v. LP-CA; c=C-EM v. C-FE/CA; d=LP-EM v. LP-FE/CA; e=C-FE/CA/EM v. LP-FE/CA/EM P<0.05.
4 Sum of cold defatted loin, ham and shoulder weights obtained from the left carcass side.
5 Sum of cold defatted loin, ham and shoulder weights expressed as weight percentage of the left carcass side.
6 Sum of subcutaneous cold fat and skin without hairs from the shoulder, back and ham from the left carcass.
Predicted growth rates of the organs, gastrointestinal tract, semitendinosus muscle, and carcass cuts
The allometric regression coefficients determined for the weights of kidneys, liver, intestinal tract, semitendinosus muscle, carcass length and the different carcass components are presented in Table 2. The R 2 of the allometric regression ranged from 0.895 (omental fat of LP-EM) to 0.997 (defatted carcass lean cuts of LP-EM and LP-FE).
Table 2 Allometric growth coefficients for weight of organs, gastrointestinal tract, carcass cuts and semitendinosus muscle from female (FE), castrated (CA) and entire male (EM) pigs fed either a control (C)or low-CP (LP) grower (20 to 60 kg), finisher I (60 to 100 kg) and finisher II (100 to 140 kg) dietFootnote 1
1 The allometric regression used was as follows: Y=a×EBW b , where Y is the predicted component weight (g or cm); EBW the empty BW (kg); b the allometric coefficient; a the constant; R 2 is based on the original and untransformed data.
2 Residual standard error (RSE)=[(SSE)/(n−2)]1/2; where SSE is the error sum of squares; n−2 the degrees of freedom.
3 Coefficient of determination.
4 Sum of defatted loin, ham and shoulder weights obtained from the left carcass side.
5 Sum of subcutaneous fat from the shoulder, back and ham from the left carcass side.
Growth of organs and gastrointestinal tract
The allometric coefficients b for the kidneys, liver and GIT were, with ⩽ 0.805 markedly below 1, implying a decreasing growth rate with increasing EBW (Table 2). Entire males fed the LP-diets had lighter (P<0.05) kidneys, with slower (P<0.05) growth rates than their C-counterparts. Kidneys of LP-CA and -FE were lighter (P<0.05) and grew at a slower (P<0.05) rate than those of C-CA and C-FE throughout the growth period (Figure 1a). Entire males of the LP-group had the greatest, while LP-CA and -FE pigs had the lowest, allometric coefficients b and liver growth rates (Figure 1b) with intermediate values for C-EM, -CA and -FE. Regardless of dietary treatment, EM had heavier GIT above 36 kg EBW and a greater allometric coefficient than CA and FE-pigs. This led to the faster (P<0.05) growth rates of GIT in EM when compared to CA and FE.
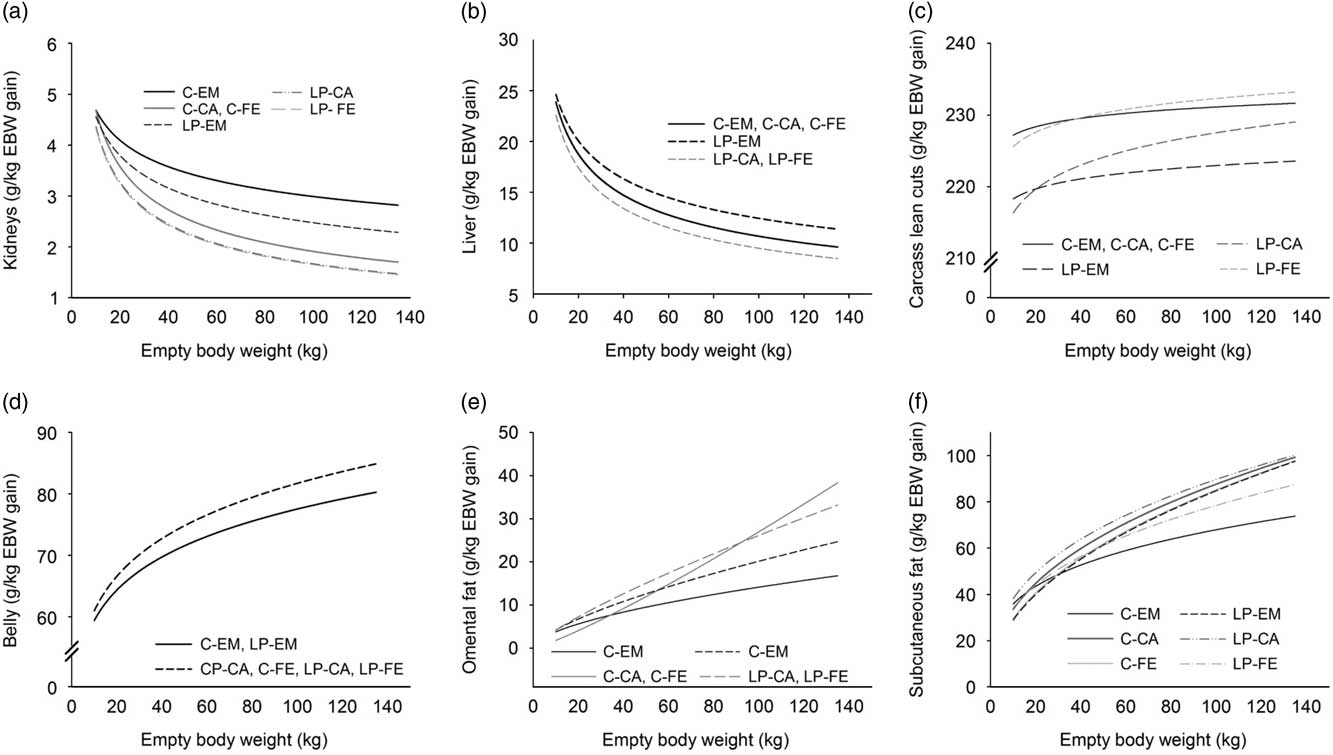
Figure 1 Dynamics of changes in relative growth rates (g/kg empty BW gain) of the kidneys (a), liver (b), total weight of carcass lean cuts (c), belly (d), omental fat (e) and total subcutaneous fat (f) with increasing empty BW. To differentiate between treatment groups, the following orthogonal contrasts were used: FE v. CA fed either diet C (C-FE v. C-CA) or LP (LP-FE v. LP-CA); EM v. FE/CA fed either diet C (C-EM v. C-FE/CA) or LP (LP-EM v. LP-FE/CA); diet C v. diet LP regardless of sex (C-FE/CA/EM v. LP-FE/CA/EM). Data of pigs from birth to 140 kg BW were used for calculating the allometric equations. EM=entire males; CA=castrated pigs; FE=female pigs. Control diet (C) grower (20 to 60 kg), finisher I (60 to 100 kg) and finisher II (100 to 140 kg) diets were formulated to meet nutrient requirement according to the standard Swiss feeding recommendations for grower finisher pigs in the respective growth periods; low-CP diets (LP) were formulated to contain, expressed as a percentage of the control grower, finisher I and finisher II diets, 80% of dietary CP, lysine, methionine + cystine, threonine and tryptophan.
Growth of primal cuts
The lower a-value of the allometric regression together with the greater b-coefficient (Table 2) resulted in greater (P<0.05) amounts of total lean cuts and greater (P<0.05) deposition rate (above 38 kg EBW; Figure 1c) in LP-FE compared to C-pigs. Above 55 and 21 kg EBW, the amount and deposition rate of total lean cuts was greater (P<0.05) in LP-CA than LP-EM. In addition, the greater allometric coefficient b determined for LP-EM and LP-CA compared to C-pigs explains their slightly faster (P<0.05) increase in total lean cut growth rate with increasing EBW. Nevertheless, as the a-values were lower in LP-EM and LP-CA than C-EM and C-CA, the total amount of deposited total lean cuts was lower (P<0.05) throughout the growth period. The loin was the sole lean primal cut where b-coefficients were > 1 (Table 2). Loin and shoulder weights and growth rates were, regardless of sex, greater (P<0.05) in C- than LP-pigs. However, with increasing EBW, differences in growth rates decreased between the experimental groups. Growth rates of ham and shoulder decreased with increasing EBW in all groups (b-coefficient <1). Above 39 kg EBW, increase in ham weight was greater (P<0.05) in LP-FE than C-FE, whereas greater (P<0.05) growth rates were observed in C-CA and C-EM when compared to their LP-counterparts. Belly weight and growth rate (Figure 1d) were greater (P<0.05) in CA- and FE- than EM-pigs, regardless of the dietary treatment.
Growth of fat tissues
Compared to all organs and carcass components monitored in the present study, omental fat displayed the greatest allometric b-coefficients, ranging from 1.576 (C-EM) to 2.174 (C-CA and FE) and therefore the greatest increase in growth rate (Table 2, Figure 1e). In C-CA and -FE pigs, a sharp increase in omental fat weight occurred in the finishers I and II periods (b-coefficient=2.174). This was caused by the steepest increase in growth rate when compared to all other groups (Figure 1e). Due to the lower b-coefficient in LP-CA and LP-FE pigs compared to their C-counterparts, differences in omental fat weight between both groups decreased with increasing EBW. Nevertheless, LP-CA and LP-FE deposited the greatest (P<0.05) amount of omental fat of all experimental groups.
Backfat displayed the greatest allometric b-coefficients, followed by ham fat and shoulder fat. The greatest (P<0.05) amount of back, ham, shoulder and total subcutaneous fats was determined in LP-CA pigs. Except for backfat above 87 kg EBW, this was true also for growth rates of these tissues. When compared with C-EM, LP-EM pigs had greater (P<0.05) back, ham and subcutaneous fat contents above 74, 74 and 65 kg EBW, respectively. However, growth rates of back, ham and total subcutaneous fats were already greater above 38, 35 and 32 kg EBW, respectively, in LP-EM than C-EM. In C-FE, the amount of back, ham, shoulder and total subcutaneous fat surpassed that of LP-FE above 95, 108, 74 and 91 kg EBW, respectively. However, EM growth rates of back, ham, shoulder and total subcutaneous fat were already greater above 50, 45, 32 and 44 kg EBW in C-FE than LP-FE.
Growth of muscle
Although C-FE had the heaviest semitendinosus muscle, growth rate decreased with increasing EBW. This is in contrast with muscle growth of the other experimental groups which displayed an allometric b-coefficient above 1 (Table 2). Thus, above 70 kg EBW semitendinosus muscle growth rate of C-EM, LP-EM, LP-CA and LP-FE surpassed that of C-FE.
Discussion
Some studies have reported growth dynamics of primal carcass cuts (Gu et al., Reference Gu, Schinckel and Martin1992; Siewerdt et al., Reference Siewerdt, Farias, Osório and Jacondino1994; Landgraf et al., Reference Landgraf, Susenbeth, Knap, Looft, Plastow, Kalm and Roehe2007; Nieto et al., Reference Nieto, Lara, Barea, Garcia-Valverde, Conde-Aguilera and Aguilera2013). However, comparisons between the growth dynamics of these traits across studies must be done carefully, because cutting standards vary, not only from country to country (Landgraf et al., Reference Landgraf, Susenbeth, Knap, Looft, Plastow, Kalm and Roehe2007), but also between butchers (Nissen et al., Reference Nissen, Busk, Oksama, Seynaeve, Gispert, Walstra, Hansson and Olsen2006).
Growth dynamics of organs and gastrointestinal tract
Reported weights for kidneys and liver at 101 kg BW are consistent with data obtained earlier from the same breed (Pardo et al., Reference Pardo, Kreuzer and Bee2013). The similar feed intake in the C- and LP-groups combined with the difference in dietary CP content between C- and LP-diets resulted in an overall lower amount of ingested protein in LP-pigs (Ruiz-Ascacibar et al., Reference Ruiz-Ascacibar, Stoll, Kreuzer, Boillat, Spring and Bee2017). Since the kidneys and liver are major sites of AA metabolism and nitrogen clearance (Chen et al., Reference Chen, Lewis, Miller and Yen1999), their weight was expected to be greater in C-pigs due to the greater amounts of nitrogenous compounds to process. In accordance, kidneys were smaller in LP-pigs and the weight gain declined faster than in their C-counterparts. Furthermore, Ruiz-Ascacibar et al. (Reference Ruiz-Ascacibar, Stoll, Kreuzer, Boillat, Spring and Bee2017) reported that LP-pigs displayed a numerically greater N-efficiency (41.5 v. 45.9) than C-pigs in the finisher period, supporting the idea of lower requirements for nitrogen clearance in LP than C-pigs. Schoknecht and Pond (Reference Schoknecht and Pond1993) observed that the reason for dramatic weight increases in liver and kidneys of rats, after receiving twice the recommended supply of CP, was hypertrophy, without concomitant hyperplasia. In line with the study of Moughan et al. (Reference Moughan, Smith and Stevens1990), kidney weight differed among sexes, being heavier in EM than FE and CA. In contrast to Chen et al. (Reference Chen, Lewis, Miller and Yen1999) and Critser et al. (Reference Critser, Miller and Lewis1995), who used five dietary CP levels ranging from 13% to 25% and 13% to 18.4% in their studies, dietary CP and essential AA levels in the current study did not influence liver weight. It is possible that diets in the present experiment were not sufficiently different to affect hepatic metabolism resulting in liver hypertrophy. The greater GIT weight in EM compared to CA and FE could be partly related to a greater absorptive capacity of the intestine, which would fit with the greater feed efficiency found in EM (Ruiz-Ascacibar et al., Reference Ruiz-Ascacibar, Stoll, Kreuzer, Boillat, Spring and Bee2017).
Growth dynamics of carcass lean cuts
Percentage lean cuts obtained for C-CA (60%) and C-FE (62%) pigs at 100 kg BW in the present experiment were greater than in the study of Bee et al. (Reference Bee, Guex and Herzog2004) carried out with Swiss Large White pigs fed grower–finisher diets containing 18% and 13.5% CP and slaughtered at 105 kg BW (CA: 55.3%; FE: 57.3%). Part of this difference can be explained by differences in the diets and/or genetic improvements in the last decades. In this regard, it is noteworthy mentioning that the greater percentage of lean cuts in the present study was a result of the greater relative weight of defatted loin and shoulder but not ham, because the relative ham weight was similar to values reported by Bee et al. (Reference Bee, Guex and Herzog2004). The restriction in dietary CP and essential AA supply applied in the present study did not have the same impact on the weight of the individual primal cuts. Furthermore, EM, CA and FE showed different responses to the dietary treatment. Loin growth rate increased with increasing EBW in both C and LP diets. However, at lower EBW, the growth rate was slower in the LP- than C-group, but this difference decreased with increasing EBW. The impact of the LP diet on the loin weight, which amounted to 175 g or 1% lower loin weight at 110 kg EBW, is of importance because loin is among the most popular carcass cuts in Europe (Verbeke et al., Reference Verbeke, Pérez-Cueto, Barcellos, Krystallis and Grunert2010). Thus, the economical relevance of the loin for the total carcass value is the greatest among all the three primal cuts (Marcoux et al., Reference Marcoux, Pomar, Faucitano and Brodeur2007). The difference between diets for the shoulder weight was 3% at 110 kg EBW. In contrast to shoulder and loin, dietary CP restriction had a different impact on the ham weight of the different sexes. The fastest reduction in defatted ham growth was observed in C-FE, which led to similar ham weights in C- and LP-groups at 110 kg EBW. However, C-EM and C-CA pigs had 5% and 3% heavier hams than their LP-counterparts, because the ham growth rate was greater in C-EM and C-CA pigs during all the analyzed growth periods.
Growth dynamics of fat cuts
The increase of BW was mainly linked to an increase in fat tissues (b-coefficient: ⩾1.144) rather than muscle (b-coefficient: ⩽1.083), as observed by Siewerdt et al. (Reference Siewerdt, Farias, Osório and Jacondino1994). Excessive carcass fat deposition is undesired because it lowers production efficiency, reduces the value of the carcass and increases labor for fat trimming at the abattoir (Lambe et al., Reference Lambe, Wood, Mclean, Walling, Whitney, Jagger, Fullarton, Bayntun and Bunger2013). Different responses to the dietary CP restriction were observed among sexes in terms of subcutaneous fat deposition rates. While LP-EM and LP-CA pigs accumulated fat at greater rates than their counterparts of the C-groups, LP-FE displayed lower subcutaneous fat deposition rates than C-FE in the finisher period. As a result, when the presented equations where used to predict subcutaneous fat content for a LP-EM and LP-CA pig at 110 kg EBW, the amount was 11% and 5% greater compared to C-EM and C-CA (639 and 378 g, respectively). By contrast, the amount of subcutaneous fat was 2% (137 g) lower in LP-FE than C-FE. Tous et al. (Reference Tous, Lizardo, Vilà, Gispert, Font-i-Furnols and Esteve-Garcia2014) found that pig’s backfat thickness increased with dietary CP restriction but not with dietary lysine restriction. Thus, the increase in the amount of subcutaneous fat in LP-EM and LP-CA could be linked to the reduction of CP rather to the essential AA restriction.
Within sex growth dynamics of backfat, ham and shoulder fat differed. Regardless of sex, the fastest deposition rates were observed in backfat. This is in line with findings of Landgraf et al. (Reference Landgraf, Susenbeth, Knap, Looft, Plastow, Kalm and Roehe2007) obtained with Pietrain × (Large White × Landarce × Leicoma) CA and FE fed diets optimized for maximum protein deposition. In EM, ham fat deposition rate was lower than shoulder ham fat deposition rate. By contrast, in FE and CA, ham fat deposition rates surpassed shoulder fat deposition rates in the grower and finisher period, respectively. The present findings are partly in contrast to those of Landgraf et al. (Reference Landgraf, Susenbeth, Knap, Looft, Plastow, Kalm and Roehe2007) who reported that shoulder fat deposition in FE and CA was almost constant (b=1.05) and was the lowest among the three fat cuts.
Growth dynamics of total primal cuts, especially ham and loin, and of subcutaneous fat in LP-CA and LP-FE compared to the C-CA and C-FE is in line with the conclusions drawn from the determination of the dynamic of EB protein and fat content change reported by Ruiz-Ascacibar et al. (Reference Ruiz-Ascacibar, Stoll, Kreuzer and Bee2019): a reduction of the dietary CP and essential AA supply might be positive if applied to the finisher period. Present results also support that the LP-diet did not allow LP-EM to express their full potential for lean growth.
Conclusion
Considering present and previous results reported for the same pigs regarding chemical deposition and feed efficiency and considering the potential cost reduction of the feed when CP restriction is applied, a compromise in terms of carcass composition might be worthwhile. A less restrictive diet in terms of CP and AA for the grower phase might be a solution to eliminate any deleterious effect on carcass cut growth dynamics, especially in EM and FE. Besides, a reduction of CP supply only during the finisher phase is expected to lead to a better yield of lean primal cuts, as shown by its growth rate dynamics.
Acknowledgements
The authors acknowledge Guy Maïkoff and his team for taking care of the animals and his assistance during the slaughters; Dr Sébastien Dubois and his team for the chemical analysis of the diets; and Dr Paolo Silacci and his team for the help during sample collection.
Declaration of interest
The authors declare no conflicts of interest.
Ethics statement
The experimental procedure was approved by the Office for Food Safety and Veterinary Affairs (2012-14-FR 22119 and 2013-24-FR 24064) and all procedures were conducted in accordance with the Ordinance on Animal Protection and the Ordinance on Animal Experimentation.
Software and data repository resources
None of the data were deposited in an official repository.
Supplementary material
To view supplementary material for this article, please visit https://doi.org/10.1017/S1751731119000132


 Open access