


Ageing is associated with changes in body composition and involuntary weight loss. Specifically, a large component of involuntary weight loss in older adults is fat-free mass (FFM) and is highly predictive of increased morbidity and mortality(Reference Liu, Bopp and Roberson1–Reference Szulc, Munoz and Marchand3). Losses in lean muscle occur at a rate of approximately 1–2 % per year following the age of 50 years(Reference Thomas4, Reference Hughes, Frontera and Roubenoff5). These losses are also correlated with a loss of skeletal muscle strength(Reference Thomas4, Reference Goodpaster, Park and Harris6). Sarcopenia, characterised by progressive and generalised loss of skeletal muscle mass (SMM) and strength associated with ageing, contributes to functional and physical disability, including poor quality of life(Reference Thomas4, Reference Goodpaster, Park and Harris6, Reference Cruz-Jentoft, Baeyens and Bauer7). The assessment of body composition, in particular SMM, is therefore an important component of assessing health status in an ageing population.
Older adults with recent hip fractures are an important clinical group at increased risk of muscular disuse, declines in mobility and progressive disability(Reference Rubenstein and Josephson8). This population of older adults often presents to hospitals with multiple co-morbidities and impairments which may impede functional recovery(Reference Fiatarone Singh, Singh and Hansen9). A number of predictors of poor functional outcomes have previously been reported; however, one important predictor that is often overlooked is insufficient dietary intake, in particular suboptimal protein status(Reference Miller, Bannerman and Daniels10, Reference Milne, Avenell and Potter11). Malnutrition is often present upon hospital admission among hip fracture patients (reported up to 63 %)(Reference Miller, Bannerman and Daniels10–Reference Murphy, Brooks and New12), which often worsens throughout the admission(Reference Miller, Crotty and Whitehead13). The subsequent changes in body composition that occur, however, are not well defined.
The assessment of body composition plays an important role in the nutritional management of older adults after surgical treatment for hip fracture. The potential for losses in lean mass within this population post-surgery raises the need for non-invasive, easy alternatives for the assessment of body composition. Dual-energy X-ray absorptiometry (DXA) is a non-invasive, safe, accurate and reliable method of body composition assessment in research and clinical practice(Reference Williams, Wells and Wilson14–Reference Plank16). Whilst first developed for the assessment of bone mineral density, DXA also provides an assessment of total and regional body fat and FFM(Reference Williams, Wells and Wilson14, Reference Mazess, Barden and Bisek17). For this reason, DXA is commonly used as a reference technique for the assessment of body composition. However, its high cost, lack of access, and the difficulty of positioning post-surgical patients in the correct position for measurement secondary to pain and immobility makes this method not always practical for older adults recovering from orthopaedic surgery(Reference Plank16). Therefore the need for portable methods of body composition assessment is of clinical importance.
Despite a variety of field methods available to assess body composition in older adults, the majority of findings have been inconsistent and few methods have been validated. A recent cross-sectional analysis by Vilaça et al. (Reference Vilaça, Paula and Ferriolli18) showed that bioelectrical impedance analysis, when compared with DXA, tended to overestimate FFM in undernourished older adults. In contrast, Tengvall et al. (Reference Tengvall, Ellegård and Malmros19) showed that in a healthy population of community-dwelling older adults, FFM derived from bioelectrical impedance spectroscopy (BIS) was in agreement with FFM from DXA. Results, however, taken from studies using healthy populations cannot necessarily be generalised to frail older adults or those with chronic disease. Validation studies among older adults recovering from hip fracture are scant. A recent small (n 23) Australian study investigated the validity of sex-specific predictive equations for lean body weight against FFM derived from DXA in elderly women post-surgery for hip fracture(Reference Mitchell, Hilmer and Kirkpatrick20). These results highlighted that the lean body weight predictive equation used in this study underestimated FFM by 0·59 (95 % limits of agreement (LOA) − 8·11, 9·29) kg when compared with DXA, with marked individual variability and poor precision.
The objective of the present measurement study was to assess the agreement of two field methods, BIS and corrected arm muscle area (CAMA), against a reference technique, DXA, for the assessment of FFM and SMM in older males and females after surgical fixation for hip fracture. Furthermore, the present study also explored agreement between two previously established regression equations from BIS to predict SMM against SMM derived from DXA.
Methods
Patients and recruitment
A cross-sectional measurement study was performed as part of the Individual Nutrition Therapy and Exercise Regime: A Controlled Trial of Injured, Vulnerable Elderly (INTERACTIVE) trial (Australian Clinical Trials Registry no. 12607000017426), a prospective randomised controlled trial of a nutrition and exercise programme in community-dwelling older adults post-surgical fixation for hip fracture(Reference Thomas, Humphreys and Miller21). Body composition data were collected at baseline ( < 14 d post-surgery), and at 6 months (6M) and 12 months (12M) following surgery. Participants were recruited from two acute care settings including Flinders Medical Centre and Flinders Private Hospital, both in Adelaide, South Australia, Australia(Reference Thomas, Humphreys and Miller21).
Participants aged ≥ 65 years were eligible for the study if they were admitted with a diagnosis of hip fracture confirmed by radiology report, had a Mini Mental State Examination score of ≥ 18, had a BMI between 18·5 kg/m2 and 35 kg/m2, and were community-dwelling within existing local service boundaries. Exclusion criteria included a pathological fracture or malignancy, those residing in residential care, non-English speaking, limited to stand transfers only post-surgery, or non-ambulatory pre-fracture due to potential allocation to an exercise programme requiring independent mobility, unable to provide informed consent or not deemed to be medically stable within 14 d post-surgery (for example, unstable blood glucose levels, elevated blood pressure and unstable angina). The present study was conducted according to the guidelines laid down in the Declaration of Helsinki and all procedures involving human subjects were approved by the Flinders Clinical Research Ethics Committee (protocol 110/067). Written informed consent was obtained from all subjects.
Measurements and procedures
Body composition and clinical measurements were collected at three different time points: baseline (within 14 d post-surgery), and at 6 months (6M) and 12 months (12M) post-surgery. A detailed description of all outcome measures has previously been published(Reference Thomas, Humphreys and Miller21). For the purposes of the present study, the primary measurements of interest were body composition parameters including FFM and SMM derived from BIS and CAMA, respectively, as well as FFM and SMM measures from DXA, the reference technique. Subgroup analyses were also performed separating sex and BMI (BMI ≥ 22 kg/m2; BMI < 22 kg/m2). Analyses for BMI were separated using < 22 kg/m2 (underweight or ‘at risk’ of underweight and malnutrition) v. ≥ 22 kg/m2 (desirable)(Reference Sergi, Perissinotto and Pisent22, Reference Lipschitz23).
Body composition measurements
Weight and height
Body weight was recorded to the nearest 0·1 kg using calibrated digital scales (BF-681 Scale and Body Fat Monitor; Tanita) with participants wearing light clothing and without footwear. Participants were assisted onto digital scales with assistance from walking support aids and clinical nurses and/or physiotherapists where required. Participants that were unable to mobilise were weighed using a calibrated weigh chair.
Height was estimated using validated age- and sex-specific equations(Reference Chumlea24, Reference Pini, Tonon and Cavallini25). Knee height is commonly used among older adults as a result of degenerative changes that occur in stature with age, making it difficult to obtain an accurate standing height, consequently making the calculation of BMI prone to error(Reference Pini, Tonon and Cavallini25). Knee height was measured on the non-injured leg with participants wearing no footwear. The measurement took place either with the participant in a supine position or in a seated position, with the ankle, knee and tibia-tarsus joints flexed at 90° using a calibrated knee height calliper (Ross Laboratories) with the fixed portion of the calliper placed along the lateral tibial condyle and the lateral malleolus. All measures were recorded to the nearest 0·1 cm. BMI was calculated as weight (kg) divided by the square of height (m2).
Dual-energy X-ray absorptiometry
Whole-body and regional body composition was estimated using DXA (Lunar Prodigy; GE Healthcare) with the automated reporting GE EnCORE bone densitometry software (version 10.51.006). The system software provided estimates of FFM, lean soft tissue, fat mass (FM) and bone mineral density for total body and body segments including both arms, both legs and the trunk. Appendicular lean soft tissue (ALST) mass, calculated as the sum of lean soft tissue mass in both arms and legs, was used to determine SMM using previously established equations(Reference Kim, Wang and Heymsfield26).
The equation for estimating SMM from DXA is:
 $$\begin{eqnarray} SMM\, = (1\cdot 13 \times ALST)\, - \,(0\cdot 02\times age) + (0\cdot 61\times sex) + 0\cdot 97. \end{eqnarray}$$
Measurements of FFM and FM using DXA have previously been validated in an elderly population with an explained variance >96 %(Reference Salamone, Fuerst and Visser27, Reference Visser, Fuerst and Lang28). The precision of measures using the Lunar Prodigy system by repeated measurements across four successive days has previously been reported with CV (%) of 1 % for FFM and 2 % for FM(Reference Kiebzak, Leamy and Pierson29). In this scanning technique an X-ray generator emits alternating pulsed radiation of two photon energy peaks, 38 KeV and 70 KeV in a fan-beam mode. Quality-assurance and quality-control measures were performed three times per week throughout the duration of the trial and before all participant scans using a body composition phantom block containing a known bone mineral density and bone mineral content value. A tolerance for the densitometer was established from the mean of the phantom BMD by monitoring the densitometer's performance, using ± 1·5 % as the acceptable tolerable limit. All DXA scans were performed by a licensed technician. Before all DXA scans, all participants underwent a DXA screening checklist to ensure safety and validity of the technique. Participants were excluded from the DXA scan if they reported a history of nuclear scans or other X-ray examinations in the previous 0–14 d or had a recorded body weight ≥ 130 kg. Before the scan, all participants were asked to remove all metal accessories, were asked to identify any medications taken in the previous 24 h (including Ca or Fe supplements) and were asked to identify any history of previous fracture and/or metal implants. The software recognises metal in the body, such as artificial joints, allowing exclusion from calculations before analysis. Participants were dressed in hospital gowns and positioned in a supine position on the tabletop with their feet in a neutral position with hands flat by their sides.
Corrected arm muscle area
CAMA is a portable anthropometric technique that may be used to identify malnutrition in an elderly population, and is a useful indicator of nutritional status in this population(Reference Heymsfield, McManus and Stevens30, Reference Miller, Crotty and Giles31). CAMA is calculated using equations that take into account mid-upper arm circumference (MUAC) and triceps skinfold thickness (TSF)(Reference Heymsfield, McManus and Stevens30–Reference Heymsfield, McManus and Smith32). MUAC was measured at the mid-point between acromiale and radiale to the nearest 0·1 cm using a flexible steel measuring tape (KDS Corp.) with the tape positioned perpendicular to the long axis of the humerus. TSF was measured at the marked posterior mid-acromiale-radiale to the nearest 0·2 mm using a calibrated Harpenden skinfold calliper (Baty International) with the skinfold taken vertically and parallel to the marked posterior mid-acromiale-radiale line. TSF measurements were taken at the same level as MUAC on the posterior surface of the right arm, over the long head of the triceps. All anthropometric measures were performed by trained dietitians and/or physiotherapists, with each measure performed on three separate occasions with the mean of the three measures used for analysis. Unless affected by injury, all anthropometric measures were taken on the right-hand side of the body. CAMA was derived from MUAC and TSF and converted to SMM (kg) using previously established equations outlined below, which are used to correct for non-skeletal muscle tissue and the asymmetric shape of the mid-upper-arm muscle compartment(Reference Heymsfield, McManus and Stevens30, Reference Heymsfield, McManus and Smith32).
Equation(s) for estimating SMM from CAMA are:
 $$\begin{eqnarray} (a)\,Men:\,CAMA\,(cm^{2}) = \,(MUAC\,(cm)\, - \pi \times TSF (cm))^{2}/4 \pi \, - \,10; \end{eqnarray}$$
 $$\begin{eqnarray} (b)\,Women:\,CAMA\,(cm^{2}) = (MUAC\,(cm)\, - \pi \times TSF\,(cm))^{2}/4 \pi - 6\cdot 5. \end{eqnarray}$$
 $$\begin{eqnarray} Estimation\,of\,SMM\,(kg) = ht\,(cm^{2})\,(0\cdot 0264 + 0\cdot 0029\,(CAMA)). \end{eqnarray}$$
Bioelectrical impedance spectroscopy
The assessment of FFM by BIS was carried out using the ImpediMed Imp SFB7. The ImpediMed measures current, voltage and phase angle and calculates impedance, resistance and reactance, which are used to assess components of body composition including FFM, FM, total body water (TBW), intracellular water (ICW) and extracellular water (ECW). Measurements were taken with participants rested in a supine position. Electrodes were placed on the dorsal surface of the right side of the body, specifically, between the protruding bones on the wrist and ankle, according to the manufacturer's instructions. All measures were taken with participants in a fasted state. TBW, ICW and ECW were measured using the BIS proprietary software and FFM was determined using the formula FFM = TBW/0·73. TBW is present entirely within the FFM compartment of the body and it is assumed, under the classical approach for estimating FFM, that FFM has a hydration factor of 0·73(Reference St-Onge, Wang and Horlick33, Reference Wang, Deurenberg and Wang34). The volume of TBW was calculated as the sum of ECW and ICW.
Estimation of skeletal muscle mass using bioelectrical impedance spectroscopy equations
BIS was used to estimate SMM using two predictive equations previously derived from BIS (one using body weight and one without) established by Tengvall et al. (Reference Tengvall, Ellegård and Malmros19) on a sample of ninety-eight community-dwelling older adults aged ≥ 75 years.
Equations for estimating SMM from BIS are:
 $$\begin{eqnarray} (1)\,SMM_{BW} = - 23\cdot 953 + (0\cdot 333\times Ht) + ( - 0\cdot 004\times Ri) + ( - 0\cdot 010\times Re) + ( - 1\cdot 727\times sex) + (0\cdot 042 \times BW); \end{eqnarray}$$
 $$\begin{eqnarray} (2)\,SMM_{noBW} = - 24\cdot 05 + (0\cdot 365 \times Ht) + ( - 0\cdot 005\times Ri) + ( - 0\cdot 012 \times Re) + ( - 1\cdot 337\times sex), \end{eqnarray}$$
where Ht is height in cm, Ri is intracellular resistance, Re is extracellular resistance, sex = 1 for women and = 0 for men, and BW is body weight.
Statistical analysis
Analyses were performed using SPSS for Windows 17.0 software (SPSS Inc.). Significance was set at P< 0·05. Descriptive statistics were calculated for weight, BMI, SMMDXA, SMMCAMA, FFMDXA, FFMBIS and SMM from the predictive equations and expressed as mean values and standard deviations. Paired t tests were conducted to explore differences between field methods, the predictive equations and DXA for the assessment of FMM and SMM at each time point. Spearman's correlation coefficients were calculated to explore the association between the field methods of body composition assessment and DXA. The mean bias between body composition field methods, the predictive equations and DXA were assessed by paired t test. Repeated-measures ANOVA were conducted to explore changes in the mean bias between field methods, the predictive equations and DXA across each assessment time point. The LOA between body composition field methods, the predictive equations and DXA were assessed using the technique described by Bland & Altman(Reference Bland and Altman35, Reference Bland and Altman36). In this technique, the difference between a given body composition field method and DXA was plotted along the vertical axis against the mean of the two measures on the horizontal axis where the aim was to describe the variability in agreement between the two measures(Reference Bland and Altman36, Reference Watson and Petrie37). Assuming a normal distribution of differences, theoretically, 95 % of the differences are expected to be within ± 2 sd(Reference Bland and Altman36, Reference Watson and Petrie37). Linear regression analyses were conducted to identify whether the regression line was significantly different to zero(Reference Bland and Altman36).
Results
Descriptive statistics
DXA results were available on seventy-nine participants at baseline (twenty-three males and fifty-six females), seventy-five participants at the 6-month (6M) assessment (twenty males and fifty-five females) and sixty-three participants at the 12-month (12M) assessment (sixteen males and forty-seven females). The mean age of participants at baseline was 82·7 (sd 5·9) years (males 81·5 (sd 6·4) years; females 83·1 (sd 5·7) years). Mean weight, BMI, SMMDXA, FFMDXA, SMMCAMA, FFMBIS and SMM from the predictive equations at each study time point (baseline, 6M and 12M) are highlighted in Table 1. Significant differences between field methods, the predictive equations and DXA for the estimation of FFM and SMM at each study time point are also highlighted in Table 1.
Table 1 Anthropometric characteristics at baseline and at 6 and 12 months after hip fracture in male and female participants (Mean values and standard deviations)

SMM, skeletal muscle mass; DXA, dual-energy X-ray absorptiometry; FFM, fat-free mass; CAMA, corrected arm muscle area; BIS, bioelectrical impedance spectroscopy.
* Significant differences in the mean values for SMM and FFM between field methods, predictive equations and DXA assessed by paired t test (P< 0·05).
† Tengvall et al. equation 1 excludes body weight as a predictor of SMM in the regression model.
‡ Tengvall et al. equation 2 includes body weight as a predictor of SMM in the regression model.
Measures of agreement
At baseline, 6M and 12M, Bland–Altman analyses illustrated a mean bias of 0·7 (95 % LOA − 10·9, 12·4), − 0·5 (95 % LOA − 20·7, 19·8) and 0·1 (95 % LOA − 8·7, 8·9) kg, respectively, for the assessment of FFMBIS when compared against FFMDXA (Table 2). No significant changes were observed in the mean bias between FFMDXA and FFMBIS across each assessment time point (P= 0·779). However, when included as an independent covariate, sex had an influence on change in the mean bias over time (P= 0·007). The influence of BMI had no effect on change in the mean bias (P= 0·192). Linear regression analyses identified significant proportional bias between FFMDXA and FFMBIS (β = − 0·337; P= 0·04) at baseline only (Fig. 1).
Table 2 Correlations and 95 % limits of agreement (LOA) between dual-energy X-ray absorptiometry (DXA), a reference technique, and field methods for the assessment of fat-free mass (FFM) and skeletal muscle mass (SMM) at baseline, and at 6 and 12 months post-hip fracture
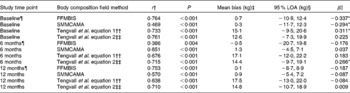
BIS, bioelectrical impedance spectroscopy; CAMA, corrected arm muscle area.
* Significant proportional bias (P< 0·05).
† Association between body composition field methods, predictive equations and DXA assessed by Spearman correlation analyses (P< 0·05).
‡ Mean bias between body composition field methods, predictive equations and DXA assessed by paired t test.
§ 95 % LOA indicates the mean difference between body composition field methods, predictive equations and DXA ± 1·96.
∥ Proportional bias in the mean difference between body composition field methods, predictive equations and DXA assessed by linear regression analyses.
¶ Study sample size at each assessment time point: baseline, n 79; 6 months, n 75; 12 months, n 63.
†† Tengvall et al. equation 1 excludes body weight as a predictor of SMM in the regression model.
‡‡ Tengvall et al. equation 2 includes body weight as a predictor of SMM in the regression model.

Fig. 1 Bland–Altman plots: mean bias and 95 % limits of agreement for the assessment of fat-free mass (FFM) by bioelectrical impedance spectroscopy (BIS) and FFM by dual-energy X-ray absorptiometry (DXA), the reference technique. Body composition data were collected from males (○) and females (■) at baseline (a) (males, n 23; females, n 56) and at 6 months (b) (males, n 20; females, n 53) and 12 months (c) (males, n 16; females, n 47) post-surgery for hip fracture. (–), Mean difference between DXA and BIS; (––), 95 % limits of agreement ( ± 1·96 sd) between the two measures. The line of regression is highlighted by the slope-intercept on the y-axis.
At each assessment time point, SMMCAMA overestimated SMM from DXA. At baseline, 6M and 12M, a mean bias of 0·3 (95 % LOA − 11·7, 12·3), 1·3 (95 % LOA − 4·5, 7·1) and 0·9 (95 % LOA − 5·4, 7·2) kg was observed (Table 2). Similarly, there were no significant changes in the mean bias between SMMDXA and SMMCAMA across each assessment time point (P= 0·174). The influence of sex and BMI had no effect on change in the mean bias (sex, P= 0·639; BMI, P= 0·518). Similarly, significant proportional bias was observed at baseline only between SMMDXA and SMMCAMA (β = − 0·294; P= 0·01) (Fig. 2).
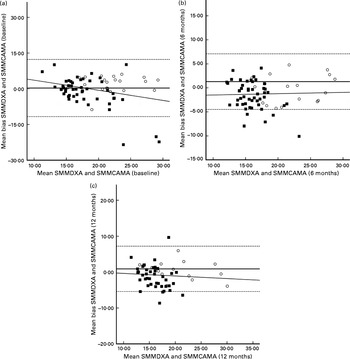
Fig. 2 Bland–Altman plots: mean bias and 95 % limits of agreement for the assessment of skeletal muscle mass (SMM) by corrected arm muscle area (CAMA) and SMM by dual-energy X-ray absorptiometry (DXA), the reference technique. Body composition data were collected from males (○) and females (■) at baseline (a) (males, n 23; females, n 56) and at 6 months (b) (males, n 20; females, n 53) and 12 months (c) (males, n 16; females, n 47) post-surgery for hip fracture. (–), Mean difference between DXA and CAMA. (––), 95 % limits of agreement ( ± 1·96 sd) between the two measures. The line of regression is highlighted by the slope-intercept on the y-axis.
Estimates of SMM from both predictive equations also overestimated SMM from DXA at each assessment time point (equation 1: baseline, 15·1 kg; 6M, 17·1 kg; 12M, 17·5 kg; equation 2: baseline, 12·6 kg; 6M, 14·4 kg; 12M, 14·8 kg) (Table 2). Significant changes were observed in the mean bias across each assessment time point for both predictive equations (equation 1, P= 0·002; equation 2, P= 0·001). Significant proportional bias was observed at baseline between SMMDXA and predictive equation 1 (β = 0·311; P= 0·05) and at 6M between SMMDXA and predictive equation 2 (β = 0·266; P= 0·05).
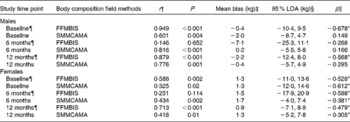
Sex-specific analyses are presented in Table 3. FFMBIS in males consistently underestimated FFM from DXA (male: baseline, − 0·4 kg; 6M, − 7·1 kg; 12M, − 2·2 kg). Compared with FFMBIS, the mean bias and 95 % LOA for SMMCAMA were smaller and narrower among males (Table 3). Significant proportional bias was observed in males for the assessment of FFMBIS only at baseline (β = − 0·678; P< 0·01) and 12M (β = − 0·568; P< 0·04). In females, FFMBIS and SMMCAMA overestimated FFM and SMM from DXA (FFMBIS: baseline, 1·3 kg; 6M, 1·5 kg; 12M, 0·9 kg; SMMCAMA: baseline, 1·3 kg; 6M, 1·7 kg; 12M, 1·3 kg). A clear pattern in the 95 % LOA was observed for the assessment of SMMCAMA, with LOA narrowing at 6M and 12M relative to baseline (Table 3). Significant proportional bias was observed in females for the assessment of FFMBIS and SMMCAMA at baseline (FFMBIS: β = − 0·528, P= 0·006; SMMCAMA: β = − 0·612, P< 0·001), 6M (FFMBIS: β = − 0·588, P< 0·001; SMMCAMA: β = − 0·381, P= 0·007) and 12M (FFMBIS: β = − 0·479, P= 0·002; SMMCAMA: β = − 0·305, P= 0·05).
Table 3 Correlations and 95 % limits of agreement (LOA) between dual-energy X-ray absorptiometry (DXA), a reference technique, and field methods for the assessment of fat-free mass (FFM) and skeletal muscle mass (SMM) at baseline, and at 6 and 12 months post-hip fracture in male and female participants
BIS, bioelectrical impedance spectroscopy; CAMA, corrected arm muscle area.
* Significant proportional bias (P< 0·05).
† Association between body composition field methods and DXA assessed by Spearman correlation analyses (P< 0·05).
‡ Mean bias between body composition field methods and DXA assessed by paired t test.
§ 95 % LOA indicates the mean difference between body composition field methods and DXA ± 1·96.
∥ Proportional bias in the mean difference between body composition field methods and DXA assessed by linear regression analyses.
¶ Study sample size at each assessment time point. Males: baseline, n 23; 6 months, n 20; 12 months, n 16. Females: baseline, n 56; 6 months, n 55; 12 months, n 47.
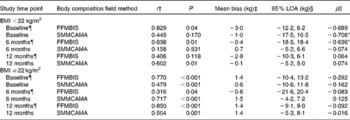
BMI-specific analyses are presented in Table 4. For participants with BMI < 22 kg/m2, FFMBIS underestimated FFM from DXA (BMI < 22 kg/m2: baseline, − 3·0 kg; 6M, − 0·4 kg; 12M, − 2·9 kg) (Table 4). For the assessment of SMMCAMA, the mean bias was smaller and the 95 % LOA were narrower (with the exception of baseline) at each assessment time point (Table 4). Significant proportional bias was present for the assessment of FFMBIS and SMMCAMA at baseline (SMMCAMA: β = − 0·706; P= 0·01) and 6M (FFMBIS: β = − 0·636; P= 0·01). For participants with BMI ≥ 22 kg/m2, FFMBIS overestimated FFM from DXA at baseline and 12M (BMI ≥ 22 kg/m2: baseline, 1·4 kg; 6M, − 0·6 kg; 12M, 1·4 kg) with the 95 % LOA wide, narrowing at 12M (Table 4). SMMCAMA overestimated SMM from DXA at all study time points (BMI ≥ 22 kg/m2: baseline, 0·6 kg; 6M, 1·5 kg; 12M, 1·4 kg) with the 95 % LOA progressively narrowing from baseline (Table 4).
Table 4 Correlations and 95 % limits of agreement (LOA) between dual-energy X-ray absorptiometry (DXA), a reference technique, and field methods for the assessment of fat-free mass (FFM) and skeletal muscle mass (SMM) at baseline, and at 6 and 12 months post-hip fracture, separated by BMI (kg/m2)
BIS, bioelectrical impedance spectroscopy; CAMA, corrected arm muscle area.
* Significant proportional bias (P< 0·05).
† Association between body composition field methods and DXA assessed by Spearman correlation analyses (P< 0·05).
‡ Mean bias between body composition field methods and DXA assessed by paired t test.
§ 95 % LOA indicates the mean difference between body composition field methods and DXA ± 1·96.
∥ Proportional bias in the mean difference between body composition field methods and DXA assessed by linear regression analyses.
¶ Study sample size at each assessment time point. BMI < 22 kg/m2: baseline, n 11; 6 months, n 18; 12 months, n 18. BMI ≥ 22 kg/m2: baseline, n 68; 6 months, n 57; 12 months, n 45.
Discussion
The present measurement study explored bias and LOA between two portable body composition assessment methods (BIS and CAMA) against a reference technique (DXA) in older adults after surgical fixation for hip fracture. According to the findings of the present study, both field methods were deemed unsuitable for use as a predictor of body composition at the individual level within a clinical setting; however, they may be of use at the population level. Moreover, we also found the use of two previously established predictive equations inappropriate for application as a predictor of SMM in older adults post-surgery for hip fracture.
While much is known about the validity of body composition methods in healthy adult populations, studies investigating the validity of body composition assessment techniques in the clinical setting, such as in orthopaedic patients, are rare. The investigation of non-elective orthopaedic cases and body composition assessment is gaining momentum in the literature. In 2010, an Australian study was published which explored body composition amongst female hip fracture patients through comparison of measured body composition using DXA against a predictive equation derived from a healthy population aged 18–82 years(Reference Mitchell, Hilmer and Kirkpatrick20, Reference Janmahasatian, Duffull and Ash38, Reference Han, Duffull and Kirkpatrick39). Not surprisingly, the authors of this study determined that the predictive equation was inappropriate for application with older adults following hip fracture, with a mean bias of − 0·59 (95 % LOA − 8·11, 9·29) kg(Reference Mitchell, Hilmer and Kirkpatrick20). Similar to the present study, Mitchell et al. (Reference Mitchell, Hilmer and Kirkpatrick20) reported on data at independent time points throughout recovery (baseline, 4 months, 12 months) and found that validity improved over time. We also showed poor agreement for both field methods at baseline (including significant proportional bias), being hence inappropriate for use at the individual level, with LOA being most narrow yet still unacceptable at 12 months following surgery.
Unlike the study reported by Mitchell et al. (Reference Mitchell, Hilmer and Kirkpatrick20), the present study included both males and females. Interestingly, in the present study, FFMBIS overestimated FFM from DXA at each study time point for females; however, in males the trend was for FFMBIS to underestimate FFM from DXA. We also showed that sex independently influenced change in the mean bias across each assessment time point between FFMDXA and FFMBIS. This is an important consideration for practitioners, as the generic application of equations generated using a sample of a single sex only is likely to be inappropriate. While there is insufficient data amongst hip fracture patients to confirm this, a previous study reporting on a large cohort of middle-aged males and females showed that the distribution of TBW varies between sex and with body composition(Reference Ritz, Vol and Berrut40). Ritz et al. (Reference Ritz, Vol and Berrut40) showed that with increasing BMI, TBW makes a significantly lower proportion to body weight with women having less water per kg body weight relative to males.
Although it is impossible to determine a causative explanation for the potential for bias between our measurements of FFMBIS and FFMDXA, one explanation may be the lack of validity of BIS measurements in members of an ageing population that have undergone an acute injury and have multiple co-morbidities, including malnutrition. Although BIS models and equations have previously been shown to be accurate in healthy populations(Reference Kyle, Genton and Hans41, Reference Pietrobelli, Formica and Wang42), these equations are often specific to the population that they were derived from. Disturbances in hydration and electrolyte status among older adults in an acute hospital setting may also have been a contributing factor to the large individual variation shown, particularly at baseline. Dehydration is a common occurrence in frail elderly hospitalised patients(Reference Soeters, Reijven and van Bokhorst-de van der Schueren43). Consequently, an increase in the ECW:ICW ratio may result in a surplus of fluid, particularly in malnourished patients where the ICW volume may be lower(Reference Soeters, Reijven and van Bokhorst-de van der Schueren43, Reference van Venrooij, Verberne and de Vos44). A previous study showed that the ICW:TBW ratio decreased and the ECW:ICW ratio increased significantly in the lower leg with ageing(Reference Yamada, Schoeller and Nakamura45).
The second field method for assessment of body composition explored in the present study was CAMA. CAMA is a widely accepted and valid method of determining nutritional status in an older adult population(Reference Miller, Crotty and Giles31); however, its validity in estimating SMM is yet to be thoroughly investigated. The present study showed a similar mean bias and LOA to a previous study conducted by our group(Reference Yaxley, Miller and Masters46). When assessing the validity of CAMA against DXA in the assessment of SMM, Yaxley et al. (Reference Yaxley, Miller and Masters46) reported a mean bias of − 0·97 (95 % LOA − 8·37, 6·43) kg. However, participants from this particular study were elective orthopaedic patients and therefore these results cannot necessarily be generalised to a population of hip fracture patients. Moreover, the present study involved three measurements at different stages in recovery post-hip fracture whereas the study conducted by Yaxley et al. (Reference Yaxley, Miller and Masters46) included CAMA measures at one time point only. In the present study, we found that CAMA overestimated SMM by 0·3 kg at baseline, 1·3 kg at 6M and 0·9 kg at 12M when compared with DXA. Despite the mean bias being relatively small over time, any underestimation in lean muscle in a population that is already at nutritional risk is concerning. Similar to our findings for BIS, the LOA for the comparison of SMM from CAMA v. DXA narrowed over time (from baseline) suggesting that this method could be applied at the population level. Our findings do, however, provide some evidence that body size may influence the level of bias. Our subgroup analyses demonstrated that in participants with a BMI < 22 kg/m2 (with the exception of baseline measures), the mean bias for SMMCAMA was lower compared with participants with BMI ≥ 22 kg/m2, suggesting that upper-arm anthropometry becomes more difficult to measure in larger patients.
Previously established predictive equations overestimated SMM in our sample. The mean bias increased from baseline at 6 and 12 months for both predictive equations and the 95 % LOA were wide. Typically, a combination of impedance and anthropometric measures have been used as predictors in body composition equations(Reference Tengvall, Ellegård and Malmros19). The equations established by Tengvall et al. (Reference Tengvall, Ellegård and Malmros19) used a combination of body weight and BIS measures. However, in an older adult population there are several anthropometric and physical measures that have been demonstrated to predict SMM(Reference Cruz-Jentoft, Baeyens and Bauer7) and may be more appropriate for use than body weight alone. Furthermore, poor agreement shown in the present results could also be the result of the sample used in the development of the predictive equations who were non-orthopaedic older adults that were unlikely to undergo the same decline in body composition as occurs post-hip fracture(Reference Miller, Bannerman and Daniels10, Reference Ensrud, Ewing and Stone47).
Despite there being numerous advantages in using upper-arm anthropometry in a clinical acute care setting, measurement error and violation of measurement protocols may be problematic in a clinical setting and may even have contributed to the proportional bias for CAMA estimates of SMM observed in the present study. Moreover, a potential limitation in the present study is that we used knee height for estimating standing height, which is an important consideration in the equation for estimating SMM from CAMA(Reference Heymsfield, McManus and Stevens30, Reference Heymsfield, McManus and Smith32). The knee height equation used in the present study has, however, been validated(Reference Chumlea24, Reference Pini, Tonon and Cavallini25) and provided a more feasible alternative to standing height in our frail sample. The use of BIS also has advantages including minimal participant burden, ease of use and portability. However, the cost for purchase and maintenance of equipment can be restrictive. Regardless of the advantages of these field methods, the present study has determined that neither is suitable for application to individual hip fracture patients, with the consequences of application extending to misclassification of nutritional status and inappropriate nutritional management. Either new methods need to be explored, such as near-IR spectroscopy which has recently been reported to be accurate and reliable for the estimation of appendicular muscle mass when compared against DXA among older adults(Reference Yoshida, Shimada and Harada48), or alternative algorithms must be developed using hip fracture patient samples that have high predictive power.
In conclusion, the results from the present study highlight that clinicians should be cautious in using portable field methods and predictive equations to estimate FFM and SMM at the individual level for hip fracture patients. They should be particularly cautious in the acute phase of recovery in light of the evidence from the present study suggesting poor agreement and proportional bias. With identification of methods and/or algorithms that demonstrate sufficient agreement against DXA, further research will be positioned to explore repeatability and predictive power.
Acknowledgements
This research was supported by the National Health and Medical Research Council (NHMRC), Australia. M. M., I. D. C., C. W., S. K. and M. C. were responsible for designing the study, analysing and interpreting the data and preparing the manuscript. A. M. V. contributed to analysing and interpreting the data and preparing the manuscript. There are no conflicts of interest.


