


Globally, the number of people facing some degree of hunger increased from 777 million in 2015 to 815 million by 2017, possibly as a result of ongoing conflicts and climate shocks(1). At the same time, an estimated 22·2 and 7·5 % of all children aged <5 years were stunted or wasted, respectively(2). A third of all those wasted live in Africa, where an estimated 58·7 million children also face some form of stunting(2). Despite continuous efforts, progress towards meeting the international targets on child nutrition and food security has not been sufficient(Reference Black, Allen and Bhutta3). Both are multifaceted concepts influenced by a number of factors, but improved food security, although not sufficient alone, is a means to better nutritional status(Reference Mutisya, Kandala and Ngware4,Reference Engle, Menon and Haddad5) .
Household food insecurity impacts nutrition by limiting the quantity and quality of food consumed by all the members of a household(Reference Black, Allen and Bhutta3). The smallest children are susceptible to such changes since their development, growth and physiology are dependent on sufficient food intake(Reference Mutisya, Kandala and Ngware4,Reference Fotso, Madise and Baschieri6–Reference Martorell8) . Previous studies have assessed the association between household food insecurity and the prevalence of child malnutrition, but the reported results are inconsistent(Reference Mulu and Mengistie9,Reference Humphries, Dearden and Crookston10) . For example, studies from Kenya(Reference Mutisya, Kandala and Ngware4) and Ghana(Reference Saaka and Osman11) have found an association between stunting and household food insecurity; however, in Ethiopia(Reference Mulu and Mengistie9) and Nepal(Reference Osei, Pandey and Spiro12), the association was found to be insignificant. Similarly, a study from Nigeria(Reference Ajao, Ojofeitim and Adebayo13) has found that children in food-insecure households are five times more likely to be wasted. That said, researchers in Ethiopia have found no statistically significant association(Reference Mulu and Mengistie9). It is not clear why studies have found varying results, but as explained by Humphries et al.(Reference Humphries, Dearden and Crookston10), studies often employed cross-sectional designs that only reflected the possible associations at a specific point in time. They further explained how different food insecurity patterns will have unique associations due to the underlying experiences and causes(Reference Humphries, Dearden and Crookston10), such as unexpected climatic events. These events can limit food production and availability(Reference Devereux14,Reference Wantanabe, Cullmann and Pathak15) , driving the cost of food up and putting the most vulnerable households at risk of food insecurity. In addition, they can cause displacement or temporary migration of families with negative impacts on their livelihoods(Reference Call, Gray and Yunus16). The most susceptible to such impacts are those located within developing countries due to high poverty rates, low adaptive capacity and a reliance on rain-fed agriculture(Reference Tirado, Hunnes and Cohen17,Reference Hall, Dawson and Macdiarmid18) . Exposure to flooding or droughts has also been found to negatively impact child stunting and wasting(Reference Alderman19–Reference Rodriguez-Llanes, Ranjan-Dash and Degomme22); however, it is not clear whether this is directly due to food insecurity, migration, livelihood changes or even continuous illnesses. In addition, current studies use a range of different tools to measure food insecurity. Coupled with the wide variety of underlying causes, study setting and study designs, this makes it difficult to make direct comparisons across different studies.
South Africa, a middle-income country(23), had an estimated prevalence of severe food insecurity at 22·5 % between 2014 and 2016(1). The country also experiences high levels of chronic undernutrition in children, with recent figures showing child stunting at 27 % in 2016(24), up by 2 % since 2008(25). Between 2014 and 2016, the country experienced severe drought, resulting in food price inflation of 7·3 %(26) and a 47 % increase in the cost of staple produce (maize)(27). In the district of iLembe, the effects of drought were delayed, prolonged and disproportionally affected the poorest households, with a significant increase in those facing high or severe food insecurity by the end of 2017, by which time the drought had ended (unpublished results). Although there is limited research on the negative health effects of a drought, particularly in South Africa, exposure to a drought during infancy has been estimated to increase the risk of disability later in life by 3·5–5·5 %, specifically for physical and mental disabilities(Reference Dinkelman28). It is also anticipated that due to changes in river flows, drinking water supplies may become contaminated, resulting in outbreaks of diseases such as cholera and dysentery(Reference Wright, Garland and Norval29). In addition, a drought can have multiple adverse effects on health outcomes that vary depending on a number of factors, including the underlying vulnerability of the population and the intensity or duration of the drought(Reference Stanke, Kerac and Prudhomme30). While the negative health effects of a drought are apparent, there is little evidence to highlight how a drought may impact nutrition. This article aims to address this gap by measuring child nutritional status during and after a drought. In addition, it assesses the association between child nutritional status and household food insecurity, taking time and the drought into consideration. Due to the heightened experience of food insecurity after a drought, it was hypothesised that the nutritional status of children would be worse in the second study period, and that children living in food-insecure households would more likely be malnourished.
Methods
This article reports on the data from a larger research project that measured and compared household food insecurity and child nutritional status in the district of iLembe, KwaZulu-Natal. The study used a natural experimental design repeating two cross-sectional household surveys. According to Remler and Van Ryzin(Reference Remler, van Ryzin, Remler and van Ryzin31), a natural experiment uses a naturally occurring situation such as a flood or heatwave, and is able to make comparisons after the event. Such studies are often difficult to replicate but have a ‘unique power to test hypothesises at ecologically realistic scales’(Reference Barley and Meeuwig32, p. 331). Given the threat of climate change and the acceleration of human transformation, such experiments can be extremely useful for both ecological and health studies(Reference Barley and Meeuwig32). This study uses the occurrence of severe drought experienced between 2014 and 2016 as the natural variable with the first survey taking place in November 2016 while the drought was ongoing. The second household survey was conducted a year later when the drought had come to an end.
Study area
The study took place in the district of iLembe, located in the South African province of KwaZulu-Natal with a total population of 606 809 and 157 692 households(33). The area lies along the eastern coast of South Africa and is situated north of Durban, the province’s major city. The district is divided into four sub-districts – KwaDukuza, Mandeni, Maphumulo and Ndwedwe – and further into seventy-seven local wards. Agriculture is the fourth largest industry to contribute to employment within the district(34); however, the area experiences high levels of unemployment at 30·6 %(35). Nutritional status in children in the area is relatively very poor, with figures from 2014 showing 21·1 % of children aged <5 years being stunted and a further 7·5 % severely stunted(Reference Dukhi, Sartorius and Taylor36). The province was affected by severe drought between 2014 and 2016. In 2016, the average annual rainfall was approximately 804·7 mm, and by 2017, this increased to 1132·5 mm (unpublished results). Although the average rainfall during the drought appeared to be high, the area had experienced an hydrological drought, defined as ‘a lack of water in the hydrological system, manifesting itself in abnormally low streamflow in rivers, and abnormally low levels in lakes reservoirs and groundwater’(Reference Van Loon37, p. 359). The low water levels in reservoirs caused water shortages and restrictions in the area, with taps reportedly being shut off for up to 12 h a day(38). Although the water levels had increased by 2017, the effects of the drought were still being felt by the poorest households (unpublished results).
Sampling
The overall study had two outcome variables: household food insecurity and child nutritional status. Households were eligible for participation on the basis that they had at least one child aged <5 years available for the study. Given the numerous methods for measuring food insecurity and the difficulty in obtaining a national prevalence at the time of data collection, the researchers decided to use child nutritional status as the main outcome variable in the following sampling equation:
 $$n = \left( {{z^2}} \right)\left( {{{\left( p \right)\left( q \right)} \over {{d^2}}}} \right)$$
 $$n = \left( {1\cdot{{96}^2}} \right)\left( {{{\left( {0\cdot1} \right)\left( {0\cdot9} \right)} \over {0\cdot{{03}^2}}}} \right)$$
 $$n = 384\cdot16$$
Considering an estimated global prevalence of acute child malnutrition of 10 % (P), a degree of precision of 3 % (d) and a CI of 95 % (z), 384 children needed to be included. Assuming a household would have only one child aged <5 years and a non-response rate of 5 %, a target of 402 household surveys was set.
From the seventy-seven local wards in the district, forty-nine were eligible for selection based on an average monthly income of R1200 ($82) per month. The forty-nine wards were listed and given a numerical identifier, from which ten wards were randomly selected. While the same wards were used during both time-points, the households selected varied. In round 1, forty households were randomly selected in each of the ten wards. Data collectors were advised to visit every fifth household, and should that household not have a child aged <5 years, the next household was visited until a household with a child was found. Following this, every fifth house was visited again. In round 2, the number of households sampled in each ward was done through probability proportional to size (PPS)(39). Data collectors were advised to follow the same process as before by visiting every fifth household until the desired target for the ward was met. Data from round 1 was weighted based on ward sample sizes from round 2, which were self-weighted following the PPS. This ensured that both samples were representative of the population and were eligible for comparison. The full sampling process can be seen in Fig. 1.

Fig. 1 Participant sampling process
Household survey
The main caregiver of each child was requested to fill in a questionnaire capturing information on household characteristics, food and water and the local environment. Each participant was presented with a list of twelve coping strategies and advised to state the frequency in which each one had been used within the last year during times of limited food. Based on these coping strategies, food insecurity was measured using a Coping Strategies Index (CSI) adapted specifically for implementation in iLembe through a preliminary fieldwork(Reference Drysdale, Moshabela and Bob40). Each coping strategy had been given a severity score ranging from 1 to 4, with 1 being the least severe, a strategy likely to be carried out first, and 4 being the most severe, a strategy that would be considered a last resort. A CSI score was calculated for each household by multiplying the frequency of each coping strategy by its related severity score and summing up the total. A score of 0 indicated that a household had reported no food insecurity and thus experienced no food shortages, while a higher CSI score signalled a more severe experience. Food insecurity was categorised based on the maximum CSI score from the two rounds, namely none, low, moderate, high or severe. Information on all available children aged <5 years was collected through the questionnaire and included data on their mother, their health and their feeding practices. The child’s age was recorded in months and years, and anthropometric measures were taken for all the available children aged <5 years. Children aged <2 years were measured in a recumbent position from their crown to their feet to the nearest centimetre using Seca© length boards. Children aged >2 years were measured from their crown to the floor to the nearest centimetre, while standing barefoot against a wall, using Seca© measuring tapes. Children aged <2 years were weighed while being held by their caregiver on a Seca© electronic flat scale that allowed for the mother/child function. Children aged >2 years were weighed standing alone without shoes on the same scale to the nearest gram, and measurements were repeated for accuracy. If the measurements were not the same, a third or fourth was taken and the most common one was recorded. Height-for-age z-scores (HAZ), weight-for-height z-scores (WHZ) and weight-for-age z-scores (WAZ) were computed using the WHO’s Anthro 3.2.2 and categorised based on the WHO growth standards(41). Children with z-scores <–2 sd were deemed as stunted for HAZ, underweight for WAZ and wasted for WHZ. Those with z-scores <–3 sd were deemed as severe in each category. Children with a z-score >+2 sd for WHZ were deemed as overweight and those >+3 sd were categorised as obese. Normal HAZ and WAZ scores were that of >–2 sd. Normal WHZ scores were between –2 and +2 sd.
Data analysis
Data were captured and analysed using Stata I/C 13. An index of socioeconomic status was calculated for each household using the principal components analysis (PCA)(Reference Vyas and Kumaranayake42). Variables often attributable to a household’s socioeconomic status were incorporated into the index, including income, number of people in the household, dwelling type and water, sanitation and hygiene access. In addition, ownership of items such as a television or fridge was also included. A household was categorised as having a low, medium or high socioeconomic status through this approach. Based on the PCA scores calculated in each round, the poorest third of the sampled population were categorised as low; the middle third as medium; and the richest as high socioeconomic status.
Descriptive statistics were used to show the demographic profiles of households and individual characteristics and nutritional status of children included in both rounds of the study. χ 2 was calculated on a number of household and child variables to determine if the sample characteristics varied significantly over the two time-periods. Simple linear regression was employed to determine the association between child nutritional status and water, sanitation and hygiene (WASH) access, as well as the relationship between nutritional status and household food insecurity. Continuous CSI scores for each household were used to represent food insecurity as the independent variable. The dependent variables used for child nutritional status were the continuous z-scores for HAZ, WAZ and WHZ. Multiple linear regression was then carried out taking into consideration additional variables that may impact child nutritional status. The variables incorporated into the model were chosen through the stepwise function in Stata and included how the child is fed, mother’s education, household socioeconomic status and child health status. Simple linear regression was also carried out to assess the association between child nutritional status, their location and the frequency in which households carry out certain coping strategies. All statistical tests were considered significant with a P-value <0·05.
A small number of households had more than one child aged <5 years in each time-point, which could potentially skew the results. In order to assess whether a cluster analysis was required at the household level, the researchers tested different cluster analysis models and a sensitivity analysis involving only one child per household. There was little variation in the presented results and conclusions. The researchers therefore chose not to conduct a cluster analysis based the following recommendation by Lambert(Reference Lambert43):
accounting for person group clustering will not in many examples make a substantial difference to the results of statistical analyses … until it has been examined …, there is always the possibility that failure to consider person group clustering will lead to mis-specified results. (p. 33)
Ethical considerations
Ethical approval was obtained from the Humanities and Social Sciences Research Ethics Committee from the University of KwaZulu-Natal (HSS/1500/016D). Prior to the household survey, participants were briefed about the purpose of the study in both isiZulu and English. An informed consent, also written in isiZulu and English, was signed by all participants. Permission to include a child was granted by the main caregiver who supervised all activities.
Results
Household characteristics
In total, 431 children from 376 households were included in round 1 of data collection, and 387 children from 370 households in the round 2. Information on household demographics is provided in Table 1. The income of households increased between the two rounds, with 44·7 % of households having a monthly income under R1000 ($68) in round 1 compared with 5·4 % in round 2 (P < 0·001). In addition, 10·8 % more households earned above R5000 ($342) per month in round 2. Unemployment was lower in round 2, with a higher proportion either being employed or self-employed (P < 0·001). There was also a higher proportion of households relying on an old-age pension in round 2, which was more than R1500 ($103) a month, compared to a child support grant, which was less than R400 ($27) in both rounds(44,45) . The type of dwelling was similar during both rounds, with >70 % living in a formal concrete building. There was strong evidence of change in terms of water, sanitation and hygiene access between the two rounds. The majority of households relied on tap water either within their dwelling or from a public standpipe during both rounds. What did change was the reliance on a river or dam and a water tank (P < 0·001). The proportion of those using a river or dam decreased by 11·4 % from round 1 to round 2, while those who relied on a water tank increased by 13·6 % by round 2. Fewer households had access to a bath within their dwelling, with more making use of a bucket wash system in round 2 (P < 0·001). There was an increase in the number of participants who had access to a flush toilet within their home in round 2, and a decrease in those using a pit latrine (P < 0·020). Food insecurity categories and their respective CSI scores are shown in Table 1. There is strong evidence to suggest that household insecurity significantly increased between rounds 1 and 2 (P < 0·001). Although there was very little change in the proportion facing no food insecurity, and a decrease in those facing low or moderate food insecurity, the proportion facing high food insecurity increased from 1·6 % in round 1 to 6·8 % in round 2. In addition, no households were facing severe food insecurity in round 1, but 1·4 % were by round 2.
Table 1 Household characteristics of the study population

* P-value significant <0·05 for χ 2 analysis.
Child characteristics
The descriptive statistics of children are shown in Table 2. There was a significant change in the age of children (P < 0·003), with a higher proportion aged between 36 and 47 and 48 and 59 months by round 2. There were also fewer children aged between 0 and 11, 12 and 23 and 24 and 35 months in round 2. There was very little difference in the gender of children in both rounds, with almost 50 % of children belonging to either sex. For over 90 % of children, the mother was still alive at the time of data collection during both time-points. There was some evidence to suggest that mother’s education was better in round 1, with 53·2 % having completed secondary school to matric level, compared to 42·1 % in round 1 (P < 0·023). Fewer had completed up to grade 10 or primary school by round 2, but the same proportion had no education in both rounds.
Table 2 Descriptive characteristics, health conditions and nutritional status of sampled children aged <5 years
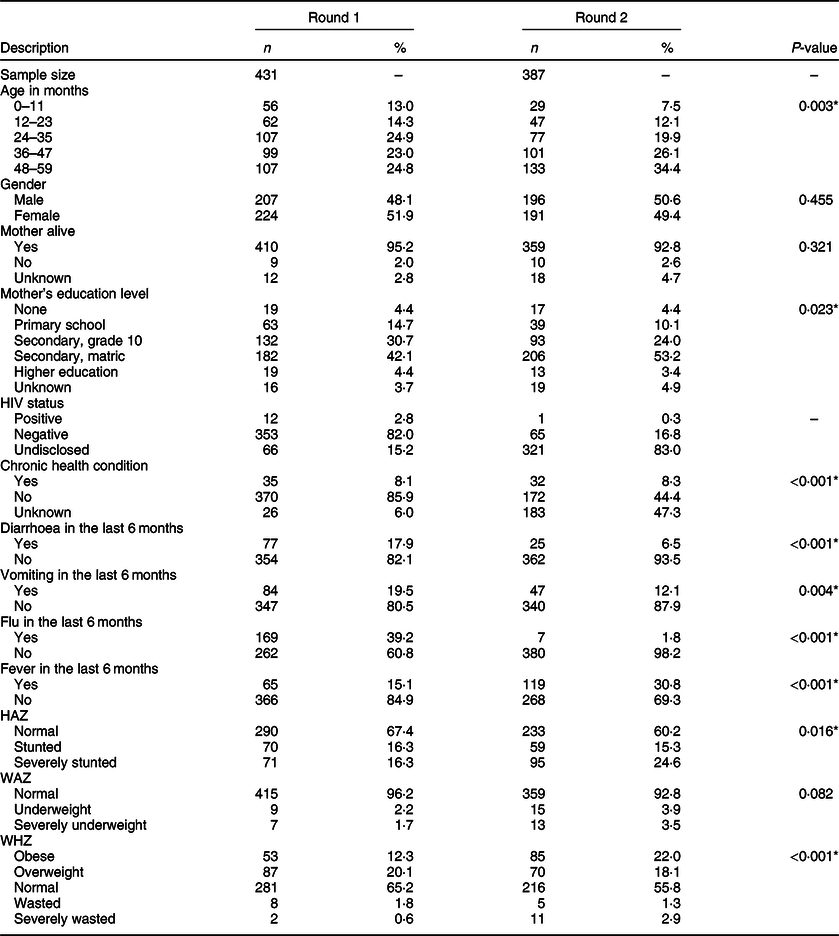
HAZ, height-for-age z-score; WAZ, weight-for-age z-scores; WHZ, weight-for-height z-scores.
* P-value significant <0·05 for χ 2 analysis.
The results highlighting child health status are shown in Table 2. In both rounds, a small proportion of children was reported as being HIV-positive. In round 2, more caregivers chose not to disclose the child’s HIV status. In terms of other chronic health conditions, 8·1 and 8·3 % had one such condition in rounds 1 and 2, respectively. The caregivers were also asked whether the child had experienced health problems within the last 6 months such as diarrhoea, vomiting, flu or a fever. Fewer children had suffered from flu, diarrhoea or vomiting in round 1 compared to round 2. The proportion of children reported to have experienced a fever doubled from 15·1 % in round 1 to 30·8 % in round 2.
Nutritional status
Between rounds 1 and 2, there was an increase in all nutritional outcomes, including overweight and obesity. There was a small increase in the number of children who are underweight and severely underweight from round 1 to round 2; however, the difference was not statistically significant (P < 0·082). There was strong evidence to suggest that child stunting, depicted by HAZ, changed significantly from round 1 to round 2 (P < 0·016), as seen in Table 2. Although the proportion of stunted children dropped slightly from 16·3 to 15·3 % by round 2, there was an increase of 8·3 % in those deemed severely stunted. There was also evidence to suggest a significant change in child wasting and obesity calculated through WHZ (P < 0·001). Although the proportion of children who were wasted or severely wasted only increased marginally, the increase in the proportion of obese children was much larger, from 12·3 % in round 1 to 22·0 % in round 2.
Table 3 shows the results of regression analysis testing the association between child nutritional status and access to WASH facilities. During the drought, there were negative associations between access to an outdoor flush toilet and child’s HAZ (P < 0·000) and WAZ (P < 0·024). There were also positive associations between child’s WHZ and access to a pit latrine (P < 0·029), and child’s WAZ and access to water through a public standpipe (P < 0·021) or water tank (P < 0·031). After the drought, only a positive association for WAZ and bathing access through a shower within the dwelling (P < 0·037) was found.
Table 3 Associations between child nutritional status and water, sanitation and hygiene access

HAZ, height-for-age z-score; WAZ, weight-for-age z-scores; WHZ, weight-for-height z-scores.
* P-value significant <0·05.
Food insecurity
Table 4 shows the levels of food insecurity faced by the children whose WHZ, HAZ and WAZ did not fall under ‘normal’. In round 1, 60 % of the children who were stunted lived in a household facing low food insecurity, with only 1 % facing a high or severe level of food insecurity. By round 2, there was a significant increase in those facing moderate or high and severe food insecurity at 20·8 and 11·0 %, respectively. This was also the case of a number of children who are overweight or obese, with 5·2 % more facing moderate food insecurity, and 7·6 % more facing high or severe levels by round 2. The proportions of those wasted and either food-secure or with low food insecurity remained similar between the rounds. There was, however, a small decrease in those facing moderate food insecurity, but an increase in those facing high or severe food insecurity. Similarly, for those who were underweight, the proportion who were moderately food-insecure decreased by round 2, but there was a 10·7 % increase in those facing high or severe food insecurity.
Table 4 Household food insecurity status of children (%) with HAZ, WAZ and WHZ not considered normal

HAZ, height-for-age z-score; WAZ, weight-for-age z-scores; WHZ, weight-for-height z-scores.
* P-value significant <0·05 for χ 2 analysis.
The results of simple and multiple linear regressions are shown in Table 5. Although there were increases in overweight, underweight and wasted children living in households facing high or severe food insecurity after the drought, no evidence was found to suggest an association between child’s WHZ or WAZ and food insecurity. Following a simple linear regression, there was a negative association between food insecurity and HAZ in round 2 (P < 0·001) but not in round 1. After multiple linear regressions controlling for other potential influencers such as the child having a chronic health problem or a fever, the association between HAZ and food insecurity was still only present in round 2 (P < 0·003). This suggests that when a household’s CSI score increases, a child’s HAZ decreases, indicating that a child will more likely be stunted when living in a household facing severe food insecurity.
Table 5 Associations between child nutritional status and household food security†

HAZ, height-for-age z-score; WAZ, weight-for-age z-scores; WHZ, weight-for-height z-scores.
† Multiple linear regression controlled for how the child is fed, the mother’s education, socioeconomic status, toilet, water and bathing access, whether the child has a chronic health condition, or has experienced a flu, vomiting or diarrhoea in the last 6 months. Dependent variable is the child nutritional status as a continuous variable. Food insecurity was measured using the continuous CSI score.
* P-value significant <0·05.
A regression analysis was carried out to assess the association between child nutritional status and living within an urban or rural area, the results of which are shown in Table 6. There was no association between WHZ or WAZ and the child’s place of living in either of the two rounds. While there was a negative association between HAZ and living in either a rural (P < 0·019) or urban (P < 0·001) area in round 2, the association was stronger for urban children, suggesting that they are more likely to be stunted compared to their rural counterparts. A simple linear regression was carried out to assess the association between HAZ and the frequency of households carrying out each of the twelve suggested coping strategies, differentiated between rural and urban households as shown in Table 7. The researchers decided only to assess HAZ due to a lack of evidence supporting an association between WHZ and WAZ and household food insecurity. As expected, there were no associations between stunting and coping strategies in round 1. For rural households, there was a negative association between HAZ and borrowing food (P < 0·001), buying food on credit (P < 0·001) and hunting or gathering wild food (P < 0·001) only. There was also a negative association between hunting and HAZ for urban households (P < 0·021) but not for buying on credit or borrowing food. Urban households, however, had a negative association between HAZ and an additional six coping strategies, including sending a household member to beg (P < 0·001), sending a child elsewhere to eat (P < 0·001) and reducing the number of meals eaten in a day (P < 0·001). Table 7 shows the severity score attributed to each coping strategy of the community within the study area(Reference Drysdale, Moshabela and Bob40). The strongest associations were found between stunting and the most severe coping strategies, which indicates that stunted children are more likely to live in households facing severe food shortages. Considering the coping strategies associated with stunting in urban and rural households, it appears that urban households were facing more severe food shortages and carrying out extreme coping strategies, which were having a higher impact on child stunting, than rural households.
Table 6 Associations between child nutritional status and household location†

HAZ, height-for-age z-score; WAZ, weight-for-age z-scores; WHZ, weight-for-height z-scores.
† Simple linear regression looked at the association between child nutritional status and residing in a rural or urban area. Dependent variable is child’s anthropometric indices as a continuous variable.
* P-value significant <0·05.
Table 7 Association between height-for-age z-score and household coping strategies†
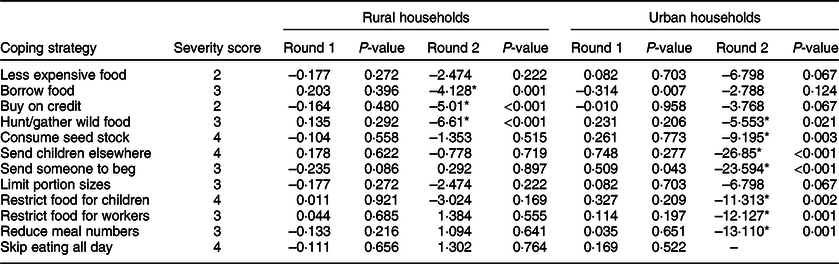
† Simple linear regression looked at the association between child stunting and coping strategies carried out by the household. Dependent variable is child’s anthropometric measure as a continuous variable. The exposure variable is the frequency in which a household reported having carried out a coping strategy.
* P-value significant <0·05. Data from round 1 has been weighted based on the ward sample sizes in round 2.
Discussion
The results indicated a significant change in child nutritional status between the two time-points – during and after the drought. The increase in the number of children being underweight was relatively small, as it was for wasting. The most significant increases were found for all forms of stunting from 22·6 to 39·9 %, and obesity from 12·3 to 22·0 %. The prevalence of stunting reported by this study is alarmingly high, particularly after the drought in 2017. A previous study conducted in iLembe also found the prevalence to be higher than the national average in 2014(Reference Dukhi, Sartorius and Taylor36). It is also important to note that the population sampled for this study were poorest households in the district. National surveys have highlighted the effect such a sample can have on the reported results; for example, the South African Demographic Health Survey in 2016(46) found that 27 % of the population aged <5 years were stunted. This increased to 36 % when only the poorest of the population were considered. The survey also found that the prevalence rates varied across the provinces, with KwaZulu-Natal having 29 %. This rate included all the children in the province, and it could have been much higher, similar to the rate found in this study, should only the poorest be considered. The increase in stunting between the two rounds is almost double, and while this sharp increase could be due to a measurement error, Remans et al.(Reference Remans, Pronyk and Fanzo47) suggest that stunting may be sensitive to short changes in time due to the multitude of key drivers and factors influencing nutritional status. Although the study by Remans et al.(Reference Remans, Pronyk and Fanzo47) focused on improvements in stunting, a study conducted in Ethiopia found a 10 % increase in the prevalence of stunting within 6 months due to seasonal fluctuations(Reference Roba, O’Connor and Belachew48). The time period assessed by the Ethiopian study was shorter than that in iLembe and followed similar methods to measure child growth, yet found a significant increase. In order to fully assess changes in child stunting in iLembe, continuous measurement and a longitudinal analysis is required taking into consideration all relevant risk factors to determine the underlying causes.
The high levels of overweight or obesity, on the other hand, could indicate a ‘nutrition transition’, which is often characterised by the abandonment of traditional plant-based diets to those high in energy, fats and sugars(Reference Popkin49). South Africa is believed to be at the later stage of a nutritional transition with lower levels of physical activity in the population and a rise in the number of diet-related diseases(Reference Crush, Frayne and McLachlan50). However, there are high rates of both stunting and obesity, which could also indicate the experience of ‘hidden hunger’. This could be attributed to a micronutrient deficiency leading to stunting, but can also co-exist with adequate or overconsumption of foods high in fat or carbohydrates and, therefore, with obesity(Reference Von Grebmer, Saltzman and Birol51). According to Oxfam(52), poor households in South Africa have ‘bad access to good food and good access to bad food’ (p. 25) and are buying cheaper, less-nutritious food in order to stretch their money further(52). One of the negative impacts of the drought was an increase in the cost of food. While there are a number of factors influencing food prices and inflation, the reduction in agriculture and exports caused by the drought pushed food prices up(53). These effects often accumulate over time and could prolong(Reference Whilhite54), with costs tending to decrease only when the situation is back to normal. This explains why the child nutritional status was worse after the drought, rather than during the drought, particularly because many South Africans, both rural and urban, are reliant on store-bought food(Reference Altman, Hart and Jacobs55–Reference Crush, Frayne, Parnell and Pieterse57).
Research indicates that improved WASH access and practices could lead to positive nutritional and health outcomes, such as lower prevalence of stunting(Reference Rah, Cronin and Badgaiyan58,Reference Dearden, Schott and Crookston59) , diarrhoea incidence and child mortality(Reference Heady and Palloni60). Climate change has the potential to hinder such improvements by limiting access to safe water and increasing the risk of waterborne illnesses(Reference Bahru, Bosch and Birner61). Based on the results of this study, it appears that those who mainly use pit latrines in comparison to flush toilets are not affected during a drought. Pit latrines are considered to be climate-resilient with better adaptive capacity during water shortages(Reference Howard and Bartram62). Due to water scarcity, households with flush toilets may have adapted their sanitation practices by reducing flushing or hand washing. It also appears that while sanitation was affected by the drought, water access was not. Although water supply was sometimes turned off, the majority of households still relied on municipal water and were able to access safe, clean water. Based on our findings, a drought could lead to poorer nutritional status through changes in sanitation and hygiene practices, and there is a need to ensure households do not neglect good hygiene when water supply is limited.
We hypothesised an association between increasing household food insecurity and child nutritional status. Despite an increase in underweight, wasted and overweight children living in households with a high or severe food insecurity, no evidence was found to suggest any association. There was, however, a negative association between child’s HAZ and a household’s CSI score, indicating that stunted children are more likely to live in food-insecure households. Humphries et al.(Reference Humphries, Dearden and Crookston10) described three different patterns of food insecurity, namely a single acute episode, intermittent or chronic. Prolonged and delayed effects of the drought pushed some households deeper into food insecurity – potentially from single or intermittent episodes to chronic. Stunting is an outcome of long-term limited food intake, a presentation of chronic undernutrition. Prior to the drought in 2014, the prevalence rate in iLembe was 21·1 %(Reference Dukhi, Sartorius and Taylor36), only 1·5 % lower than the rate reported in 2016. During the drought, the prevalence of stunting increased by a small amount, but the rate significantly increased to 39·9 % only after the drought had ended when food insecurity was more severe for some participants. This highlights the strong relationship between chronic food insecurity and chronic undernutrition as discussed by Humphries et al.(Reference Humphries, Dearden and Crookston10), and may explain why the association found was after the drought and only for stunting. Alternatively, Hendriks et al.(Reference Hendriks, Van der Merwe and Ngidi63) explained how different food insecurity measures can provide different results. For example, the CSI shows the frequency and severity of food deprivation, but does not consider the quality of a diet(Reference Hendriks, Van der Merwe and Ngidi63). A 24-h food recall, on the other hand, records food intake, but does not allow for how long a consumption pattern lasts. Had a 24-h food recall been used, different associations may have been apparent, such as wasting that is often related to a sudden food limitation rather than a long-term deprivation(Reference Battersby, Haysom, Battersby and Watson64).
While the study found an association between stunting and food insecurity in both rural and urban households after the drought, the association was stronger for those in urban areas. This suggests that children in urban areas were more likely to be chronically malnourished compared to their rural counterparts. There was also a difference in the association between child stunting and the frequency by which households carried out certain coping strategies depending on their location. For example, rural households that frequently borrowed food, bought it on credit or hunted for food were more likely to have a stunted child, whereas in urban households, not only did the strategies associated with stunting differ, but also the number of associations was much higher. The strongest association was found for sending children elsewhere to eat, a strategy considered as a last resort by iLembe residents. Restricting food to others so children could eat, also considered as a last resort, also had a strong association with stunting in urban households. Previously, poverty and food insecurity were thought to be mainly situated within rural areas, with urban households thought to have better social and wealth indicators(Reference Fotso, Madise and Baschieri6). However, as a result of urbanisation, migration and an increase in the number of urban slums, the urban advantage has since diminished(Reference Fotso, Madise and Baschieri6). It has been shown that households within the African urban context purchase the majority of their food, speaking to the problem of food access rather than availability(Reference Crush, Frayne, Parnell and Pieterse57). After the drought, within the same study area, there was an increase in households that relied on a supermarket compared with locally sourced items from a farm or their own garden (unpublished results). At the same time, the cost of food had increased, and rural households were less likely to be food-insecure compared to their urban counterparts (unpublished results). Rural households often rely on coping strategies that make use of the natural environment, subsequently cushioning the effects of food or income shocks(Reference Temple and Steyn65). Populations in urban areas often do not have such resources, as evident in this study in terms of the coping strategies they use, mainly restrictive or rationing. Battersby and Haysom(Reference Peyton, Moseley and Battersby66) argued that when assessing urban food security, it is important to consider a number of household-scale challenges such as the high costs of energy and water. They explain that these costs increase the cost of food preparation of traditional foods that take a long time to cook, and urban households will therefore consume more processed and energy-dense foods that take less time to cook. Energy-dense foods with low nutritional value are often more accessible and available, with a change in diet to healthier foods expected to cause a significant increase in food costs(Reference Battersby and McLachlan67). In addition, supermarkets in South Africa are more situated in wealthy regions, creating further access limitations and additional transport costs to the poorest urban households(Reference Motbainor, Worku and Kumie68,Reference Garrett and Ruel69) . These factors may contribute to the high rates of food insecurity, but also the link between stunting and food insecurity in urban households with children potentially consuming foods high in energy but poor nutritional value. That said, there are still strong associations between stunting and strategies that relied on natural resources in urban households. It appeared that urban households were carrying out unfamiliar coping mechanisms, which highlights the magnitude of the problem they were faced with. Despite the problems of child stunting, lower incomes(Reference Westaway70) and higher food prices(Reference Temple and Steyn65,Reference Pollard, Landrigan and Ellies71) , it appeared that rural households were better able to offset the effects of the drought. Policymakers should, therefore, consider the different ways in which households are affected – damaged or lower crop yields in rural households, and higher food prices for urban households – and consider policies or interventions that will provide the highest impact for both food and nutrition security.
Recommendations
During a drought or other climatic event, short-term interventions such as food aid would be beneficial to minimise the impact not only on household food insecurity but also on child nutritional status. Long-term interventions to improve food insecurity may also have a high impact and could include community food gardens or seed programmes that encourage people to grow their own food. However, the location and appropriateness should be considered prior to implementation, and households should be educated on food storage and adaptive practices to limit the impact of climate and seasonality. In addition to the child support grant, policymakers could consider food vouchers for specific products targeted towards young children, for example, vouchers for baby formula or fresh fruit and vegetables. Implementing specific product vouchers would ensure that a child or household would have access to food, but also might reduce the possibility of the vouchers being used on other non-food products.
Future research in South Africa needs to assess the contributing factors to child stunting and overweight, including dietary diversity, types of food eaten, individual activity levels and hidden hunger. In addition, there is a need to conduct a longitudinal analysis to further assess the relationship between food security and child nutritional status while considering the impact of climatic or environmental events. The tools used to measure food insecurity should also be carefully considered and should include a variety of indicators measuring food availability, access and utilisation.
Study limitations
The study had a number of limitations, including the sampling strategy that varied between the two rounds of data collection in terms of the number of households selected from each ward. To rectify this, the results from round 1 were weighted to match the sample sizes from round 2. Secondly, anthropometrics used were prone to measurement bias and human error, potentially creating miscalculations on nutritional status. The tools used were standardised and the data collectors were given rigorous training. Each measurement was repeated to improve accuracy. It is also acknowledged by the researchers that biomedical assessments coupled with anthropometric measures could more accurately determine nutritional status. However, child growth is internationally recognised as an important indicator of nutritional status and health(Reference Gorstein and Akŕe72,73) and, therefore, the results provided are still an useful indicator of the problem being faced in the district of iLembe. Thirdly, the study design used repeated cross-sectional surveys, which only provided a snapshot of the situation at the time of data collection. However, the information generated allowed for a comparison during and after the drought and could act as the starting point for a longitudinal analysis. Finally, food insecurity was measured at household level rather than child level based on the available data. The impact of food insecurity on people may vary due to their individual characteristics. Such characteristics were taken into consideration during multiple regression analyses, and the results generated still provide a good insight into the association between the two variables.
Conclusions
Child nutritional status significantly changed between the two rounds for all forms of malnutrition, including overweight and obesity, with the most significant increases being for stunting and obesity. The high levels of stunting and obesity could be attributed to hidden hunger made worse by limited food access following an increase in food prices due to the drought. The proportion of undernourished or overweight children living in high or severe food-insecure households also increased; however, the results only indicated an association between food insecurity and stunting after the drought. The experience of food insecurity for some households was more severe after the drought, which suggests that as food insecurity progressed from intermittent to chronic, the association with child stunting became stronger. The results also suggest that urban households were experiencing more severe food shortages due to the drought, and as a result, urban children were more likely to be stunted than their rural counterparts. Interventions to improve household food security may be useful to reduce poor nutritional status in young children. Policymakers should also consider that rural and urban households are coping differently and should implement interventions that are location-specific to achieve the highest impact. Although the study cannot conclude that the drought was the cause of poor nutritional status, based on a comparative analysis, drought did appear to be a contributing factor by impacting household food security. Future research should carry out longitudinal studies to further assess the relationship between household food insecurity and child nutritional status, taking into consideration climatic and environmental events that may occur.
Acknowledgements
Acknowledgements: The researchers would like to thank the participants of this study. We would also like to thank the iLembe district municipality and the respective sub-district municipalities for allowing the research to take place. Financial support: This research received no specific grant from any funding agency, commercial or not-for-profit sectors. Conflict of interest: None. Authorship: R.E.D., U.B. and M.M. equally conceptualised the study. Data collection and primary analysis were conducted by R.E.D. with contribution from M.M. and U.B. The article was written by R.E.D. All co-authors provided comments and critical feedback on the drafts, and approved the final manuscript for submission. Ethics of human subject participation: This study was conducted according to the guidelines laid down in the Declaration of Helsinki, and all procedures involving study participants were approved by the University of KwaZulu-Natal Humanities and Social Sciences Research Committee. Written informed consent was obtained from all subjects.


