


Fe deficiency, with or without anaemia, is prevalent in infants, young children and women of childbearing age worldwide. Interventions involving dietary modification and diversification, Fe-fortified foods, or Fe supplementation, are often recommended to improve the Fe status of these at-risk groups. Women of childbearing age are especially at risk because pregnancy entails a high demand for Fe(1).
In most countries, the risk of inadequate intakes of Zn is likely to be comparable with that of Fe because Zn and Fe have a similar distribution in the food supply and are affected by many of the same dietary absorption modifiers(Reference Prasad2, Reference Hunt3). Indeed, low Fe stores have been a risk factor for suboptimal Zn status in several studies(Reference Prasad, Miale and Farid4–Reference Yokoi, Sandstead and Egger7).
Dietary interventions designed to enhance the Fe status of omnivorous women will include advice to increase intakes of flesh foods and enhancers of non-haem Fe absorption, and decrease intakes of inhibitors of non-haem Fe absorption(Reference Hunt8). Flesh foods are rich sources of both readily available Fe and Zn; and phytate, found in unrefined cereals and legumes, is a potent inhibitor of both Fe and Zn absorption(Reference Lönnerdal9). Hence, if these dietary strategies are adopted, improvements in Zn as well as Fe status may be achieved. In contrast, Fe supplementation may have an adverse effect on Zn nutriture as a result of competition for a common absorptive pathway between Zn and non-haem Fe(Reference Kordas and Stoltzfus10). Studies examining this relationship, however, have shown mixed results(Reference Allen and Shrimpton11–Reference Fischer Walker, Kordas and Stoltzfus12).
Zn is essential for optimal health and pregnancy outcome(Reference King13) and hence is as important as Fe for women of childbearing age. Women who have been advised to take Fe supplements may also be at risk of Zn deficiency, making it essential to ensure that any treatment regimen for Fe does not cause or exacerbate a pre-existing Zn deficiency state.
The objectives of the present study were, first, to investigate the effect of a dietary intervention, designed to enhance both the intake and bioavailability of Fe over 16 weeks, on dietary and laboratory indices of the Zn status of young adult women with mild Fe deficiency from Dunedin, New Zealand, and, second, to examine whether a moderate-dose Fe supplement taken daily with meals has an adverse effect on their Zn status. Mild Fe deficiency was defined as serum ferritin < 20 μg/l and Hb ≥ 120 g/l. Zn status was evaluated using dietary indices, serum and hair Zn concentrations, serum alkaline phosphatase (ALP) activity (a Zn-dependent enzyme) and taste detection thresholds(Reference Gibson14, Reference Lowe, Fekete and Decsi15). Details of the efficacy of the interventions on the primary outcome (i.e. serum ferritin) in this randomised controlled trial have been published earlier(Reference Heath, Skeaff and O'Brien16).
Subjects and methods
Details of the participants and study design
Briefly, eighty-eight women aged 18–40 years with low Fe stores were recruited (March 1997 to April 1998) for the study from the greater Dunedin area, New Zealand, via newspaper advertisements, brochures and posters. Of these women, fifty had previously participated in a cross-sectional study(Reference Heath, Skeaff and Williams17, Reference Gibson, Heath and Limbaga18). Inclusion criteria were presence of mild Fe deficiency (serum ferritin < 20 μg/l and Hb ≥ 120 g/l in the absence of infection), and consumption of a non-vegan Western-style diet. Exclusion criteria included anaemia, pregnancy or lactation, and health problems (for example, eating disorders) or medication(Reference Thomas19) likely to influence biochemical Fe and Zn status. Participants were instructed to avoid: donating blood; changing their normal exercise levels; or taking dietary supplements containing Fe (except as supplied), Zn, vitamin C or Ca during the study period. Adherence to the exclusion criteria was monitored via an interviewer-administered questionnaire at the monthly appointments.
Participants were randomised to groups balanced by block stratification for serum ferritin ( < 12 μg/l or 12–19 μg/l); amount of menstrual blood loss as described earlier(Reference Heath, Skeaff and Williams17, Reference Heath, Skeaff and Gibson20); and whether vegetarian or not. Each treatment group was (by dice) assigned a number which was concealed in envelopes and placed in blocks of three in randomly ordered boxes, one for each stratum. The research dietitian allocated the next envelope in the appropriate box to incoming participants, and was subsequently unblinded to the treatment designation. Blinding of all the other research staff was maintained until completion of the study. The trial profile detailing the numbers of participants recruited, then randomised, and withdrawals or exclusions from each experimental group, is given in Fig. 1.

Fig. 1 Recruitment, withdrawals, exclusions and intervention group numbers. CS, cross-sectional phase of Women's Iron Study(Reference Heath, Skeaff and Williams17, Reference Gibson, Heath and Limbaga18). * There was one withdrawal from the diet group. There were four withdrawals from the placebo group and three from the supplement group. There were three exclusions from the diet group (two due to anaemia before the start of the intervention and one due to anaemia during the intervention), two from the placebo group (one due to anaemia before the start of the intervention and one due to anaemia during the intervention) and one from the supplement group (due to anaemia before the start of the intervention).
Participants in the supplement group (SG; n 23) and placebo group (PG; n 26) received a daily tablet (Fe supplement or placebo, respectively) packaged in blister packs. The Fe supplement provided 50 mg elemental Fe in the form of an amino acid chelate (bis-glycino Fe II: ‘FerroChel’; Albion Laboratories Inc., Clearfield, UT, USA). The placebo tablets, of maltodextrin, were identical in appearance (dark-green opaque gel capsules) and packaging, and provided by the same company. Participants in the diet group (DG; n 29) received placebo tablets and individual advice from the dietitian based on a set of Fe-based dietary strategies given at baseline, and at weeks 2 and 6, with telephone check-ups at weeks 10 and 14(Reference Heath, Skeaff and O'Brien16). Each DG participant was also given a cast-iron frying pan(Reference Prinsen Geerligs, Brabin and Omari21), vitamin C-rich fruit juices (Frucor Beverages Ltd, Manukau City, New Zealand) and syrups (Barker's Fruit, Geraldine, New Zealand) to be consumed with meals, and recipe books and leaflets (New Zealand Pork, Wellington, New Zealand; Beef & Lamb Marketing Bureau, Auckland, New Zealand). All participants were instructed to take one tablet per d with a meal. Possible side effects were fully discussed and recorded daily by the participants on calendars, as were any other concerns that could have had a negative effect on adherence. Adherence to the tablets was assessed by both the calendar records and tablet counts, and to the dietary strategies by counselling sessions and telephone check-ups, with more formal assessments via a previously validated semi-quantitative FFQ (SFFQ)(Reference Heath, Skeaff and Gibson22). Of the tablets supplied, 97 % were taken by the SG, with compliance in the PG and DG at 94 and 95 %, respectively.
At baseline, sociodemographic, general health and wellbeing data were collected via self-administered questionnaires, and participants were assisted to complete the computerised SFFQ. Selected anthropometric measures were taken(Reference Heath, Skeaff and O'Brien16) together with scalp hair samples and fasting venepuncture blood samples using the International Zinc Nutrition Consultative Group (IZiNCG) procedures(23). The SFFQ was administered again at 4, 8 and 15 weeks, and biochemical assays and anthropometry again at 4, 8, 12 and 16 weeks. Scalp hair samples and taste detection thresholds were taken at baseline and at the end of the intervention. Nutrient intakes from the three SFFQ were averaged for an estimate of intervention intake, and changes from the baseline SFFQ intakes were calculated.
The present study was conducted according to the guidelines laid down in the Declaration of Helsinki and all procedures involving human subjects were approved by the Southern Regional Health Authority Ethics Committee (Otago, New Zealand). Written informed consent was obtained from all participants.
Laboratory methods
Each participant's serum samples were analysed in one batch, with samples of pooled and/or reference material interspersed at approximately 10 % frequency. Serum Zn analysis was performed by flame atomic absorption spectrophotometry (AAS) using a modification of the method of Smith et al. (Reference Smith, Butronovitz and Purdy24). The percentage cv for Zn analyses from pooled serum samples was 6·1 % (mean value 12·6 μmol/l; n 21). A certified reference material (CRM A-13, freeze-dried bovine blood; Analytical Quality Control Services, International Atomic Energy Agency, Vienna, Austria) and a reference human serum (normal range, U2A/product no. 66 816; Utak Laboratories Inc., Valencia, CA, USA) were also analysed to assess the accuracy of the method. On a dry-weight basis, CRM A-13 produced a mean of 2·05 (sem 0·02) μmol/g (CV 4·6 %; n 23) compared with the certified value of 1·99 (95 % CI 1·84, 2·14) μmol/g. The reference human serum yielded a mean of 15·3 (sem 0·15) μmol/l (CV 4·9 %; n 21) compared with the assigned value of 13·8 (range 10·7–16·8) μmol/l.
Scalp hair samples (approximately 100 mg) were washed using non-ionic detergent by a modification of the method of Harrison et al. (Reference Harrison, Yursachek and Benson25), now one of the standard methods recommended by the International Zinc Nutrition Consultative Group (IZiNCG)(23), and then analysed by flame AAS following wet digestion of hair with 1·2 ml of ultra-pure HNO3 (700 g/l) (AristaR; BDH Laboratory Supplies, Palmerston North, New Zealand). Analyses of samples (n 48) of a powdered pooled-hair sample gave a cv of 2·7 % and mean of 3·40 (sem 0·013) μmol/g. Serial analyses (n 33) of a certified reference material (Community Bureau of Reference RM no. 397; Institute of Reference Materials and Measurements, Geel, Belgium) yielded a mean value of 3·05 (sem 0·018) μmol/g (CV 3·4 %) compared with the certified value of 3·04 (sem 0·08) μmol/g (i.e. 199 (sem 5) μg/g). Serum ALP was analysed on a Cobas-Mira Plus (Roche Diagnostics, Hoffmann-La Roche Ltd, Basel, Switzerland). Precision was assessed by replicate analyses of pooled serum (mean 49·9 (sem 0·31) U/l; CV 3·5 %; n 31) and accuracy by analyses of certified reference materials in both a high (PrecipathU: mean 211 (sem 0·61) U/l; CV 1·6 %; n 30; manufacturer's target value 212 (sem 13) U/l) and normal range (PrecinormU: mean 70·8 (sem 0·55) U/l; cv 4·3 %; n 31; target value 68·4 (sem 4·1) U/l). Hb, packed cell volume, serum C-reactive protein (CRP), ferritin and transferrin receptor were also analysed, as described elsewhere(Reference Heath, Skeaff and O'Brien16).
Taste detection thresholds for ‘electrogustometric’ taste were measured at baseline and post-intervention by the same researcher using an electrogustometer (EGM; Campus Electronics, University of Otago, Dunedin, New Zealand). The electrogustometer was adapted from the design of Grant et al. (Reference Grant, Ferguson and Strang26) to permit measurement of threshold values as low as 1 μA. A threshold level was determined by alternately lowering and raising the current to determine the smallest stimulus that could be correctly discriminated with at least 75 % accuracy. The technical error of measurement (TEM) based on electrogustometry assessments, repeated 3 d apart at the same time each morning on nine women aged 22–35 years, was 0·54 μA (relative TEM 27 %).
Statistical analysis
Normality of distribution of values was assessed by the Kolmogorov–Smirnov and Shapiro–Wilk statistics, and, where there was inconsistency between these two, also by visual inspection of histograms with reference to measures of skew and kurtosis. Logarithmic transformations were used where appropriate to normalise data. Homogeneity of variance was ascertained for all statistical procedures using Levene's test.
Means (and 95 % CI) are reported for normally distributed data; for non-normally distributed data, medians (with interquartile range) or geometric means (for log-normal data) are reported, unless otherwise indicated. Treatment effects relative to placebo were estimated as changes across the five monthly measures for serum Zn and ALP, after adjustment for potential confounders, using generalised estimating equation (GEE) analysis. For the dietary intakes, hair Zn concentrations and taste acuity assessments, post-intervention values were adjusted for baseline values and compared by ANCOVA (unless otherwise indicated). Pairwise comparisons were conducted between groups using Bonferroni adjustment for multiple comparisons(Reference Field27). At least three time points are required for GEE analysis, so this could only be conducted for serum Zn and ALP. Inter-relationships between indices were examined with Pearson's (r) or Spearman's rank (ρ) correlation coefficients. All probability values are for two-tailed tests with P < 0·05 considered significant. Statistical procedures were carried out using SPSS version 11.0 (SPSS Inc., Chicago, IL, USA; http://www.spss.com), except for the GEE population-averaged procedures, which used STATA 10.0 (StataCorp LP, College Station, TX, USA; http://www.stata.com).
Results
Baseline sociodemographic and health characteristics
Table 1 displays baseline demographic and other characteristics for the three groups. Recruitment took place over a 14-month period (with no difference between intervention groups; Kruskal–Wallis χ2(2) = 0·71; P = 0·7); fifty-one participants (80 %) commenced the intervention between April and August inclusive (i.e. autumn/winter), with completion from late winter until early summer.
Table 1 Baseline demographic and other characteristics of participants in each intervention group
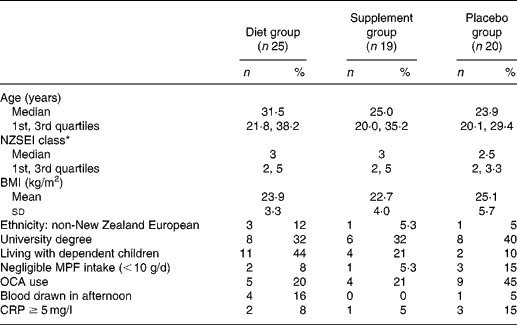
MPF, meat, poultry and fish; OCA, oral contraceptive agent; CRP, C-reactive protein.
* New Zealand Socio-economic Index of Occupational Status(Reference Davis, McLeod and Ransom38), classes 1 to 6 (1 representing the highest category), calculated as highest of self or partner, otherwise highest parent.
Dietary intakes
At baseline, there were no significant differences in the dietary intakes (median; 1st, 3rd quartiles), or the prevalence of Zn intakes below the estimated average requirement (6·5 mg/d)(28) among the three groups (Table 2). One-quarter of all participants had diets with phytate:Zn molar ratios ≥ 15. Table 3 details the dietary changes for the three groups from baseline values. In the DG, significant increases (analysis of covariance pairwise comparisons, with Bonferroni adjustment, P < 0·05) in intakes of meat, poultry and fish, and vitamin C, and significant decreases (P < 0·05) in intakes of phytate and phytate:Zn molar ratio occurred from baseline values in comparison with the changes in intakes observed in the PG and in the SG.
Table 2 Intakes of selected dietary variables by intervention group at baseline*
(Medians and 1st and 3rd quartiles)
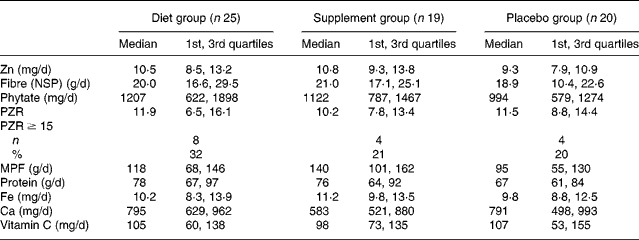
PZR, phytate:Zn molar ratio; MPF, meat, poultry and fish.
* Dietary energy not reported, as the semi-quantitative FFQ was not designed or validated for energy intake.
Table 3 Change in dietary intakes of selected nutrients during the intervention for each group and between-groups comparison
(Medians and 1st and 3rd quartiles)
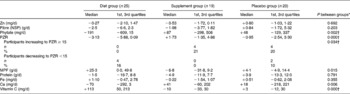
PZR, phytate:Zn molar ratio; MPF, meat, poultry and fish.
* Significance of analysis of covariance on the intervention intakes with baseline value as covariate.
† Error variances not equal (Levene's test; P < 0·05).
Laboratory assessment
Highly significant correlations (P < 0·0001) were noted for individual participants at each time period for serum Zn concentrations and for ALP activities. Pearson correlation coefficients ranged from r 0·86 to r 0·92 for serum Zn (mean intra-individual cv 3·0 %), and r 0·87 to r 0·94 for log-transformed ALP (mean cv 9·5 %).
Mean serum Zn and ALP values with their standard errors for the three groups at each time point are shown in Fig. 2. Note that the mean baseline serum Zn value for the SG was noticeably higher – a trend that continued throughout all the monthly assessments for the SG. Nevertheless, the difference in baseline serum Zn among the three groups was not significant (P = 0·116) after adjustment for potential confounders (elevated CRP, oral contraceptive agent (OCA) use, afternoon blood sample and age). Baseline serum ALP activity did not differ significantly (P = 0·589) between groups. Results of the GEE analysis (Table 4) indicate that adjusted serum Zn values increased in the DG (adjusted, P = 0·002); however, almost the same rise occurred in the PG, and the difference between the two groups was not significant. In contrast, a small decrease in adjusted serum Zn concentrations in the SG was significant when compared with the PG (P = 0·022). Similarly, adjusted serum ALP activity also tended to decline in the SG, with the change relative to the PG just showing statistical significance (P = 0·042). There was a non-significant increase in adjusted ALP activity in both the PG and DG, and the difference between these was not significant (Table 4).
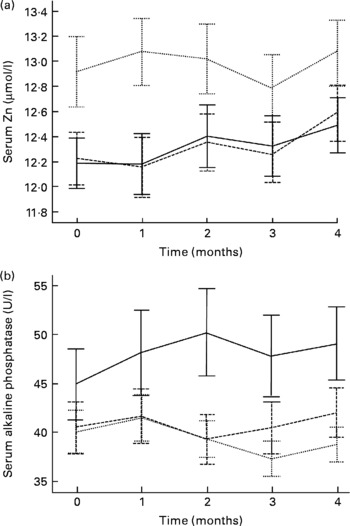
Fig. 2 Serum Zn (a) and alkaline phosphatase (b) values (not adjusted for confounders) for the three intervention groups, at baseline (time 0) and each month during the intervention. (- - -), Diet group; (···), supplement group; (—), placebo group. Values are means, with standard errors represented by vertical bars.
Table 4 Generalised estimating equation (GEE)* analysis of changes in serum zinc concentration and serum alkaline phosphatase (ALP) activity across the five monthly measures, for each intervention group, adjusted for confounders†
(Coefficients of slope and 95 % confidence intervals)
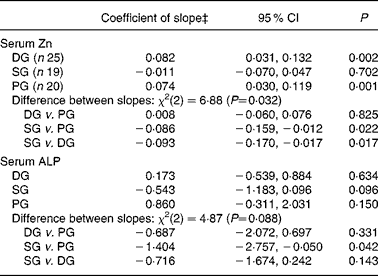
DG, diet group; PG, placebo group; SG, supplement group.
* Population-averaged model; Wald statistic for model: serum Zn χ2(9) = 29·9 (P < 0·001); serum ALP χ2(7) = 21·4 (P = 0·003).
† Potential confounders entered as covariates: for serum Zn, C-reactive protein ≥ 5 mg/l, oral contraceptive use, blood sample drawn after noon (fasting status unknown), age; for serum ALP, oral contraceptive use, age.
‡ Value of coefficient of slope represents: change in serum Zn (μmol/l) per month; change in serum ALP (U/l) per month.
Hair Zn values were not significantly affected by concurrent infection (CRP>5 mg/l) or OCA use at baseline or post-intervention. Concentrations tended to be higher post-intervention in all three groups compared with baseline, with a correlation of r 0·71 (P < 0·0001), but no significant inter-group differences existed (Table 5).
Table 5 Hair zinc concentrations (μmol/g) at baseline and post-intervention, change during the intervention, and comparisons between groups
(Mean unadjusted values and 95 % confidence intervals)
* Data included for participants providing both hair samples. One participant's values (supplement group) excluded due to analytical error.
† Significance of between-groups ANOVA.
‡ Significance of analysis of covariance on intervention values with baseline as covariate.
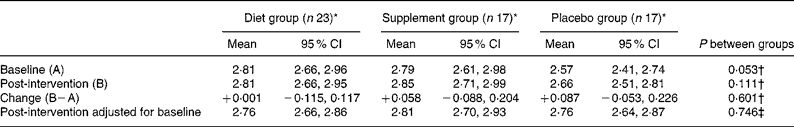
The median electrogustometric taste detection threshold values for each of the intervention groups at both baseline and post-intervention were identical (3 μA), with only small differences in the quartiles. No group showed a significant change between baseline and post-intervention, and no inter-group differences were apparent (all P>0·6).
Inter-relationships among dietary and laboratory indices of zinc status
There were no consistent significant correlations between the dietary variables and any of the laboratory indices, when expressed either as baseline or intervention values, or as change in both parameters during the intervention. The change in taste thresholds was negatively correlated with change in hair Zn concentrations (ρ − 0·34; P = 0·011), whereas correlations between serum and hair Zn concentrations at start and post-intervention were positive (P < 0·0001). Serum Zn and log-ALP at the five sample times, excluding those with infection and OCA users, also tended to be weakly and positively correlated. The relationship between hair Zn values and ALP was less consistent.
Serum Zn concentration correlated positively with log-transformed serum ferritin at baseline (r 0·32; P = 0·035; n 44) and post-intervention (r 0·43; P = 0·005; n 41) (excluding potential confounders, i.e. OCA users and those with CRP ≥ 5 mg/l). Analysis by intervention group indicated some differences with the highest correlation being found post-intervention in the SG (r 0·59; P = 0·046; n 12). Positive correlations were also evident between serum ferritin and hair Zn concentrations, although only significant for the final hair samples when subjects with elevated CRP and OCA users were excluded (r 0·36; P = 0·022; n 40). There were no consistent relationships of serum ferritin with ALP values, nor with taste thresholds.
Discussion
The present study suggests that a dietary intervention that improves Fe status(Reference Heath, Skeaff and O'Brien16) does not necessarily increase indices of Zn status. Indeed, serum Zn values rose significantly in both the DG and PG by the end of the study, a trend that was not observed in the SG. Instead, the small decrease in serum Zn concentrations in the SG, significant when compared with the PG (P = 0·022), suggests that a daily Fe supplement of 50 mg/d taken with meals may compromise Zn status in women who are mildly Fe deficient. Interestingly, serum ALP activity also tended to decrease in the SG, a trend that was significant when compared with the PG (P = 0·042).
Our failure to observe a positive effect of the dietary intervention on Zn nutriture in these women is probably associated with several factors. For instance, the dietary intervention did not increase dietary Zn intake, although the increase in intakes of meat, poultry and fish (25 g per d) and decrease in the phytate:Zn molar ratio (by 3 units) may have improved Zn bioavailability(Reference Lönnerdal9), unless counteracted by a possible inhibitory effect of contaminant Fe from the cast-iron cookware(Reference Kordas and Stoltzfus10). Lack of sensitivity of the laboratory indices of Zn status employed may also be implicated, especially because only 6 % (n 4) of the participants had baseline serum Zn concentrations said to be indicative of Zn deficiency(23). Finally, our dietary intervention (i.e. 16 weeks) may have been too short to produce a detectable difference in serum Zn concentrations.
It is possible that the Fe supplement may have adversely affected either the absorption or metabolism of Zn as noted earlier, even though the dose (50 mg) given was much less than that often prescribed to pregnant or anaemic women. Some intervention studies have reported an adverse effect of Fe supplements on Zn status in children(Reference Smuts, Lombard and Benadé29), although a recent review concluded that even if there is a negative effect, it is small(Reference Fischer Walker, Kordas and Stoltzfus12). These inconsistencies have led to the suggestion that both the Fe:Zn ratio ( ≥ 2:1) and the total amount of ionic species (>25 mg) could determine whether a measurable effect on human Zn nutriture occurs(Reference Solomons30, Reference Solomons and Ruz31). In the present study, few participants had dietary ratios of Fe:Zn ≥ 2:1, but one-quarter had intakes of Zn and Fe combined greater than 25 mg. Clearly, with the addition of the Fe supplement, both the ratio and the total ionic species exceeded these values for the SG participants. Some data suggest that such an effect might only occur when supplements are taken with water rather than with food(Reference Lönnerdal9, 23) because the dietary ligands released during digestion of food chelate the Fe and Zn and assist in their absorption. Interestingly, in the present study, participants were instructed to take their supplement (or placebo) with meals. We recognise that monitoring compliance to such a protocol is difficult. However, because our participants were strongly motivated, judging by their high level of adherence to the tablets, they were probably likely to conform to our study protocols.
The tendency for the serum Zn values to increase in our PG cannot easily be explained, and, to our knowledge, has not been reported previously. Studies investigating intra-variability in serum or plasma Zn concentrations have reported CV(Reference Fraser32, Reference Lux and Naidoo33) without noting whether any time trends were apparent. The small dietary changes observed in the PG were unlikely to have such a significant effect on serum Zn values, and there is no evidence that the placebo tablet (maltodextrin) affects Zn absorption. Further, given that the Fe indices in the PG, unlike serum Zn, did not exhibit any time trends(Reference Heath, Skeaff and O'Brien16), the rise in serum Zn concentrations in the PG was probably not associated with the exclusion or withdrawal of participants from the study. The increasing values were also unlikely to be associated with length of time over which the serum samples were frozen because Zn is stable in frozen serum for prolonged periods(23). Likewise, seasonal variation in serum Zn concentration was probably not a contributing factor because this trend has not been reported in adults and was not evident in our data.
We adjusted the serum Zn concentrations statistically in all groups including the PG to account for the impact of currently accepted confounders of serum Zn such as OCA use and acute infection or inflammation(23). It is possible, however, that as the participants became more familiar with the study procedures and personnel, they may have experienced a progressive decrease in anxiety and stress levels at the blood test. This might perhaps have resulted in a corresponding increase in the serum Zn values of the participants. A meta-analysis of studies investigating effects of acute mental stress tasks (in human subjects) on induction of IL-6 in serum or plasma has shown an overall effect(Reference Steptoe, Hamer and Chida34). Animal studies have indicated that hepatic IL-6 is linked to hypozincaemia(Reference Liuzzi, Lichten and Rivera35).
It is noteworthy that neither hair Zn nor taste acuity in the SG followed the same decreasing trend as the serum Zn and ALP values. Moreover, only a weak association between taste acuity and serum or hair Zn concentrations was noted here.
Failure to find associations between dietary and biochemical indices for Zn is not unexpected, especially in view of the inconsistent relationships noted by earlier investigators(Reference Gibson14). Moreover, our SFFQ was more appropriate for use in assessing change in dietary Zn intake (repeatability: ρ 0·67), rather than as an absolute quantitative measure (validity against 11 d weighed diet record: ρ 0·42; A-LM Heath, unpublished results). Our correlations between successive sets of data for serum and hair Zn and ALP were substantially higher than literature reports on intra-variability(Reference Fraser32, Reference Lux and Naidoo33), and may account for the stronger inter-relationships amongst biochemical Zn indices in our dataset than have been reported previously.
Use of the GEE population-averaged procedure(Reference Liang and Zeger36, Reference Ziegler, Kastner and Blettner37) in the present study permitted a more robust assessment of the effects of the intervention on serum Zn and ALP. These indices have high day-to-day within-subject variability, which is a particular concern in a study with a relatively small number of subjects. By using GEE we were able to minimise these effects by analysing multiple time points for each individual. An additional advantage of GEE is that it is relatively unaffected by randomly missing values(Reference Ziegler, Kastner and Blettner37). Nevertheless, because the present study was powered to detect changes in the Fe indices(Reference Heath, Skeaff and O'Brien16) and not Zn, our sample size may have been too small, contributing to the null findings (i.e. no difference in Zn status between the DG and PG). Further, although the research assistants performing the outcome measurements were unaware of the group allocations, our dietary intervention group could not be blinded to their treatment assignment. Hence, we cannot exclude the possibility that the changes in Zn status for the DG were linked with changes in dietary intakes that arose in response to participation, rather than the intervention per se.
Finally, because our study participants were self-selected, with the presence of mild Fe deficiency as an inclusion criterion, we cannot extrapolate our findings to all young women of childbearing age in New Zealand. It is plausible that women with mild Fe deficiency will respond differently to Fe supplementation compared with those with adequate Fe status or those with Fe-deficiency anaemia.
In summary, the present results did not show a positive role for the Fe-based dietary intervention in improving laboratory indices of Zn status in the premenopausal women studied here. In contrast, we found a significant adverse impact of supplemental Fe on serum Zn concentrations, despite our use of a low dose of supplemental Fe (50 mg), and the advice to take it with meals to reduce any negative effect. Whether the level of reduction in serum Zn concentration in the present study was associated with any adverse functional consequences is uncertain.
Acknowledgements
The authors gratefully acknowledge the contribution of the women participating in this research. The authors also thank: Sue O'Brien, research dietitian; Rebecca Meikle, research nurse; Margaret Waldron, research nurse; the research assistants; Steve Tiszavari, Karl Bailey and Michelle Harper for laboratory expertise.
A part of the study was supported by a Laurenson Award. The study was funded by the Health Research Council, New Zealand.
The authors' responsibilities were as follows: N. R. P. collected hair samples and electrogustometry data, participated in other data collection and laboratory work, and performed statistical analyses (except GEE); A.-L. M. H. assisted with design and coordinated implementation of the study, and contributed to critical revision of the manuscript; S. M. W. conducted the GEE analysis and provided guidance on interpretation of other statistical analyses; R. S. G. designed and secured funding for the study; N. R. P. and R. S. G. participated in interpretation, and writing of the manuscript. N. R. P. had full access to all of the data and takes responsibility for its integrity and the accuracy of the data analysis.
None of the authors had any financial or personal conflicts of interest.


