


The National School Feeding Program (Programa Nacional de Alimentação Escolar (PNAE)) is one of the oldest and most established social initiatives for food and nutrition in Brazil, and is led by the federal government( Reference Santos, Santos and Santana 1 ). Considered a formidable example of social policies promoting food security, the programme was launched in the 1940s and gained legal status in 1955( Reference Chaves, Brito and Teixeira 2 ). The PNAE is currently recognized as one of the broadest school feeding initiatives in the world, covering 43 million Brazilian students of all social strata in primary education, or approximately 20·0 % of the Brazilian population( 3 ).
Over the past 60 years, the objectives and hallmarks of the programme have changed substantially. Although in the beginning the focus was centred on fighting malnutrition( Reference Turpin 4 ), the PNAE now aims to contribute to bio-psychosocial development, learning, overall school performance, the promotion of healthy eating habits through food and nutrition education, and the provision of school meals that meet the nutritional needs of children( Reference Brasil 5 ).
Likewise, legislation governing the programme has also evolved, allowing the PNAE to be utilized as a means for and mechanism of local development( Reference Brasil 5 ). Since its inception, the programme was geared indirectly towards support of local production( Reference Turpin 4 ) by adapting menus to regional production and culture. However, the political, social and economic contexts of the time led to the gradual inclusion of processed food products in school menus, compromising both the social and nutritional components of the programme in early decades. These food products were initially donated by international entities and were subsequently produced in Brazil from the 1970s onwards( Reference Santos, Santos and Santana 1 ).
Only four decades later, new legislation emphasized the need to include regionally grown items in school menus, culminating in the decentralization of the programme in 1994 and consequent reduction in the use of highly processed food products in school meals( Reference Santos, Santos and Santana 1 ). More recently, in 2009, Law 11.947/2009( Reference Brasil 5 ) stipulated support for local and sustainable development by highlighting the role of family farming. According to this regulation, a minimum of 30·0 % of federal programme funds must be invested in the acquisition of foods produced by family farming, preferentially regional suppliers. However, distinct nomenclature or stipulation of foodstuffs eligible for acquisition is not currently available( 6 ).
Rapid demographic, epidemiological and nutritional transition in Brazil over the last decades has resulted in marked increases in weight gain indices, obesity and non-communicable chronic diseases in all population groups. The nutritional profile of the Brazilian population is complex and school feeding has the potential to lead to significant changes in this scenario, especially since the eating habits developed in childhood and adolescence are likely to last into adulthood( Reference Triches and Schneider 7 , Reference Oliveira 8 ).
Given the scope and national remit of school feeding programmes, such initiatives can constitute important dimensions of both public health and local development( Reference Turpin 4 , Reference Triches and Schneider 9 ). Partnerships between the School Feeding Program and family farming can thus be considered a viable strategy to strengthen these initiatives, thereby qualifying the programme as a mechanism for local development and food security.
The objective of the present study was to evaluate the profile of PNAE food acquisitions according to the extent and purpose of food processing in three municipalities in southern Brazil during the implementation period of Law 11.947/2009( Reference Brasil 5 ).
Methods
A cross-sectional, descriptive study was undertaken in three municipalities in the state of Santa Catarina, southern Brazil, selected for proximity to the area of the university where the research was carried out. We used non-probabilistic sampling (a convenience sampling method) consisting of selecting elements that are accessible, available and convenient for studying the focal population(s). This sampling method offers agility and lower operational costs, making the research more feasible. For our research, the selected municipalities met the following criteria: they were located near the university (between 24 and 63 km (15 and 39 miles)) and the local authorities allowed data collection.
Annual data were gathered for the period between 2008 and 2010 to facilitate direct comparison of metrics from the year immediately prior to the adoption of Law 11.947/2009( Reference Brasil 5 ) and the year of its adoption.
Characterization of the municipalities surveyed
Research was conducted in three municipalities (hereafter referred to as ‘city A’, ‘city B’ and ‘city C’) in the mesoregion of western Santa Catarina state. The sample cities have primarily agricultural socio-economic profiles characterized by the predominance of small farms and family agriculture( 10 ).
City A has a population of 25 713 (81·5 % urban and 18·5 % rural), a Human Development Index (HDI) value of 0·809 and a city poverty index (Índice de Pobreza Municipal (IPM)) of 29·9 %( 11 ). There is a network of eighteen municipal schools in the city serving 2551 students enrolled in primary education( 12 ). The local economy is focused on agriculture and 95·0 % of the 1200 farms in the municipality are family-owned( 10 , Reference Dreon 13 ).
City B has 44 128 habitants (88·7 % urban and 11·3 % rural), an HDI of 0·815 and an IPM of 32·2 %( 11 ). In this city, twenty-seven schools serve 2346 students in primary education( 10 ). Once again, agriculture is the primary focus of the city economy, where 80·0 % of the 960 farms in the municipality are family-owned( 12 ).
City C has 10 661 habitants (72·4 % urban and 27·6 % rural), an HDI of 0·819 and an IPM of 32·3 %( 11 ). A total of ten primary schools serve 1254 students( 12 ). The city has 678 farming establishments, mostly family-owned (the exact proportion was not available at the time the study was concluded). The paper industry and agriculture are the main economic production activities in the city( 14 ).
Data collection and organization
Gathered data included the amounts (quantities and units), prices and types of suppliers (farmer or conventional/non-farmer) for food items purchased through the programme. This information was obtained directly from the Departments of Education and Agriculture for each municipality, which provided the reports of the municipal purchasing systems for school feeding during the research period. In total, 1529 purchases (i.e. programme acquisitions) were analysed.
Conversion of purchased foods into energy
Records of PNAE food acquisitions in the three municipalities were grouped into 136 food items. Initially, quantities of the same items purchased in the same county and year were summed. Since these acquisitions are used for school meals, total quantities were divided among 200 school days, providing average daily quantities for each food item. When appropriate, correction factors( 15 ) were applied to the average quantities to exclude the inedible fraction of each item. A cooking index was also applied to convert the weight of each food item into an estimated weight of consumption. This was necessary for 38·97 % of food items (fifty-three items), with correction factors being applied mainly to fruits, vegetables and meat cuts with bone, and the cooking index applied for cereals and beans, meats, roots and some vegetables.
Finally, the net average daily quantity of each food item was converted into energy (kilocalories; 1 kcal=4·184 kJ) using the Brazilian Official Food Composition Table (Tabela Brasileira de Composição de Alimentos (TACO))( 16 ). The US Department of Agriculture’s National Nutrient Database for Standard Reference( 17 ) was used for three (2·2 %) ultra-processed items not available in TACO.
Grouping of foodstuffs
Food items were classified according to the NOVA classification proposed by Monteiro et al.( Reference Monteiro, Cannon and Levy 18 ) based on the nature, extent and purpose of processing. This scheme divides foods into four groups: Group 1 (unprocessed or minimally processed); Group 2 (processed culinary ingredients); Group 3 (processed foods); and Group 4 (ultra-processed food and drink products).
Price deflation of food items acquired through the programme
Considering that the present study analysed food acquisitions over a period of three years, acquisition prices (in Brazilian reais) were deflated in July 2008 using the Consumer Price Index (IPC-A) of the Brazilian Institute of Geography and Statistics and then converted into US dollars. This procedure allows the evaluation of real changes (inflation-free) in prices over the study period.
Data analysis
Data organization and descriptive/exploratory analyses were conducted using the statistical software package Stata version 12.1. The proportion of total purchases represented by each food group was expressed as both a percentage of the total energy acquired and a percentage of total expenditure (cost). The average price of each food group ($US/1000 kcal) was also used to characterize food acquisition. Food prices were obtained by dividing total expenditure ($US) by the amount of energy provided (kcal) for each food item, and then multiplying this value by 1000. This was done to contextualize the prices in a nutritional perspective. This is important because it allows one to compare food prices on an isoenergetic basis( Reference Claro, Maia and Costa 19 ). We did not estimate prices for two food items with virtually no energy (1·5 %).
The participation of each food group and the participation of products from family farms in acquisitions (in terms of both energy and cost) were estimated separately for each year of the research period.
Results
Unprocessed or minimally processed items (Group 1) increased in contribution to total energy by almost 3 percentage points from 2008 to 2009, remaining at high levels (48·3 %) in 2010. This increase was based on increased acquisition of rice, beans, fruits, vegetables, roots/tubers and eggs. In Group 1, acquisition of flours and pasta reduced the most. The contribution of processed culinary ingredients (Group 2) decreased by 4 percentage points between 2008 and 2009, remaining stable afterwards. Together these groups were responsible for almost three-quarters of total energy acquired over the study period. Acquisitions of processed foods (Group 3) decreased by 1·5 percentage points over the study period, while ultra-processed products (Group 4) increased from 20·3 to 23·2 % between 2008 and 2010. This increase was due almost exclusively to the acquisition of crackers, biscuits and cookies in 2009, and to ready-to-eat meals or powdered products (such as dessert mix powders) in 2010. The representation of most processed food subgroups and ultra-processed products decreased, including breads, sweets, sauces and breakfast cereals (Table 1). It is noteworthy that in terms of energy, the combined food acquisitions in Groups 1 to 4 and their interrelationships are far from ideal. Analysis of only 2010, the first year of mandatory application of Law 11.947/2009( Reference Brasil 5 ), revealed no clear trends (Table 1).
Table 1 Relative participation (%) of food groups and subgroups in the total energy of PNAE acquisitions for the research period 2008–2010, National School Feeding Program (Programa Nacional de Alimentação Escolar (PNAE)), Santa Catarina, Brazil

The higher price of unprocessed or minimally processed items per unit of energy results in a disproportional contribution of this food group to total cost (much greater than the contribution to total energy), contrasting with the results for processed culinary ingredients. Due to the short time frame of the study, significant changes in food prices were not expected. However, trends in the relative contributions of food groups to total cost tended to agree with contributions to total energy (Table 2).
Table 2 Relative participation (%) of food groups and subgroups in the total expenditure (cost) of PNAE acquisitions as well as the average price of foodstuff per group and subgroup for the research period 2008–2010, National School Feeding Program (Programa Nacional de Alimentação Escolar (PNAE)), Santa Catarina, Brazil
* Average price for the period ($US/4184 kJ (1000 kcal)).
The proportion of purchases direct from family farms tended to increase over the study period, in terms of both energy and cost (Fig. 1). This situation represents a positive trend in the programme, as baskets acquired from family farms provide fresher foods than baskets acquired from conventional suppliers.
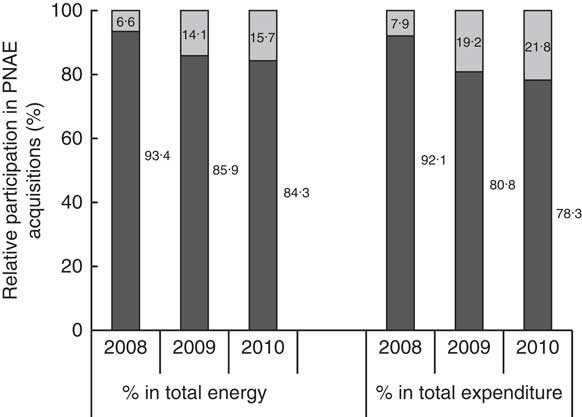
Fig. 1 Relative participation (%) of different suppliers (![]() , conventional suppliers;
, conventional suppliers; ![]() , family farms) in PNAE acquisitions in terms of annual energy and expenditure (cost) totals, National School Feeding Program (Programa Nacional de Alimentação Escolar (PNAE)), 2008–2010, Santa Catarina, Brazil
, family farms) in PNAE acquisitions in terms of annual energy and expenditure (cost) totals, National School Feeding Program (Programa Nacional de Alimentação Escolar (PNAE)), 2008–2010, Santa Catarina, Brazil
Analysis of direct acquisitions from family farms between 2008 and 2010 for all municipalities revealed that Group 1 represented 51·3 % of the total energy; while Group 2 represented only 9·9 %, Group 3 represented 19·7 % and Group 4 represented 19·0 % (average proportions). The total proportion of acquisitions from family farms in terms of cost was 61·6 % for Group 1, 3·9 % for Group 2, 18·5 % for Group 3 and 16·0 % for Group 4 (average proportions). These data suggest that the acquisition of Group 1 foodstuffs financially burdens school feeding to a greater extent than does acquisition of other food groups. The proportions of total energy and total cost for Group 3 foods are similar, while in Groups 2 and 4 the proportion of total energy is higher than the proportion of the total cost. The proportion of total energy of Group 1 represents a high proportion of the total acquisitions from family farms.
Thus, as expected, the food basket provided by family farms presented a higher proportion of unprocessed or minimally processed foods (Fig. 2). The proportion of ultra-processed products was high in baskets from both conventional suppliers and family farms, and processed foods composed a larger share of the family farming basket.
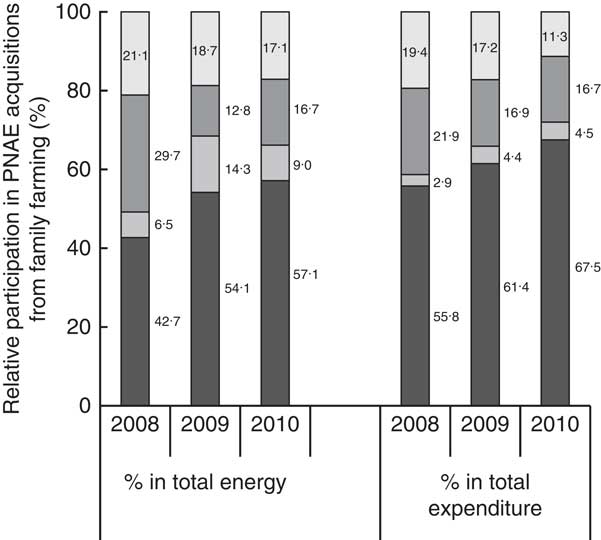
Fig. 2 Relative participation (%) of different food groups (![]() , unprocessed and minimally processed foods;
, unprocessed and minimally processed foods; ![]() , processed culinary ingredients;
, processed culinary ingredients; ![]() , processed foods;
, processed foods; ![]() , ultra-processed food and drink products) in the annual energy and expenditure (cost) totals of PNAE food acquisitions from family farming, National School Feeding Program (Programa Nacional de Alimentação Escolar (PNAE)), 2008–2010, Santa Catarina, Brazil
, ultra-processed food and drink products) in the annual energy and expenditure (cost) totals of PNAE food acquisitions from family farming, National School Feeding Program (Programa Nacional de Alimentação Escolar (PNAE)), 2008–2010, Santa Catarina, Brazil
City A acquired the following foods from family farms: rice (whole and parboiled); beans and other legumes (chickpeas, organic soyabeans, lentils); meats (beef, pork, chicken); milk; fresh fruits (avocados, pineapples, bananas, bergamot, oranges, limes, lemons, apples, papayas, watermelon, peaches, tangerines, grapes); vegetables (lettuce, kale, spinach, cauliflower, broccoli, onion, cabbage, parsley, green onion, tomatoes, beets, carrots, chayote, potatoes, sweet potatoes, barley potatoes, cassava, corn cob, pumpkin); fish; eggs; cassava flour; pasta; wheat flour (whole and refined); corn flour; rice flour; oatmeal flour; tea; sugar (brown and refined) and molasses obtained from cane; honey; refined soyabean oil; lard; vinegar; corn starch; freshly made breads (with whole and refined flours); cheese; canned corn; cookies and crackers.
City B acquired: beans; meats (beef, pork); milk; fresh fruits (avocados, bergamot, oranges); vegetables (lettuce, chicory, cabbage, sweet potato, cassava, beets, carrots, corn cob and kernel); eggs; corn flour; molasses obtained from cane; honey; freshly made breads (with whole and refined flours); cheese; cookies and crackers. City C did not acquire foods from family farms during the research period. The proportion of total energy attributed to animal fats corresponding to items acquired from family farms by city B (0·4 %) referred primarily to the acquisition of lard. Meat, beans, leafy vegetables, roots and tuber vegetables were purchased from farmers at similar levels for cities A and B, although it is worth mentioning that leafy vegetables represented only a small portion of total energy with an average of 1·2 %.
Foods purchased only from conventional suppliers were instant desserts, sausages, meats and chicken extracts and instant sauces, margarines, breakfast cereals, sweetened ‘fruit’ yoghurts and candies (confectionery). However, foods from all four groups defined by the NOVA classification were purchased from both types of suppliers. In city C, all the different types of foods were acquired from conventional suppliers.
In evaluating the average price, food group, year of acquisition and city, we found that the prices of foodstuffs from family farms were consistently higher than those of conventional suppliers (Table 3). Moreover, the price difference between those suppliers (family farms v. conventional) increased over the research period.
Table 3 Average price ($US/4184 kJ (1000 kcal)) of PNAE acquisitions from conventional suppliers and family farms per city, year and food group, National School Feeding Program (Programa Nacional de Alimentação Escolar (PNAE)), 2008–2010, Santa Catarina, Brazil
(–), data not available (city C did not purchase from family farms during the research period).
Analysis of average prices of food items acquired from family farming v. conventional suppliers showed that the former had higher prices for city A. This is likely because this municipality can attract more suppliers in this category (an average of 20·0 % of the total energy for the period) than city B (an average of 13·0 % of the total energy for the period). City C showed no acquisitions for this period, probably due to issues with management (e.g. knowledge and understanding of legislation, political willingness). The average price ($US/4184 kJ (1000 kcal)) of total foods purchased from family farms over the study period for all municipalities was 1·3, while acquisitions from conventional suppliers was 0·9.
Discussion
Agriculture and health are intrinsically related, now more than ever before( Reference Hawkes and Ruel 20 ). The implementation of Law 11.947/2009( Reference Brasil 5 ) in Brazil represents a concerted effort to bring these sectors closer together, with the purpose of developing local small family farms while promoting health and well-being through the PNAE; this should facilitate healthier habits and better livelihoods for individuals in surrounding communities( 6 ). Our research on PNAE food acquisition provides data for assessing the initial years of Law 11.947/2009( Reference Brasil 5 ), which represents a new model of public procurement that favours the promotion of health and local development.
Given that updated and reformed legislation became mandatory only in 2010, the analysis of food acquisition through the PNAE bears particular relevance for the inclusion of family agriculture into school feeding( Reference Villar, Schwartzman and Januario 21 , Reference Saraiva, Silva and Sousa 22 ). This process is full of challenges and possibilities, and represents an agro-health initiative that is expected to strengthen regional food sustainability while improving community dietary patterns, primarily by focusing on increased consumption of minimally processed foods by schoolchildren( Reference Saraiva, Silva and Sousa 22 ).
Initial analysis of the relative share of total energy of the food groups and subgroups indicated that the profile for PNAE food acquisition was less favourable in Group 4 than indicated in data from the National Household Budget Survey (Pesquisa de Orçamento Familiar (POF)) for 2008–2009( 12 ), which was 15·6 %. On the other hand, the proportion of unprocessed or minimally processed foods in the purchases reported in the PNAE was higher than that reported by the POF (38·9 %)( 12 ). These findings are relevant, because they point to the importance of discouraging administrators of the PNAE from reproducing the unhealthy eating patterns in that have been accumulating at the population level. Our results show that food from Groups 1 and 2 together provided almost three-quarters of the total energy for the programme, which means that unprocessed or minimally processed foods and processed culinary ingredients comprised the majority portion of the PNAE menus during the study period. This finding is compatible with the guidelines of the current Brazilian Food Guide( Reference Monteiro, Cannon and Levy 18 ) and highlight relevance for breaking with the unhealthy dietary patterns in the school environment. It is also worth mentioning that one of the PNAE aims is to develop food and nutrition education and promote healthy eating at school, and ideally then reaching families and communities.
There was a trend towards a minor increase in the relative share of total energy from ultra-processed foods, and this was associated with a decrease in the share of total cost. Increased affordability and availability of ultra-processed foodstuffs are particularly concerning, as this facilitates access to unhealthy foods and encourages specific patterns of consumption within the school environment. In other words, food is available at no cost to the student in this environment, determining the pattern and tendency of consumption.
It has previously been suggested that the social and physical environments influence health behaviour( Reference Leite, Oliveira and Cremm 23 ), and given that school carries the ethos of privileged learning and emphasizes the incorporation of socially conducive behaviour(s) and processes of habit building( Reference Schmitz, Recine and Cardoso 24 ), eating patterns that extend beyond the school community are crucial aspects upon which school feeding impacts.
The heightened presence of Group 4 products in school feeding trends is also a concern, as this indicates an increase in energy density and an unfavourable nutritional profile( Reference Monteiro, Levy and Claro 25 ). It is also a well-established fact that the consumption of ultra-processed foods is among the main causes of the current pandemic of obesity and non-communicable chronic diseases( 26 ). It is thus important to note that in the cities assessed, the present research identified a trend of stability in the relative share of total energy comprised by unprocessed or minimally processed foods (Group 1) with low energy density and high nutrient and fibre contents( Reference Monteiro, Levy and Claro 25 ). Likewise, a trend of stability for Group 2 (cooking ingredients) and reduction for Group 3 (processed foods) was observed. Nevertheless, for Group 4 (ultra-processed products), there was a trend towards an increase in relative proportion of energetic value (Table 1), with evidence of the opposite impact on cost (Table 2). This reinforces the possible influence of food pricing on food availability for school meals, as shown at the national level by the POF( Reference Claro and Monteiro 27 , Reference Ricardo and Claro 28 ).
In the analysis of suppliers, purchases from family farms during the study period showed a more favourable distribution among the different food groups, indicating the positive approach of the PNAE to integrate local farm suppliers. At the same time, our research showed that acquisition of Group 1 foodstuffs can, in fact, burden the comprehensive implementation of healthier school meals (Figs 1 and 2). While this may seem like an immediate disadvantage, there is the increased income for small, local farming business to consider and, to a certain extent, the demands of local development.
It is noteworthy that the municipalities assessed did not reach the acquisition target for family farming products (a minimum of 30 % of the federal funds allocated to the programme). Nevertheless, we consider that in the first year of the research period (2008) there was no such legal goal yet; in the second year (2009) federal Law 11.947 was approved, but it was only in the third year (2010) that its application became mandatory. Therefore, among the positive aspects that can be pinpointed, we note that annual data analysis of family farms over the study period showed a trend towards improved food purchases. This trend, although positive since it signals a favourable effect of the law and potential to reach and exceed the defined goals, causes increased costs for school feeding.
However, regarding public procurement, we stress the need to overcome the contradiction between efficiency, related to the acquisition of foods for lower prices (value for money), and sustainability, which operates with the idea of ensuring the best value( Reference Morgan and Sonnino 29 ). Acquisition of family farming foods is an investment in improving social, health and environmental conditions in the mid and long term, even if this results in higher value of spending compared with conventional supplier purchases( Reference Sonnino, Bassinello and Lozano 30 ).
With respect to average prices, city A demonstrated the highest value. Across all analyses the price of acquisitions from family farms was consistently higher, no doubt burdening school meals and perhaps inhibiting regional programme implementation in initial stages (Table 3). We also note the relative affordability of products from conventional suppliers over the study period (Table 3); this may be a strategic move to counterbalance reducing sales volume due to the increased direct acquisition from family farms.
We also observed that the price differences between suppliers (family farm v. conventional) increased over the research period. Further, the average price of ultra-processed foods was 30 to 40 % lower than that of unprocessed or minimally processed foods. If this trend persists, then it is important to consider that the proportion of unhealthy foods in schools may increase regardless of the type of supplier. In this sense, research analysing the differences in cost and consumption of ultra-processed foods between the UK and Brazil concluded that the relative affordability of ultra-processed foods in the UK is one reason for higher comparative consumption( Reference Moubarac, Claro and Baraldi 31 ).
We also found low quantities of fruits and vegetables in acquisitions, whether provided by family farmers or conventional suppliers. Further, the high combined proportion of foods in Groups 3 and 4 in PNAE acquisitions indicates that there is untapped potential in the region for the introduction of healthier, locally sourced food into school menus.
Our findings also agree with nationwide data indicating that in Brazil, during the past three decades particularly, ultra-processed products are progressively replacing the consumption of healthier, less processed foods regardless of population income level and spending power( Reference Monteiro, Levy and Claro 25 ).
The southern region of Brazil stands out in terms of family farming and its contribution to national domestic provisioning( Reference Guilhoto, Ichihara and Silveira 32 ). An initial assessment of Law 11.947/2009( Reference Brasil 5 ) indicated that in the south, 71·0 % of the municipalities are already acquiring food from family farms for school feeding( Reference Saraiva, Silva and Sousa 22 ). For this reason, it is worth emphasizing that there are limits in the present study due to development in only three cities with a predominantly agricultural profile, located in a Brazilian region that stands out as having a strong family farming sector. In this sense, both the positive and negative aspects pointed out by our research findings cannot be extrapolated to the whole country. Despite this, our results certainly offer some elements that strengthen the link between family farming and school feeding beyond the local level.
In the municipalities evaluated, meat, milk, cheese, vegetable oils and sweets in general, among other foodstuffs, are in the inventory of food items acquired from family farms. This indicates that farmers who have provided for school meals are reasonably established and have adequate infrastructure to ensure the legal standards for product quality. Similarly, in two small municipalities in São Paulo state, south-eastern Brazil, milk and yoghurt are among the items supplied by family farms for local school menus( Reference Belik and Domene 33 ). It is thus necessary to consider that in the approach and debate of school feeding standards, the development of smaller local producers should be facilitated to alleviate regional inequalities and effectively promote local development.
The differences observed among the three sample cities (A, B and C) are surprising, as they are geographically aligned and share similar social, demographic and economic indicators. This scenario indicates that, in principle, there is little reason for the disparities in food acquisition from family farms in terms of prices or even in the types of food purchased. Thus, we can conclude with some degree of certainty that other factors have caused the observed differences in the patterns and behaviour of food acquisition in our three sample cities.
We suggest that the political positioning of managers and technicians and their respective understanding of school feeding can affect programme consistency and make room for discrepancy. Indeed, as other authors have pointed out( Reference Triches and Schneider 9 , Reference Belik and Domene 33 ), there is a degree of complexity of issues that can impinge upon effective implementation and adherence to the law and the PNAE. Examples of this include the interaction of managers with other sectors, provision for public action, intersectoral partnerships and projects qualifying farmers, and prejudice with regard to the quality of the products of these small local suppliers. There is also strong probability that given the higher price of basic, healthier foods supplied by family farms, local administrations have a degree of resistance to include family agriculture in PNAE food provision. This may lead to a preference for acquisition of foods in Groups 3 and 4 from conventional suppliers.
Conclusion
Our results indicate that implementation of Law 11.947/2009 has produced a positive effect on the regional profile of PNAE food purchase patterns. However, the law is being underutilized and has not produced significant changes in hegemonic dietary patterns. There is still a considerable potential and need to promote healthier habits by strengthening the relationships between family farming and school feeding. Higher food prices of family farms may be one of the restricting factors, and this justifies the creation of a new pricing policy for this specific sector. Moreover, public management must overcome the principle of ‘purchases at the lower value’, replacing it with the principle of ‘purchases at the best value’.
We conclude that the dynamic link between family farming and school feeding, with its timely and intersectoral nature, requires attention and concerted collective efforts to build a more comprehensive working knowledge of this strategy. This will result in positive outcomes for health promotion and local development, and may aid in better defining agro-health initiatives for a sustainable future.
Acknowledgements
Acknowledgements: The author wishes to acknowledge Dr Carlos Augusto Monteiro and Dr Rafael Moreira Claro, University of São Paulo (USP), for their assistance in providing detailed information on methods used, which are based in the ones that are usually applied in the Brazilian Household Budget Surveys. Financial support: This study was developed during postdoctoral internship, supported by the National Council for Scientific and Technological Development (CNPq), Brazil (research fellowship/grant number 102231/2011-7). CNPq had no role in the design, analysis or writing of this article. Conflict of interest: None. Authorship: C.R.P.A.T. is the only author of the study, from its conception to the drafting of the paper submitted for publication. Ethics of human subject participation: The study was conducted according to the guideline laid down in the Declaration of Helsinki. The Institutional Ethics Board of Universidade Comunitária da Região de Chapecó (Unochapecó) granted ethical approval for collection of survey data.


