


Gestational diabetes mellitus (GDM) is defined as any degree of glucose intolerance at the beginning or first recognition during pregnancy( 1 ) and that which may lead to significant comorbidities for the mother and her fetus, not only in the perinatal period but also in the long-term. Among the most cited complications in the literature are hypertensive disorders of pregnancy (HDP), higher incidence of caesarean delivery, fetal macrosomia and risk of type 2 diabetes on postpartum and cardiovascular complications( Reference Retnakaran, Qi and Connelly 2 , Reference Ali, Jarrar and El Sadig 3 ).
The prevalence of GDM is between 1 and 14 % depending on the population studied, ethnicity, geographical location, frequency of tracking and diagnostic criteria used( 4 ). In Brazil, the prevalence of GDM in women over 20 years assisted by prenatal services of the Unified Health System is 7·6 % with 94·0 % of cases only presenting with decreased glucose tolerance and 6·0 % presenting with hyperglycaemia similar to the level of type 2 diabetes( 5 , 6 ).
Considering that maternal nutrition is an important determinant of women’s health and that it can bring positive impact to the obstetric and neonatal outcomes, prenatal nutritional care is recommended( 4 ). This care is based on assessment and individualised nutrition guidance and its main objective is to meet the nutritional recommendations for the pregnant woman, contributing to prevention of nutritional disorders and disabilities throughout and after pregnancy( 6 , Reference Chagas, Ramalho and Padilha 7 ).
Nutritional therapy is considered relevant for adequate glycaemic control in pregnant women with GDM( 1 , 6 ). This strategy includes methods of dietary guidance, such as glycaemic index and glycaemic load, traditional method (TM) and carbohydrate counting method (CCM)( Reference Lima, Rosado and Ribeiro Neves 8 ).
Regardless of the method adopted in nutritional therapy, the Western dietary patterns with the increasing prevalence of obesity and sedentary lifestyle that exist today should be considered( Reference Monteiro, Conde and Popkin 9 ). The intake of processed foods (PF) and ultra-processed foods (UPF) is an important risk marker for the current epidemiological profile of the population, as well as the increasing intake of diets with high levels of sugar, salt and fat, contributing to an increase in occurrence of diabetes mellitus (DM) and GDM( Reference Bielemann, Motta and Minte 10 – Reference Louzada, Martins and Canella 12 ).
Another issue is the distribution of macronutrients in food plan prescription for pregnant women with GDM and the lack of standardisation of carbohydrate percentages, since it is the nutrient that directly interferes in glycaemia( Reference Jovanovic 13 ). There is no consensus in the literature about the percentages for an ideal diet for this group. Some committees defend carbohydrate restriction (between 30 and 45 %) to get better postprandial glycaemic control and even for macrosomia prevention( Reference Ali, Jarrar and El Sadig 3 , Reference Jovanovic 13 ). However, this restriction results in a higher level of lipids in the diet, which may lead to deleterious effects in the medium and long term, since the protein intake is remarkably constant (15–20 %)( Reference Simpson and Raubenheimer 14 ). The balance between the percentages of macronutrients seems to be the key to dietary therapy treatment of pregnant women with DM and GDM( Reference Hernandez, Van Pelt and Anderson 15 ).
Food intake of pregnant women with GDM is little discussed in the literature, and there is still a gap in the percentage of macronutrient distribution in nutritional therapy recommended for this group, especially regarding the comparison of intake by different dietary guidance methods. For example, Han et al. ( Reference Han, Crowther and Middleton 16 ) described trials with different types of dietary advice for pregnant women with GDM; however, the author’s conclusions were that studies were too small for reliable conclusions about which types of dietary advice were most suitable. Therefore, this study aimed to evaluate the food intake of pregnant women with GDM according to two methods of dietary guidance and thus provide a basis for nutritional monitoring of these women with a view to a favourable perinatal outcome.
Methods
Design
This was a randomised controlled, single blind and two-arm treatment trial. The study was part of a larger study aimed at assessing the effect of a prenatal nutritional counselling programme for women with GDM.
Participants
The population studied consisted of adult pregnant women diagnosed with GDM, accompanied by prenatal services during pregnancy, childbirth and postpartum, in the period between 2011 and 2014.
The selection criteria for pregnant women in the study were: diagnosis of GDM accomplished and confirmed in the maternity ward; gestational age by the date of last menstrual period to a maximum of 28 weeks; adults (greater than or equal to chronological age of 20 years at the time of conception); pregnancy with a single fetus. Pregnant women with chronic illnesses – coeliac disease, lactose intolerance, muscle lipodystrophy, infection by HIV, syphilis, psychiatric diseases or use of restrictive diets (vegetarian and others) – were not included.
The diagnosis of GDM was made based on the International Association of Diabetes and Pregnancy Study Group( 17 ) criteria. Fasting plasma glycaemia values ≥5·11 mmol/l in the first trimester of pregnancy, plasma glycaemia 1 h after oral glucose tolerance test (OGTT) 75 g ≥9·99 mmol/l and plasma glycaemia 2 h after OGTT 75 g ≥8·49 mmol/l in the second or third trimester, were considered cases of GDM( 4 , Reference Bornia, da Costa Junior and Amim Junior 18 ).
The techniques used for the collection of information were an interview with a nutritionist during appointments and the collection of information from medical records of pregnant women during their postpartum period and data from their newborns at a public hospital in the city of Rio de Janeiro, Brazil.
Nutritional intervention
Pregnant women diagnosed with GDM received six individual appointments with the nutritionist during pregnancy, the first appointment being soon after the diagnosis of GDM, and the following ones as the flowchart described in Fig. 1. During the appointments with the nutritionist, women underwent nutritional assessment and received individualised guidance according to pregnancy complications and digestive symptoms, in addition to a dietary plan aiming to gain estimated weekly and total weight. In subsequent appointments, assessment of adherence to the orientation provided in previous meetings was performed and adjustments were made when necessary.
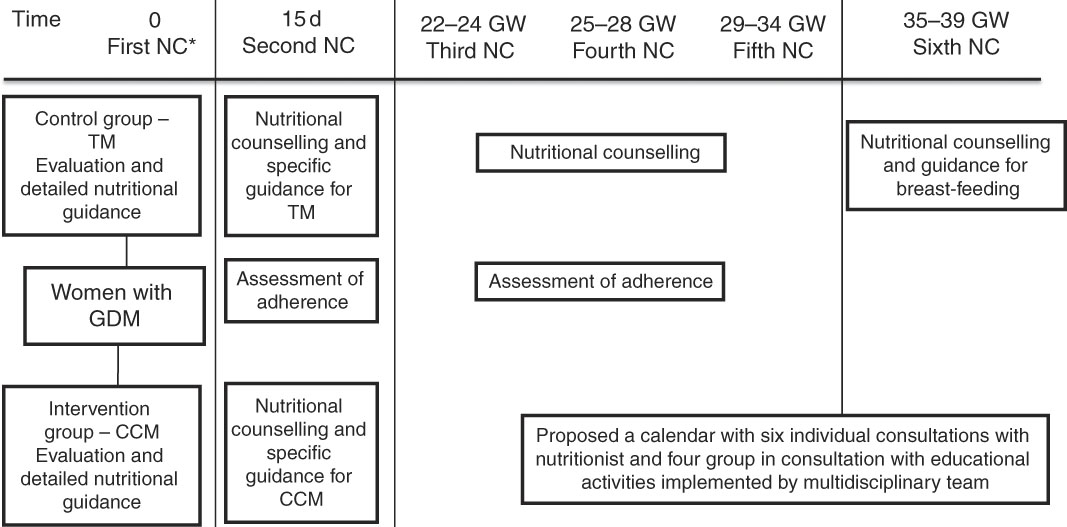
Fig. 1 Flowchart of nutritional intervention. * Pregnant woman diagnosed after 28–30 weeks of gestation received nutritional counselling every 15 d. NC, consultation with the nutritionist; GW, gestational week; TM, traditional method; GDM, gestational diabetes mellitus; CCM, carbohydrate counting method.
The characteristics of dietary planning were similar between groups, with the exception of the dietary guidance method, where the control group (CG) was instructed by TM and the intervention group (IG) by CCM.
An individualised diet plan with the total energy value (TEV) was developed for the recommended weight gain( 19 ) until the end of gestation (40 weeks). The feeding plan was adapted to dietary habits and socioeconomic conditions, based on a healthy diet, adjusted when necessary at each visit when presenting with digestive symptoms, complications of pregnancy, comorbidities or complications of DM. The proportion of macronutrients prescribed in the diet plan was the same for both groups, the percentage of total carbohydrates prescribed was 50–55 % of the TEV based on recommendations from the literature( 20 ) and adapted to the clients that seek greater adherence to the food plan.
Protein and fat percentages were prescribed based on the American Diabetes Association (ADA) recommendations( 20 , 21 ). For proteins, the range of 15–20 % of the TEV was prescribed, considering a daily additionof 10 g. Considering the fats, the ratio was 30–33 % of the TEV, with <7 % of saturated fat.
The diet fractionation was five to six meals a day at regular times, for both groups( 20 , 21 ). Energy distribution prescribed by meal was the same for both groups: breakfast and lunch (10–15 %), snack and evening meal (5–10 %) and dinner (20–30 %)( 5 ).
Nutritional guidance method used in the control group
CG members received a colourful food sheet with dietary planning individually calculated. This report contained a food substitution list, composed of nine groups (fruits, breads, dairy products, meats, cereals, legumes, fats and vegetables (classified into A and B)). The foods in the form of portions were divided into food groups of similar energy value and the women were instructed to perform the exchanges between foods of the same food group. In this group, sucrose intake was advised against, according to routine maternity care. The recommended sweeteners were aspartame, sucralose, potassium acesulfame, saccharin and neotame, as a recommendation of the ADA( 20 ) for pregnant women. The women were also oriented about the reading of PF labels for the correct identification of the sweetener types( Reference Seabra, Saunders and Padilha 22 ).
Nutritional guidance method used in the intervention group
We used the CCM of carbohydrate substitutions list type (within the context of healthy eating). The pregnant women received a food report containing a substitution list with foods grouped in the same way as the CG group list, based on similar nutritional characteristics, and the foods in each group were grouped in 15 g portions of carbohydrate. That was the main difference between one method and the other.
The pregnant women were instructed to keep the carbohydrate amounts per meal, prescribed by the nutritionist. If they wanted to exchange foods between the groups, they could do so, because the principle of this method is the amount of carbohydrate ingested per meal. In this group, sucrose intake was not forbidden. However, they were advised against it, and if the pregnant women wanted to consume something else, she was oriented to consume that within the limit of 10 % of the TEV and include it in the carbohydrate counting. Regarding the consumption of sweeteners, the pregnant women in this group received the same guidelines previously mentioned for the CG.
Following the division into the groups and as part of the nutritional intervention, pregnant women underwent group appointments with educational activities made by a team of nutritionists, psychologists and nurses, to clarify and reinforce the guidance received during individual consultations.
Sample size
A significance level of 5 %, with power at 90 %, was established to calculate the original study sample size to detect a minimum difference of 15 % between the two groups with respect to adequate and inadequate gestational weight gain.
A sample size of 100 pregnant women was estimated for each group (IG – nutritional orientation based on CCM and CG – nutritional intervention based on TM). These numbers were based on a 20 % prevalence of gestational weight gain that had been observed in previous studies with adult pregnant women in the same maternity facility (S. d. Oliveira Corrêa da Silva, C. S., L. Zajdenverg, L. N. Moreira, S. P. Heidelmann, A. Cristine dos Santos Pereira, P. d. C. P., Grupo de Pesquisa em Saúde Materna e Infantil (Research Group in Maternal’s, Child’s Health), predictive factors for birth weight of newborns of mothers with GDM, Diabetes Research and Clinical Practice (2018), doi: https://doi.org/10.1016/j.diabres.2018.01.032). Due to the fact that the original study (Contributions Theoretical and Practical for Prenatal Care for Diabetic Pregnant, REBEC: RBR-524z9n) was longitudinal, a loss to follow-up of 15 % was estimated; therefore the minimum sample size for the study was 230 pregnant women.
Randomisation
Pregnant women were allocated randomly into two groups defined as CG and IG( Reference Escosteguy 23 ) and was performed according to the final number of the records, as follows:
∙ CG: women with GDM who received nutritional guidance based on the TM (odd final digit).
∙ IG: women with GDM who received nutritional guidance based on CCM (even final digit).
The number for each patient record was generated randomly by a computer programme; thus it was considered as a randomised study because the researcher did not have access to the definition of this numbering.
Implementation
Data collection was performed by a team of trained researchers.
Blinding
The study was single blind, because only the researcher knew in which study group the mother was allocated.
Assessment of food intake
The analysis of food intake was evaluated using a semiquantitative frequency questionnaire (SQFQ) which was applied in the second (second trimester) and fourth prenatal appointments (third trimester)( Reference Bertin, Parisenti and Di Pietro 24 ). The SQFQ consisted of twenty food items with the intake frequency options: daily, weekly, biweekly, monthly and never. To quantify the intake in g or ml/d, a table for home measurements was used( Reference Pinheiro, Lacerda and Benzecry 25 ).
The conversion in energy content (kJ) and macronutrients (g) of food was carried out in a spreadsheet in the programme Microsoft Office Excel 2003, in which foods and their nutrient content were included according to the chemical composition of the food tables of the United States Department of Agriculture( 26 ), of the Instituto de Nutrición Centro América y Panamá( 27 ) and the Brazilian Table of Food Composition( 28 ), according to the daily amount of each food consumed by pregnant women. In all, three different tables were used to quantify nutrients because the Brazilian Table of Food Composition did not contain all the nutrients required.
For the assessment of PF and UPF intake, the classification of foods cited in the SQFQ was performed based on the definitions proposed by the Food Guide for the Brazilian Population( 29 ), followed by the quantification of these foods consumed per day and week in the second and third trimester. PF were considered to be in natura foods manufactured with the addition of salt or sugar. The UPF were products whose manufacture involves various stages and processing techniques and various ingredients, many of them exclusively for industrial use. It was considered for the analysis of the number of PF and UPF consumed per day and per week in each gestational trimester, not the amount of these foods present in a portion( 29 ). They were considered as PF, foods such as cheeses, natural yogurt, breads, canned foods and as UPF were considered butter, soft drinks, biscuits and industrialised drinks, whole-grain bread and frozen foods. In case of more than one SQFQ per gestational trimester, the arithmetic average of the PF and UPF number cited by pregnant women was performed.
The assessment of adherence to the dietary plan proposed was based on an instrument developed and validated by Della Líbera et al. ( Reference Della Líbera, Ribeiro and Santos 30 ). The aspects considered in this assessment were: diet quality (intake of foods from all food groups), amount of food consumed (intake of prescribed amounts), meal patterns (consumption of all prescribed meals and at regular hours), adequacy of weekly weight gain (considered to ±20 % of adequacy in the previous appointment). Adherence was rated as poor (one criteria observed), good (two or three criteria observed) or great (four criteria observed). The categories were analysed together because there were few observations of optimal adhesion, making the analysis in three strata (poor, good and great) impossible.
Nutritional assessment
Regarding the nutritional assessment, the following were performed:
∙ Anthropometric assessment: current height and gestational weight (GW) measures were assessed at the first prenatal appointment by the nurses of the ambulatory unit, according to the Brazilian health ministry’s recommendations( 5 ). The pre-gestational BMI was analysed as well as the adequacy of total gestational weight gain by the recommendations of the Institute of Medicine( 19 ).
∙ Clinical and laboratory assessment and additional tests: during the appointments, the presence of digestive symptoms and pregnancy complications was investigated, as anaemia, HDP and premature membrane rupture( Reference Bornia, da Costa Junior and Amim Junior 18 ). The presence of anaemia was considered when Hb values were <6·83 mmol/l( 5 ). For glycaemic control, fasting plasma glycaemia values ≤5·27 mmol/l and postprandial hour ≤7·77 mmol/l, values above these cutoff points were considered as a lack of glycaemic control( 21 ).
∙ Sociodemographic and obstetric assessment: at the first appointment of prenatal nutritional assistance information was collected on maternal age, marital status, place of residence (considering that residences in the south of the city show a higher per capita income than the other areas of the city), educational level, household sanitation, skin colour, number of prenatal appointments, number of appointments of prenatal nutritional assistance, pregnancy/childbirth/puerperium previous events, last menstrual period, menarche, number of pregnancies and abortions. It should be noted that gestational age calculated by ultrasonography was preferentially used; the gestational age calculated by the date of the last menstrual period was only used when there was no information from the ultrasonography available. The condition of the fetus at birth was evaluated using birth weight and gestational age at birth.
Statistical methods
In the analysis of food intake data, the energy adjustment method was utilised by the waste method proposed by Willet et al.( Reference Willett, Howe and Kushi 31 ) to observe the influence of isolated nutrients on a particular outcome, without the interference of the total energy content. For the adjustment, a simple linear regression analysis was performed, considering nutrient intake as the dependent variable, and total energy consumed as the independent variable. Then, the value of α and β was defined to obtain the residue. To adjust the nutrient by energy intake, it was necessary that the residue was added to a constant value, calculated using the formula: C=α+(β×average energy of the group).
In the exploratory analysis of data of quantitative variables, central tendency and dispersion measures were calculated (average and standard deviation). For the comparison of averages tests, Student’s t test, ANOVA and post hoc (Tukey) were applied. The association between categorical variables was assessed using the χ 2 test and Fisher’s exact test. The level of significance adopted in the study was 5 %. Quartiles of carbohydrate, protein and lipid intake, described as percentage of TEV ingested were calculated; for the comparison of averages of fasting blood glucose and postprandial blood glucose by quartiles of macronutrients, ANOVA and post hoc (Tukey) tests were applied. Statistical analyses were performed using the software Statistical Package for the Social Sciences for Windows® 21.0 version.
Ethical considerations
The study was designed according to Resolution 196/96 of the Brazilian National Health Council/Ministry of Health, which is a signatory of the Declaration of Helsinki. The project was approved by the Committee of Ethics in Research of the Hospital Maternity from Universidade Federal do Rio de Janeiro on 15 October 2010 (protocol no. 17/2010; CAAE 0017.0.361.361.10) and registered in the Brazilian Registry of Clinical Trials (Rebec RBR-524z9n).
All participants signed the informed consent form.
Results
Data from 286 pregnancies were analysed, being 145 in the CG (50·7 %) and 141 in IG (49·3 %). The average age was 31·2 (sd 5·8) years. There were eight that were lost to follow from the initial sample (n 299), four from the CG and four from the IG. The flowchart presented in Fig. 2 describes the progress of the study.
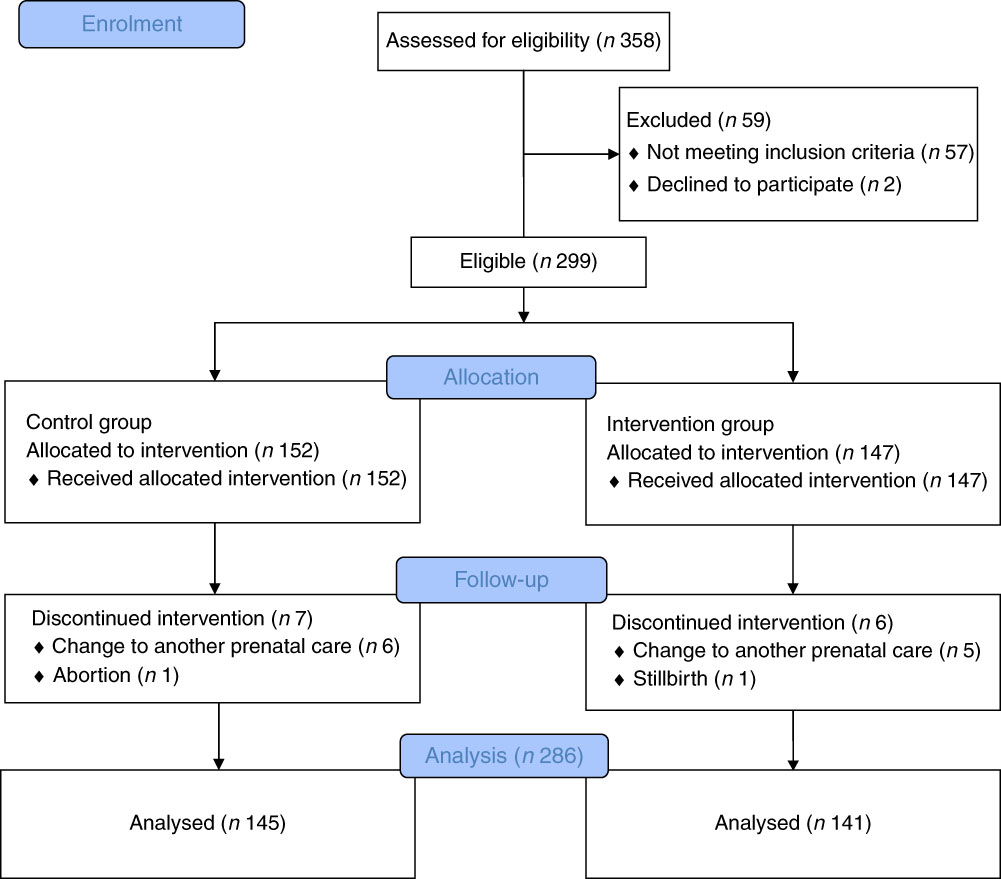
Fig. 2 Progress flowchart of the study phases (description of intervention allocation, follow-up and data analysis).
Regarding sociodemographic characteristics, it was observed that 64·4 % (n 177) of pregnant women described themselves as having black or brown skin colour; 86·4 % (n 236) reported living in a stable relationship. Regarding the place of residence, 33·9 % (n 87) lived in the south zone of the city of Rio de Janeiro, Brazil, while 66·1 % (n 89) lived in other areas of the city.
The sociodemographic and anthropometric characteristics, according to the study groups are shown in Table 1. There were no differences between the groups, suggesting that the randomisation process adopted in the study was adequate.
Table 1 Sociodemographic and anthropometric characteristics of women with gestational diabetes mellitus, according to the study groups (Rio de Janeiro, RJ, Brazil (2011–2014)) (Numbers and percentages)
CG, group which was instructed by the traditional method; IG, group which was instructed by carbohydrate counting; BMI, pre-pregnancy BMI.
* By χ 2 test.
There was no difference (P≥0·05) with respect to sociodemographic, anthropometric (Table 1), obstetric characteristics and prenatal care. The similarity between the groups is also confirmed in the analysis of the averages of maternal and prenatal care characteristics, as there was no difference between the CG and the IG for the average pre-pregnancy BMI (27·69 (sd 4·65) v. 27·87 (sd 4·87); P=0·74); total weight gain (11·12 (sd 5·06) v. 10·43 (sd 5·65); P=0·29); number of pregnancies (2·60 (sd 2·62) v. 2·39 (sd 2·39); P=0·22); number of deliveries (1·2 (sd 1·20) v. 0·97 (sd 0·97); P=0·12), gestational age at first use of insulin (28·64 (sd 5·59) v. 27·01 (sd 6·38); P=0·13); gestational age at the first appointment for prenatal care (12·4 (sd 4·83) v. 12·3 (sd 4·79); P=0·88); number of appointments for prenatal care (11·43 (sd 2·90) v. 11·83 (sd 2·82); P=0·24) and number of appointments with a nutritionist during the intervention (5·13 (sd 1·94) v. 5·2 (sd 1·91); P=0·75).
As there was no significant difference between the groups regarding the observed clinical features, the analysis was performed on the total sample, without separation by study groups; 37·9 % were associated with pregnancy complications. Among those who had complications, anaemia was the most prevalent, being diagnosed in 20·2 %, followed by HDP diagnosed in 8·4 % and premature rupture of membranes occurred in 4·7 %.
Considering the conditions of the fetus at birth, the average birth weight was 3235 (sd 480·27) g, and the average of gestational age at birth was 38·5 (sd 1·50) weeks.
Concerning the energy and macronutrient intake, there was no difference between the groups, regardless of the type of dietary guidance received (Table 2). Similarly, there was no difference between the categories of intake adequacy of these macronutrients (Table 3).
Table 2 Intake of macronutrients, energy content and ultraprocessed and processed foods in women with gestational diabetes mellitus, according to the study groups (Rio de Janeiro, RJ, Brazil (2011–2014)) (Mean values and standard deviations)
CG, group which was instructed by the traditional method; IG, group which was instructed by carbohydrate counting; PF, processed food; UPF, ultraprocessed food.
* Number of foods cited in semiquantitative frequency questionnaire.
† By χ 2 test.
Table 3 Adequacy percentage of macronutrient intake by women with gestational diabetes mellitus, according to the study groups (Rio de Janeiro, RJ, Brazil (2011–2014)) (Numbers and percentages)
CG, group which was instructed by the traditional method; IG, group which was instructed by carbohydrate counting.
* By Pearson’s χ 2 test.
Regarding the relationship between macronutrient consumption by quartiles and maternal glycaemia, it was verified that the consumption of lipids in the second trimester of gestation, corresponding to the third quartile was associated with a higher mean postprandial blood glucose compared with the mean blood glucose level observed in the second quartile (P=0·02). For the other macronutrients, no relationship with maternal glycaemia was observed (Tables 4 and 5). There was also a strong negative correlation (r –0·755; P≤0·001) between the percentages of carbohydrates and lipids consumed in the second trimester; the higher the consumption of lipids, the lower was the consumption of carbohydrates.
Table 4 Fasting and postprandial glycaemia (mmol/l) by quartiles of carbohydrate intake (percentage of total energy value (TEV)), protein (percentage of TEV) and lipid content (percentage of TEV) in the second trimester for women with gestational diabetes mellitus (Rio de Janeiro, RJ, Brazil (2011–2014))Footnote ∗ (Numbers, mean values and standard deviations)
NS, not significant (P>0·05).
∗ Carbohydrates (%) second trimester: first quartile <52·59; second quartile 52·60–58·97; third quartile 58·98–64·07; fourth quartile ≥64·08; protein (%) second trimester: first quartile <16·28; second quartile 16·28–18·44; third quartile 18·45–21·17; fourth quartile ≥21·18; lipids (%) second trimester: first quartile <19·20; second quartile 19·20–22·71; third quartile 22·72–27·37; fourth quartile ≥27·38.
† Post hoc tests Tukey.
‡ ANOVA.
Table 5 Fasting and postprandial glycaemia (mmol/l) by quartiles of carbohydrate intake (percentage of total energy value (TEV)), protein (percentage of TEV) and lipid content (percentage of TEV) in the third trimester for women with gestational diabetes mellitus (Rio de Janeiro, RJ, Brazil (2011–2014))Footnote ∗ (Numbers, mean values and standard deviations)
NS, not significant (P>0·05).
∗ Carbohydrates (%) third trimester: first quartile <54·20; second quartile 54·20–59·18; third quartile 59·19–63·697; fourth quartile ≥63·70; protein (%) third trimester: first quartile <16·71; second quartile 16·71–18·78; third quartile 18·79–21·38; fourth quartile ≥21·39; lipids (%) third trimester: first quartile <18·56; second quartile 18·56–23·04; third quartile 23·05–27·80; fourth quartile ≥27·81.
† Post hoc tests Tukey.
‡ ANOVA.
Table 6 Adherence (%) to the food plan proposed for women with gestational diabetes mellitus, according to the study groups (Rio de Janeiro, RJ, Brazil (2011–2014)) (Numbers and percentages)
CG, group which was instructed by the traditional method; IG, group which was instructed by carbohydrate counting.
* By Pearson’s χ 2 test. The categories good and great were analysed together because there were few observations of optimal adhesion, making the analysis in three strata (poor, good and great) impossible.
There was no difference in the amounts of PF and UPF consumed daily or weekly in the second and third trimester of pregnancy between the groups (P>0·05). Regarding the analysis of prevalence of intake of these foods by all the pregnant women in the two groups, it was observed that 89/120 (74·2 %) and 183/229 (79·9 %) of women consumed PF daily, in the second and third trimester, respectively, and 117/120 (97·5 %) and 225/231 (97·4 %) consumed UPF daily, in the second and third trimester, respectively.
When associating the amount of PF and UPF consumed with the adherence to the food plan, there was a higher weekly PF intake in those who had poor adherence to the food plan at the second appointment, which occurred in the second trimester of pregnancy (P=0·04).
There was no difference between the groups regarding the adherence to the food plan at the six appointments of prenatal nutritional assistance (Table 6).
Discussion
In this study, there was no difference in food intake between the CG and IG. These findings confirm the protective effect of prenatal nutritional assistance to this group of pregnant women, regardless of the dietary guidance method applied, suggesting that the nutritional care used, including a minimum calendar of appointments with a nutritionist beginning soon after diagnosis of GDM, may have influenced the perinatal outcomes of pregnant women with GDM in a positive way( Reference Lima, Rosado and Ribeiro Neves 8 ). It is noteworthy that the guidance and encouragement by the nutritionist to accomplish what was proposed in the food plan improved the adherence to treatment.
There are few studies that address food intake of pregnant women with GDM by different dietary guidance methods for comparison with the present study, confirming its originality. It should also be noted that there were no studies with a sample size similar to this study.
It was expected that the intake of energy content and macronutrients would be different between the groups, mainly because the CCM is a more flexible method than the TM; however, this difference was not demonstrated. The main difference between the methods used is the replacement list was that one provided 15 g of carbohydrate per serving and the other did not( 21 ). However, our substitution lists used traditionally also approximate the amounts of macronutrients prevalent in the groups (e.g. in the bread group, substitute foods had equivalent amounts of carbohydrates), which may explain the fact that there were no differences between the groups, taking into account that the energy content and macronutrients prescription recommendations were similar for both groups. Moreover, the CCM did not favour increased intake of carbohydrates among pregnant women.
In general, there was energy intake below that of what was usually prescribed for pregnant women in the study. Perhaps this result has been under-reported by omissions in the preparation, carbohydrate intake in both groups above that of what is recommended for individuals with diabetes or lower than that recommended for fats and within the recommended range for proteins( 21 ), which is different from the usual intake in Brazil( 32 ). It is believed that this intake may have been underestimated, and that intake has been reduced by pregnant women for fear of fetal macrosomia, change in glycaemic control, and possible use of exogenous insulin, as established by Louie et al.( Reference Louie, Markovic and Ross 33 ).
When checking the intake effect by quartiles in maternal glycaemia, it was observed that women who had higher fat intake (third quartile) had higher average postprandial blood glycaemia compared with those who had intake in the lower quartiles. In other words, the fat intake can also influence the maternal blood glycaemia during pregnancy in a negative way. Furthermore, there was still a strong correlation between the percentage of carbohydrate and fats consumed, showing that this disproportion in intake can interfere in glycaemic control.
This result is contrary to what is traditionally suggested in the literature on GDM diet approach, defending carbohydrate restriction to reduce postprandial glycaemia. In this study, a percentage between 50 and 55 % of carbohydrate was used in the dietary planning, which reinforces the maxim that carbohydrate restriction would not be beneficial because it would result in excess of fats. In the non-gravid state, a high-fat diet usually increases non-esterified SFA in serum, promoting insulin resistance( Reference Lichtenstein and Schwab 34 ).
Hernandez et al.( Reference Hernandez, Van Pelt and Anderson 15 ), in a randomised controlled study, submitted sixteen pregnant women with GDM to two isoenergetic diets, one with 40 % carbohydrates, 45 % fats and 15 % proteins and other diet composed of 60 % carbohydrates, preferably the complex ones, 25 % fats and 15 % proteins for 12 d with continuous monitoring of glucose levels. The authors found higher values of postprandial glycaemia (1 and 2 h) in pregnant women who received a diet with a higher percentage of fats, as seen in the data of this study, and suggested that a diet high in complex carbohydrates and low in saturated and trans-fats would achieve the goals of glycaemic control. This is increasingly remarkable as seen in several studies demonstrating that maternal glycaemia is sensitive to fat intake and that NEFA can be hydrolysed and transported across the placenta as a major substrate for the accumulation of fetal fat( Reference Schaefer-Graf, Graf and Kulbacka 35 , Reference Whyte, Kelly and O’Dwyer 36 ).
If continued exposure to a high-fat diet results in increased insulin resistance, it is possible that a diet high in complex carbohydrates and low in saturated and trans-fats can mitigate the increased insulin resistance during pregnancy, resulting in lower production of β cells and reduced insulin secretion demand, thus restricting the availability of fetal substrate( Reference Hernandez, Anderson and Van Pelt 37 ).
In a study among healthy pregnant women( Reference Ley, Hanley and Retnakaran 38 ) which had the purpose of investigating if the distribution of macronutrients during the second trimester of pregnancy had an association with glucose metabolism later in pregnancy, it was observed that 22·9 % of them were diagnosed with GDM. The higher intake of saturated (P=0·005) and trans-fats (P=0·009), as well as the percentage of energy content from added sugar (P=0·02), and lower intake of fruit and vegetable fibre (P=0·03) were individually associated with an increase in fasting glucose after multiple statistical adjustments, reinforcing that the excess of fats also influences the maternal glycaemia in healthy pregnant women. In subjects with a family history of type 2 diabetes, a high fibre intake from vegetables has been associated with reduced insulin resistance (P=0·0008) and increased insulin sensitivity (P=0·01) after adjustment. The increased risk of GDM was associated with a lower percentage of carbohydrate and higher fat. These data corroborate the findings of this study, showing that the disproportion in macronutrients during pregnancy may not only affect the maternal glycaemia, but may also be a predictive factor for the development of GDM in healthy pregnant women( Reference Ley, Hanley and Retnakaran 38 ).
In this study, there was no difference between the CG and IG. This result shows that when a pregnant woman has good adherence to the alimentary plane, regardless of the method of dietary orientation, the goal of treatment of DM is achieved. Nutritional therapy is recognised as essential in the treatment of DM. The ideal diet for a pregnant woman with GDM provides adequate nutrition for fetal growth and maternal health, reducing the chance of hyperglycaemia and excessive weight gain( 20 ). Good adherence to nutritional therapy may improve glycaemic control and reduce the chance of macrosomia and the need for surgical delivery( Reference Ali, Jarrar and El Sadig 3 , Reference Lima, Rosado and Ribeiro Neves 8 , Reference Walker 39 - Reference Carvalho, Netto and Zach 41 ). In addition, nutritional counselling during pregnancy, favouring the adoption of healthy eating patterns, may reduce the future risk of type 2 diabetes in women( 21 ).
No studies were found that evaluated the intake of PF and UPF in pregnant women with GDM, nor the association between the intake of these foods according to different methods of dietary guidance. The high intake of PF observed in women who had low adherence to their food plan at the second appointment emphasises the direct interference of nutritional advice on food intake and requires early initiation of this monitoring to advise women about the risks of excessive intake of these foods and so promote the reduction of intake by pregnant women.
Almost 100 % of pregnant women consuming UPF in the third trimester is alarming and deserves to be investigated, considering that the excessive intake of these foods creates health hazards( Reference Louzada, Martins and Canella 11 ). It is noteworthy that the high prevalence of intake of these products by pregnant women in this study also reflects the significant increase in intake of PF and UPF by Brazilians in the last 20 years, as described by Louzada et al. ( Reference Louzada, Martins and Canella 11 ), followed by decreased intake of in natura or minimally PF, within the context of nutritional transition of the Brazilian population( 29 ).
The search for strategies to reduce intake of PF is essential. Among them, actions on food and nutritional education directed by the Food Guide for Brazilian Population( Reference Della Líbera, Ribeiro and Santos 30 ) emphasise the adoption of food standards based on in natura or minimally PF to reduce and prevent chronic diseases. In this context, the nutritionist has a fundamental role to guide and therefore intervene in the consumption of these foods.
The consumption of PF and UPF was high among pregnant women with GDM and food consumption was similar among the study groups, regardless of the feeding orientation method used, suggesting that both methods can be used. The findings reinforce the importance of early nutritional assistance during prenatal care, since nutritional counselling during this period provided an improvement in glycaemic control, in addition to influencing the choice and food intake on the promotion of healthy nutritional practices, resulting in greater adherence to the proposed food plan.
The limitation of this study was the underestimation of quantities of food preparations which may have hindered the analysis of actual food intake of pregnant women, even with the care used in the study for the training, constant supervision of the team of researchers and utilisation of proper dietary assessment methods. However, in the analysis of the dietary data, the adjustment for obtaining the actual intake was performed to minimise possible errors in the analysis. Another limitation was the lack of sociodemographic information that was not present in the records of pregnant women that may have influenced the results. However, the data are unprecedented because the study was developed for pregnant women with GDM.
Acknowledgements
The study reported here was carried out with financial support from the Scholarship of Scientific Initiation Programme of the Universidade Federal do Rio de Janeiro (PIBIC/UFRJ); master scholarship of Coordenação de Aperfeiçoamento de Pessoal de Nível Superior (CAPES) and by CNPq Research Productivity (RP) fellowships to C. S.
L. B. G. d. S., E. L. R., P. d. C. P. and C. S. designed and planned the study; L. B. G. d. S., P. d. C. P., T. M. M., D. C. d. B. and C. S. collected the data; L. B. G. d. S., E. L. R., P. d. C. P., D. C. d. B. and C. S. analysed the data; L. B. G. d. S., E. L. R., P. d. C. P., T. M. M., T. P. d. P., D. C. d. B. and C. S. participated in the writing and revision of the final version of the manuscript.
The authors declare that there are no conflicts of interest.


