


Implications
A genomic selection breeding scheme will not achieve genetic gain for traits not measured in the nucleus with low relative economic weight, despite regular updating of the reference population. When the relative economic weight was 30%, several strategies to update a reference population increased genetic gain. To obtain phenotypic records from offspring of genotyped nucleus sires was shown to be a more powerful strategy to update the reference population than to genotype production animals. The increase in genetic gain due to an increase in the reference population depended on trait genetic parameters.
Introduction
Breeding companies that supply producers from different environments may face the challenge that each environment demands specific properties of the animals which results in a broad breeding goal including many traits. Several of these traits may not be measurable on the breeding candidates themselves, due to invasive measurement methods or that the breeding nucleus is managed under low disease incidence conditions, like is common practice for instance for pigs, poultry and salmon. Genomic selection (Meuwissen et al., Reference Meuwissen, Hayes and Goddard2001) can be used to improve traits that cannot be measured directly on selection candidates. The success of genomic selection is dependent on a reference population for all traits in the breeding goal. For traits not recorded on selection candidates, animals with phenotypes, as closely related to the breeding candidates as possible should be genotyped to constitute a reference population (Habier et al., Reference Habier, Fernando and Dekkers2007 and Reference Habier, Tetens, Seefried, Lichtner and Thaller2010; Pszczola et al., Reference Pszczola, Strabel, Mulder and Calus2012). For pigs and other species where multiplier herds are used to produce enough females and/or males to serve as parents of the commercial production animals, the production animals will be distantly related to the selection candidates (Dekkers, Reference Dekkers2007), which reduce the accuracy of genomic selection. To genotype production pigs and include them in the reference population may still be a successful strategy to obtain genetic gain for a trait not measurable on the candidates or closer relatives, when more relevant information is not available. An alternative could be to obtain records from offspring of already genotyped animals, like nucleus sires, to avoid the cost of further genotyping to update the reference population.
The aim of this study was to compare strategies to update a reference population for a trait not measured in the nucleus. The strategies were compared by their genetic gain and included (1) obtaining records from offspring of genotyped nucleus males, (2) genotype production animals with records or (3) combine the two approaches. Genetic parameters, numbers of sires in the nucleus and relative economic weight on the trait under investigation were varied to test the sensitivity of the results. The evaluation was based on computer simulations of a typical pig breeding scheme with population and trait parameters provided by Norsvin (www.norsvin.no).
Material and methods
The computer simulation was carried out in two phases: First, a historical population with random mating was simulated to create a base-population in mutation-drift-recombination-balance. This base-population was used to initiate a breeding population consisting of a breeding nucleus, a multiplier and a production tier. Economic weights, number of sires used in the breeding nucleus and genetic parameters were varied as well as the different genotyping strategies, to compare the genotyping strategies under varying trait and breeding goal assumptions.
Historical population
A historical population was simulated with an effective size of 200. To create mutation-drift-recombination balance, random mating was repeated for 2000 generations according to the Fisher-Wright population model (Fisher, Reference Fisher1930; Wright, Reference Wright1931). Each simulated individual had a diploid genome consisting of 18 pairs of 100 cM chromosomes to reflect the genome size of pigs. During the 2000 generations of random mating, polymorphisms and recombinations were sampled at random positions as in (Sonesson and Meuwissen, Reference Sonesson and Meuwissen2009) such that each mutation occurred at a unique position and created a bi-allelic single nucleotide polymorphism (SNP). After the 2000 generations, 100 SNPs of each chromosome, among the SNPs with a minor allele frequency above 0.05, were randomly assigned as quantitative trait loci (QTL). From the remaining SNPs, the 500 SNPs with the highest minor allele frequencies from each chromosome were assigned as neutral markers. The marker genotypes were assumed known for genotyped animals, while the QTL genotypes were assumed unknown for all individuals when the genetic evaluation was performed. The total number of markers used for genomic evaluation was hence 9000 (500 markers×18 chromosomes), which is considerably lower than what is usually used for genomic selection purposes. However, the linkage disequilibrium between adjacent markers was on average r 2=0.453, higher than expected from the low marker density (Lillehammer et al., Reference Lillehammer, Meuwissen and Sonesson2011b) and similar to what would be expected if using a 50k SNP chip on a pig population (Du et al., Reference Du, Clutter and Lohuis2007).
Breeding population structures
It was assumed that the population structure contained a breeding nucleus, where selection was performed, a multiplier to produce semen to distribute to a third tier, which was a production tier.
The nucleus tier consisted of 50 sires and 2000 dams, which gave 20 000 offspring, from which 2000 were male offspring and 18 000 were female offspring. Male offspring were genotyped and genomic selection was used to select the best 50 sires for the next generation. Selection of dams was based on conventional BLUP breeding values (Henderson, Reference Henderson1984). The unequal distribution of males/females among the offspring in the nucleus was used to ensure that only one male was selected from each full-sib family and to mimic a situation where a random male from each selected litter is regarded as selection candidate and genotyped. This is in accordance with the practice in Norsvin (www.norsvin.no), where 1–2 randomly selected males from each of the litters with the highest mid-parent-mean breeding value are tested at a test-station and genotyped to serve as selection candidates in a genomic selection breeding program. All animals born in the nucleus received phenotypic records for a nucleus trait (N-trait) before they were candidates for selection. The N-trait reflected hence an index of traits, measured directly on the candidates, that formed the ‘old’ breeding goal before the new trait, a production trait (P-trait) was introduced as a trait measured on production animals only. The P-trait could be any trait not measurable in the nucleus and with low or no genetic correlation to the other breeding goal traits.
The multiplier tier consisted of 50 sires and 200 dams, giving birth to 200 male offspring and 400 female offspring each generation. Multiplier animals did not have phenotypes or genotypes. The sires were selected among males born in the nucleus tier, while the dams were recruited from the females born in the multiplier tier, selected based on information on relatives since no own performance or genotype was available for these animals. The purpose of the multiplier tier in the simulation was to create a realistic distance in relationship between the nucleus animals and the production animals and to produce semen to disseminate as sires to the production tier.
In the production tier, 50 sires recruited from males born in the multiplier were mated to 5000 dams, recruited from the females born in the production tier to give 5000 new female offspring. The males were selected based on conventional BLUP breeding values, but with a low accuracy since these males had no own phenotype or offspring with phenotypes. Since each dam gave one female offspring, all born females in the production tier were used as dams for the next generation, that is no selection of females. Genetic gain in other tiers were hence dependent on the gain in the nucleus. The production females obtained one record each for P-trait after their offspring were born. P-trait records were hence not available on any selection candidates, but became available on females in the production tier when they had produced a litter.
True and estimated breeding values
QTL-effects for both traits were sampled from a multivariate normal distribution, assuming that all QTL affected both traits (even though the effect on one of the traits could be 0) and the QTL-effects were normally distributed, with mean 0 and variance
 $${\bf V=}{\equals}{1 \over {1800}}{\times}\left[ {\matrix{ {\sigma _{{g{\rm N}}}^{2} } & {\sigma _{{g{\rm N},g{\rm P}}} } \cr {\sigma _{{g{\rm N},g{\rm P}}} } & {\sigma _{{g{\rm P}}}^{2} } \cr } } \right]{\equals}{{\bf{G}} \over {1800}}$$
, where
$${\bf V=}{\equals}{1 \over {1800}}{\times}\left[ {\matrix{ {\sigma _{{g{\rm N}}}^{2} } & {\sigma _{{g{\rm N},g{\rm P}}} } \cr {\sigma _{{g{\rm N},g{\rm P}}} } & {\sigma _{{g{\rm P}}}^{2} } \cr } } \right]{\equals}{{\bf{G}} \over {1800}}$$
, where
 $$\sigma _{{g{\rm N}}}^{2} $$
is the genetic variance of N-trait,
$$\sigma _{{g{\rm N}}}^{2} $$
is the genetic variance of N-trait,
 $$\sigma _{{g{\rm P}}}^{2} $$
is the genetic variance of P-trait, and
$$\sigma _{{g{\rm P}}}^{2} $$
is the genetic variance of P-trait, and
 $$\sigma _{g} {\rm N},\,_{g}\!{\rm P}$$
is the genetic covariance between the two traits, adjusted to give a genetic correlation between N-trait and P-trait of either −0.3, 0 or 0.3. The total number of QTL is 1800. True breeding values (TBVN and TBVP) were calculated as the sum of the QTL effects for each trait for each individual. Phenotypes (y
i
) for N-trait and P-trait were sampled on the candidates or production animals, respectively, using the formula
$$\sigma _{g} {\rm N},\,_{g}\!{\rm P}$$
is the genetic covariance between the two traits, adjusted to give a genetic correlation between N-trait and P-trait of either −0.3, 0 or 0.3. The total number of QTL is 1800. True breeding values (TBVN and TBVP) were calculated as the sum of the QTL effects for each trait for each individual. Phenotypes (y
i
) for N-trait and P-trait were sampled on the candidates or production animals, respectively, using the formula $y_{i} {\equals}TBV_{i} {\plus}e_{i} $
, where e
i
was a normally distributed random residual with mean 0 variance
$y_{i} {\equals}TBV_{i} {\plus}e_{i} $
, where e
i
was a normally distributed random residual with mean 0 variance $\sigma _{{ei}}^{2} $
.
$\sigma _{{ei}}^{2} $
.
For genotyped animals, genomic breeding values were obtained by the GBLUP method (Meuwissen et al., Reference Meuwissen, Hayes and Goddard2001) with the single trait statistical model:
 $$y_{{ij}} =\mu _{j} {\plus}\mathop{\sum}\limits_{k{\equals}1}^{9000} {X_{{ik}} a_{{kj}} {\plus}e_{{ij}} } $$
, where y
ij
was the phenotypic record for individual i, trait j;
$$y_{{ij}} =\mu _{j} {\plus}\mathop{\sum}\limits_{k{\equals}1}^{9000} {X_{{ik}} a_{{kj}} {\plus}e_{{ij}} } $$
, where y
ij
was the phenotypic record for individual i, trait j; $\mu _{j} $
the mean value for trait j; X
ik
the marker genotype; a
kj
the random effect of the kth marker on trait j, with variance equal to the total genetic variance for trait j divided by 9000 (the total number of SNP-markers); e
ij
was the residual for individual i, trait j. Non-genotyped selection candidates (females and multiplier males) got conventional BLUP breeding values, estimated by the animal model:
$\mu _{j} $
the mean value for trait j; X
ik
the marker genotype; a
kj
the random effect of the kth marker on trait j, with variance equal to the total genetic variance for trait j divided by 9000 (the total number of SNP-markers); e
ij
was the residual for individual i, trait j. Non-genotyped selection candidates (females and multiplier males) got conventional BLUP breeding values, estimated by the animal model: $y_{{ij}} =\mu _{j} {\plus}u_{{ij}} {\plus}e_{{ij}} $
, where u
ij
the breeding value for animal i, trait j, and other parameters were defined as above. It was assumed in this study that pedigree was known for all animals in all tiers. When performing selection, the total breeding value for individual j (EBVtot,j
) was calculated as (EBVtot,j
=ewP×EBVPj
+ewN×EBVNj
), where ewP and ewN represent the economic weights for P-trait and N-trait, respectively, and EBV
ij
denoted the estimated breeding value for trait i, individual j, estimated by single trait BLUP or GBLUP model. Selection was performed by truncation on EBVtot.
$y_{{ij}} =\mu _{j} {\plus}u_{{ij}} {\plus}e_{{ij}} $
, where u
ij
the breeding value for animal i, trait j, and other parameters were defined as above. It was assumed in this study that pedigree was known for all animals in all tiers. When performing selection, the total breeding value for individual j (EBVtot,j
) was calculated as (EBVtot,j
=ewP×EBVPj
+ewN×EBVNj
), where ewP and ewN represent the economic weights for P-trait and N-trait, respectively, and EBV
ij
denoted the estimated breeding value for trait i, individual j, estimated by single trait BLUP or GBLUP model. Selection was performed by truncation on EBVtot.
Variations between tested scenarios
The sensitivity of the results to the assumptions in the simulation study was tested by varying the size of the breeding nucleus, relative economic weights of the two traits, heritability of P-trait and genetic and phenotypic correlation between P-trait and N-trait. These variations are summarized in Table 1. The initial selection criterion was an index where P-trait, the trait measured on the production animals, received 10% and N-trait, the trait measured directly on the candidates in the nucleus, received 90% of the economic weight. As alternative scenarios, increasing the relative weight of P-trait to 20% to 50% was tested. The remaining weight was put on N-trait. The heritability of N-trait was assumed to be 0.25, while P-trait had heritability of either 0.1 or 0.25. The two traits were either negatively correlated (genetic and phenotypic correlation was −0.3), uncorrelated or positively correlated (genetic and phenotypic correlation was 0.3). The number of sires used in the nucleus was also varied. An initial number of 50 sires per generation were used, corresponding to the practice in Norsvin breeding nucleus. As alternative scenarios, the size of the nucleus was set to 20 or 100 sires. Without updating the reference population, accuracy of genomic breeding values is expected to drop quickly over few generations (Sonesson and Meuwissen, Reference Sonesson and Meuwissen2009). A scheme with no strategy to update the reference population for P-trait (basic_0) was compared to genotyping 1000 or 5000 randomly chosen production animals per generation (denoted basic_1000 and basic_5000, respectively), where the term ‘basic’ indicates that no alterations to the breeding structure were performed to obtain data to update the reference population apart from additional genotyping of production animals. As an alternative strategy, sires of the production tier were selected among males born in the nucleus, which were already genotyped. When the genotyped sires got progeny with records, the average performance of 100 progeny was used as a postmortem progeny test (PMP) of the boar. The boar was hence used to update the reference population, which required pedigree recording of offspring of the boar but no additional genotyping. The progeny test records were available two generations after the boar had been selected, at a time where the boar was already culled. The progeny test records hence had no influence on the direct selection among boars but contributed to the selection accuracy for the next generation of boars by adding to the reference population. This scheme was denoted PMP_0 when not genotyping the production animals with records directly but only rely on the PMP to update the reference population. When production animals with records were individually genotyped and included in the reference population together with the sires with PMPs, the schemes were denoted PMP_x where x is the number of production animals with records genotyped per generation. When PMP and genotyping of production animals were combined, these came from different animals. A PMP for sire i was simulated as a pseudo record with accuracy as a progeny mean of 100 offspring, using the formula:
Table 1 Trait and population parameters in the tested scenarios
1 The value used unless other is specified.
2 A trait measured on production animals only.
3 A trait measured on the selection candidates in the nucleus.
 $$PMP_{i} ={1 \over 2}TBV_{i} {\plus}\sqrt {{{{3 \over 4}\sigma _{g}^{2} {\plus}\sigma _{e}^{2} } \over {100}}{\times}r_{i} } $$
, where r
i
is a random standard normal deviate.
$$PMP_{i} ={1 \over 2}TBV_{i} {\plus}\sqrt {{{{3 \over 4}\sigma _{g}^{2} {\plus}\sigma _{e}^{2} } \over {100}}{\times}r_{i} } $$
, where r
i
is a random standard normal deviate.
Genomic selection reference populations
The reference populations for the genomic predictions initially consisted of the base generation (2300 animals), which were assumed genotyped and progeny tested for both traits. The number of progeny assumed were 100 for the PMP-scenarios, the same as the number of progeny assumed behind the PMP in later generations. For the basic scenarios, the base generation reference population was assumed to have only one progeny each. Further, animals with genotypes and phenotypes were added to the reference population every generation. The number of new animals added to the reference population every generation is given in Table 2 for the main schemes. For N-trait, this means that all males born in the nucleus were added to the reference population. For P-trait, no animals with both phenotypes and genotypes were available to update the reference population within the basic_0-scheme. Using basic_1000 or basic_5000, 1000 or 5000 production animals with records were genotyped and added to the reference population for P-trait every generation. Within the PMP_x-schemes, the nucleus males were added to the reference-population when their offspring had got their P-trait-records. Further, x production animals per generation in addition to those contributing to the PMPs were genotyped and phenotyped and added to the reference population for P-trait.
Table 2 Overview of updates of the reference populations per generation for the different schemes
1 Average performance of 100 offspring.
All results presented are the averages of 50 replicates and genetic gains were estimated based on the average from generation 4 to 9 after selection started. The first 4 generations were excluded because the use of the base generation as the original reference population caused over-estimation of the genomic selection accuracy for these generations. Exclusion of the first generations also ensured that differences between schemes were due to differences in the strategies to update the reference population and not due to differences in the initial reference population. The strategies were compared on genetic gain for P-trait and genetic gain for N-trait was reported to show how much of the achieved gain in P-trait that was caused by increase in total genetic gain and how much occurred from shifting gain from N-trait towards P-trait.
Results
Figure 1 shows the effects of the relative economic weight of P-trait and genotyping strategy on the genetic gain of P-trait from generation 4 to 9, assuming genetic parameters as described in Table 1 as the initial values. Without a strategy for updating the reference population (basic_0), P-trait obtains a negative correlated response due to negative genetic correlation with N-trait. This negative response could not be prevented or reduced by increasing the economic weight of P-trait unless a strategy for updating the reference population existed, that is either use PMP or genotype production animals. The effects of the strategies to update the reference population were dependent on the economic weight of P-trait. With 10% weight on P-trait, none of the strategies had any effect, and the effects of all strategies increased with increasing economic weight of P-trait. Economic weight of P-trait had to exceed 30% to 40% for any of the strategies to completely remove the negative correlated response in P-trait due to selection for N-trait. For schemes without available PMPs, the economic weight had to be higher in order to avoid negative gains for P-trait. The ranking of the genotyping strategies was not affected by the economic weights. To genotype 1000 or 5000 production animals each generation without changing the population structure (basic_1000 and basic_5000) was the least effective strategy to update the reference population. A postmortem progeny test alone (PMP_0) was more effective, and the highest genetic gain for P-trait was obtained by combining the PMP test with genotyping of 5000 animals with records per generation (PMP_5000). Assuming a basic scheme without the use of PMP, genotyping 1000 production animals per generation generated 75% to 85% of the benefit that could be obtained by genotyping 5000 animals per generation. Genotyping production animals was two to three times as effective when a basic scheme was assumed than when PMP was performed. Combined with PMP, genotyping 1000 animals per generation generated 50% to 56% of the response that could be achieved if genotyping 5000 animals per generation, assuming a relative economic weight of 30% to 50% for P-trait. When economic weight of P-trait was 20% of the total breeding goal, 95% of the potential response was achieved by genotyping 1000 animals, while when economic weight of P-trait was 10% of the total breeding goal, no gain from genotyping production animals in addition to the PMP was achieved at all.
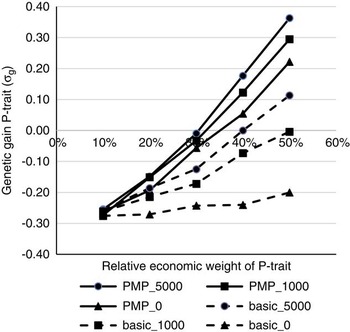
Figure 1 The effects of economic weights and number of genotyped production animals on genetic gain for P-trait, measured in genetic standard deviations. N-trait and P-trait were assumed negatively correlated (correlation was −0.3). The schemes denoted basic_x, where x is the number of genotyped production animals per generation, are schemes where production animals are grand-offspring of nucleus sires. In the schemes PMP_x, genotyping of x production animals per generation was combined with a postmortem progeny test for 50 genotyped sires per generation, also available to update the reference population.
Table 3 shows the effect of trait parameters on the genetic gain for the two breeding goals, using 30% weight on P-trait for the different tested strategies. A higher heritability of P-trait (0.25 v. 0.1) increased the effect of genotyping production animals when no PMP was assumed. When genotyping production animals was combined with PMP, the results were robust to changes in heritability. The correlation between the traits was less important, but a tendency was that genotyping of production animals had most impact when the traits were uncorrelated, probably because N-trait-records then contain no information about P-trait. Most of the additional genetic gain achieved for P-trait when genotyping production animals came at the expense of genetic gain for N-trait. Genotyping production animals had hence little effect on total genetic gain (results not shown), but shifted genetic gain from N-trait towards P-trait. The introduction of PMP, however, increased genetic gain for P-trait with only marginal changes (positive or negative) to N-trait.
Table 3 Effect of genotyping production animals on genetic gain (measured in σ g) for both traits under varying genetic parameters assuming 30% of the economic weight on P-trait and 70% of the economic weight on N-trait
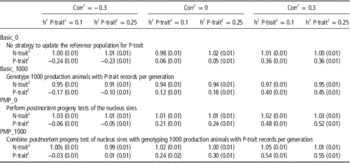
1 The genetic and phenotypic correlation between N-trait and P-trait.
2 A trait measured on production animals only.
3 A trait measured on the selection candidates in the nucleus.
Figure 2 shows that with a low economic weight of P-trait (Figure 2a), the number of sires used in the nucleus is not important neither for the level of genetic gain or for the effect of genotyping production animals, simply because this low economic weight does not facilitate any gain for P-trait, regardless of strategy or population parameters. When the economic weight of P-trait increased to 30% of the total breeding goal (Figure 2b), the benefit of genotyping production animals increased with decreasing number of sires used in the nucleus, showing that the advantage of a more accurate selection is higher if selection is more intense.
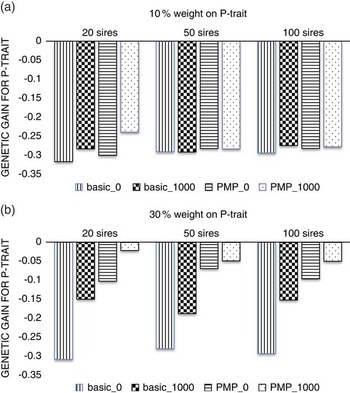
Figure 2 The effect of the number of sires used in the nucleus when P-trait had 10% (a) or 30% (b) weight in the breeding goal. The schemes denoted basic_x, where x is the number of genotyped production animals per generation, are schemes where production animals are grand-offspring of nucleus sires. In the schemes PMP_x, genotyping of x individuals per generation was combined with a postmortem progeny test.
Discussion
The total breeding goal in a pig breeding program usually consists of a wide range of traits (www.norsvin.no), leading to low relative economic weight on each trait. Most of the genetic gain is expected to come from traits that can be measured directly on the selection candidates (Lillehammer et al., Reference Lillehammer, Meuwissen and Sonesson2013a). Assuming a genomic selection breeding program, the genetic gain for other traits depends on having a large and regularly updated reference population for these traits. The aim of this study was to compare genetic gain obtained for a trait not measured in the nucleus using different strategies for updating this reference population. A broad breeding goal with many included traits will cause low relative weight of each trait, and the results showed that the availability of a reference population cannot increase genetic gain unless the economic weight is also considerable.
A relative weight of 30%will increase the potential improvement that can be made by having a good strategy for updating the reference population. The success under these conditions varied with trait parameters and genotyping strategy. The relationship between the reference population and the selection candidates is important for the accuracy of genomic breeding values (Pszczola et al., Reference Pszczola, Strabel, Mulder and Calus2012). Hence, assuming a population structure where phenotypes are obtained from distant relatives, the genomic breeding values will have lower accuracy. This can explain why performing a PMP for the already genotyped nucleus sires was more powerful than to genotype more distant relatives with records. The PMP strategy will also involve more phenotypic records. Even though the most effective strategy was to combine a PMP with genotyping of individuals with records, the effect of genotyping the production animals decreased when PMPs were available (PMP_1000 v. PMP_0), compared to when they were not (basic_1000 v. basic_0). Similarly, it was more effective to increase from 0 to 1000 genotypes per generation than from 1000 to 5000. Both these findings agree with previous studies that the larger the reference population becomes, the smaller is the gain from increasing it (Luan et al., Reference Luan, Woolliams, Lien, Kent, Svendsen and Meuwissen2009; Goddard et al., Reference Goddard, Hayes and Meuwissen2011). The number of genotyped production animals was in this study set to be quite high, comparing 1000 or more genotypes with no genotypes from production animals. The small benefit of genotyping 5000 per generation compared to 1000 indicates that the assumed numbers were high enough to not become the limiting factor for obtaining genetic gain. The number of genotyped animals needed to utilize the potential for genomic selection may however be dependent on the genome size, genetic architecture and estimation method for the genomic breeding values. When genetic gain for P-trait was increased by genotyping animals with P-trait records, the increase was accompanied by a decrease in genetic gain for N-trait, causing the improvement in total genetic gain to be considerably lower than the improvement in P-trait. This is in concordance with other studies considering more than one trait, where the access to phenotypes differ among the traits (Tribout et al., Reference Tribout, Larzul and Phocas2012; Lillehammer et al., Reference Lillehammer, Meuwissen and Sonesson2013b). To even out the contribution of the different traits to the total genetic gain, could however be a benefit for genomic selection in addition to the increase in total genetic gain, as genomic selection has the highest impact on traits that are most difficult to improve by conventional methods, that is traits that cannot be measured on selection candidates. To use PMPs to update the reference population gives, on the other hand, the possibility to increase genetic gain for P-trait without losing gain for N-trait, but still even out the contributions of the different traits to total genetic gain by increasing genetic gain for P-trait more than for N-trait.
Correlations from positive to negative were tested because the ‘new’ production trait was not specified and could have any correlation to the remaining breeding goal. Still, extreme values for the correlation were avoided due to that the existing breeding goal already consists of a variety of traits and because the use of field data in the reference population is most relevant for traits where no indicator trait measured in the nucleus can be used as selection criterion. Typical traits were the strategies tested in this study could be useful are sustainability, survival and resistance against specific diseases, traits that are only expressed under commercial conditions and/or late in life, and hence not available on nucleus animals. For most of these traits, PMPs could be obtained by keeping offspring of nucleus males under commercial-like conditions, but for instance disease resistance against infectious diseases may be too unpredictable to test that way and rather facilitate genotyping production animals from an environment with the disease outbreak.
The ranking of the strategies were not affected by the number of sires in the nucleus. However, it was more beneficial to genotype in addition to utilizing PMP when fewer sires were used. One reason is that the number of PMP-tested sires decreased with decreasing number of sires in the nucleus. An update of the reference population with 20 sires per generation may be too low to maintain high accuracy of the genomic breeding values over time (Lillehammer et al., Reference Lillehammer, Meuwissen and Sonesson2011a) and genotyping production animals in addition will then increase selection accuracy and hence genetic gain. When using 50 or 100 sires in the nucleus every generation, the contribution from the PMP-test is larger and further genotyping less beneficial. This effect could be prevented by performing the PMP test also for sires not used in the nucleus, but that were genotyped in the genomic selection breeding program as selection candidates. Another reason why genotyping production animals was more efficient when 20 sires were used in the nucleus than when 50 or 100 sires were used could be the increased intensity of selection when fewer sires were selected, since the number of male selection candidates were kept constant. The increase in selection intensity would increase rate of inbreeding as well as genetic gain, which should be taken into account when comparing schemes with different number of sires in the nucleus. However, the comparison between schemes using the same number of sires is still appropriate, showing that increasing the size of the reference population may be more beneficial at a higher selection intensity.
Varying the correlation between traits and heritability of P-trait was shown to have small effects on the benefit of genotyping production animals if economic weight was low (10%), but noticeable when economic weight of P-trait was increased to 30% (Table 3). Higher heritability of P-trait increased the effect of genotyping production animals with records, probably due to increased accuracy of these phenotypes and increased accuracy of selection for P-trait compared to N-trait, where parameters were kept unchanged. Without genotyping production animals (basic_0), the genetic gain obtained for P-trait is a correlated response from the selection on N-trait and is hence largely affected by the correlation between the two traits. The effect of genotyping production animals, however (the difference between basic_1000 and basic_0), was hardly effected by the correlation between the traits.
This study assumed a pure-bred pig population over all tiers, while in reality most production pigs are cross-bred. Genomic selection in a purebred nucleus for cross-bred production performance can be challenging and require a prediction model that fits breed-specific SNP effects (Ibanez-Escriche et al., Reference Ibanez-Escriche, Fernando, Toosi and Dekkers2009). To genotype production animals as proposed in this study, may hence be less straight forward than assumed here. However, the PMP-strategy could be used also to estimate cross-bred performance by producing cross-bred offspring of nucleus sires and measure their average performance, assuming that the pure-bred population is the sire-line or sire-of-dam-line. To obtain PMP-records for females would be challenging due to the limited fecundity of sows.
Within the era of genomic selection, opportunities to select for traits that were previously almost impossible to improve arise. However, even though genotyping is getting more affordable, genotyping animals purely for the purpose of including them in a reference population will be a considerable addition to the costs of the breeding program. Among the strategies tested in this study, assuming an already running genomic selection program in the nucleus, genotyping production animals will increase the genotyping costs, while obtaining PMPs of sires will only utilize already genotyped sires. However, obtaining the phenotypes may also be costly, dependent on the trait and the production system. Genotyping production animals may require fewer phenotypes than to obtain PMPs of genotyped sires, and hence be more cost-effective if the phenotypes are regarded costly to obtain (Tribout et al., Reference Tribout, Larzul and Phocas2013). In a cost-benefit perspective, genotyping production animals as a strategy has to be compared to other available strategies, like progeny or sib testing, which also can be combined with a genomic selection nucleus breeding program, or selection on the multiplier level to ensure that animals provided to a specific environment are suited to handle that environment (Skagemo et al., Reference Skagemo, Sonesson, Meuwissen, Lillehammer and Rye2014). Under the assumptions in this study, letting nucleus sires get progeny with offspring, that is to use a PMP test, and utilize that into a genomic selection scheme was more effective than to genotype more distant relatives with phenotypes. These alternatives were not compared to a conventional breeding scheme, and the overall gain from changing from conventional to genomic selection breeding was hence not estimated. Other studies have made that comparison under typical sib testing schemes (e.g. Nielsen et al., Reference Nielsen, Sonesson and Meuwissen2011; Tribout et al., Reference Tribout, Larzul and Phocas2012; Samorè et al., Reference Samorè, Buttazzoni, Gallo, Russo and Fontanesi2015). The results from these studies vary, probably due to differences in size of the reference population. Even though the focus of the present study was the impact of genotyping production animals, these animals could also be seen as test-sibs of candidates. If sib-test-records are combined with genotypes from the sires of the sibs, the sib-test-scenario is equivalent to a PMP scenario. In cases where male fecundity allows for more offspring than required to maintain the nucleus, using nucleus males as sires in environment with specific phenotypes could be a more cost-and-gain-effective strategy than to genotype production animals. However, if this is not possible due to limitations in male fecundity or other practical obstacles, or if phenotypes are unpredictable, like field outbreaks of diseases, genotyping production animals could be an option. In that case, the success of this approach is expected to be affected by genetic parameters as well as relative economic weight for the trait measured on the production animals.
Conclusion
The key parameter to obtain genetic gain for a trait not measured in the nucleus of a pig genomic selection scheme was shown to be economic weight. Further, to do a PMP test of already genotyped nucleus males was shown more effective than to genotype production animals in order to update the reference population.
Acknowledgments
This study was financed by the Norwegian Research Council project: Genomics for improved sustainability and competitiveness of Norwegian breeding programs on livestock, aquaculture species and plants, project no. ES498330. The project is led by Geno and partly financed by the other contributing partners: Norsvin, Aquagen and Graminor. All computations were performed at the Abel cluster at university of Oslo with support from the NOTUR project, project no. nn9203k. Relevant trait and population parameters were provided by Norsvin.


