


In 2016, the International Food Policy Research Institute estimated that 2 billion people globally suffer from micronutrient deficiencies and almost 800 million suffer from energy deficiency( 1 ). In East Africa, the prevalence of undernutrition is alarmingly high at 34 %( 2 ). Undernutrition, defined as micronutrient and/or energy deficiency, has consequences of both individual and societal detriments. Inadequate nutritional intake impairs cognitive and physical development and can thus limit an individual’s well-being and economic potential( 1 ).
Inadequate dietary quality is a major contributor to the high rates of malnutrition around the world and especially in low- and middle-income countries( Reference Green, Sutherland and Dangour 3 ). Diets in low-income settings are often of poor nutritional value, with low availability of micronutrients, minerals and other essential nutrients( Reference Kennedy, Pedro and Seghieri 4 ).
One approach to making healthy foods more accessible and affordable is through homestead food production, including home gardening. Home garden programmes typically include training in basic nutritional and agricultural concepts, in addition to provision of basic farming inputs. Programmes typically distribute seeds for nutritionally dense crops that are native to, or familiar in, the local environment. In more recent times, several studies have found positive associations between home gardening programmes and dietary intake or diversity( Reference Olney, Bliznashka and Pedehombga 5 , Reference Cabalda, Rayco-Solon and Solon 6 ).
Interestingly, home garden programmes may also benefit people other than the households that are enrolled. First, in many East African cultures, families that have access to food are expected to share portions with neighbours who are food insecure( Reference Kimambo, Hyden and Maghimbi 7 ). Second, people often observe and admire their neighbours’ gardens, and may try to mimic agricultural practices by starting their own garden. These are two pathways through which home garden programmes may improve nutritional intake and nutritional status not only among those enrolled in the programme, but also among those living in the broader programme area. In other words, the positive impacts of home garden interventions may spread from participant households to their surrounding communities through purchase (market and farm), sharing and producing.
To date, few studies have attempted to quantify or understand the positive externalities of nutrition-sensitive agricultural programmes, and none that we found have specifically examined peer interactions in home gardening such as neighbour influences and effects. If home gardens have substantial positive externalities, then current cost-effectiveness assessments may underestimate the true effectiveness the programmes. Additionally, the ease of adoption of home garden practices beyond the programme participants may be a useful indicator for the scalability and sustainability of programmes. The present study aimed to demonstrate predictors of (i) dietary diversity and (ii) adoption of home gardening among a population of women of reproductive age in rural Tanzania.
Methods
Study population
Four hundred and fifty-seven spillover households were randomly sampled from the Rufiji district of Tanzania in 2017. This district was the site of an ongoing cluster-randomized trial in which ten villages were randomly assigned to intervention (n 5) or control group (n 5) with a total enrolment of 500 households in each treatment arm. Characteristics of the trial have been described elsewhere( Reference Mosha, Canavan and Bellows 8 ). Briefly, intervention households received: (i) training and supplies to promote home gardening; (ii) nutritional counselling; and (iii) basic public health messages. Households recruited for the present cross-sectional analysis were randomly sampled from intervention villages in numbers proportional to the size of each intervention village.
Households in the intervention villages that had not previously been recruited to the parent cluster-randomized trial were randomly selected for recruitment in a 1:1 ratio of intervention households to non-participant households. The random sample was drawn from the Rufiji Health and Demographic Surveillance Site (HDSS) database, which was also used for the parent trial. The Rufiji HDSS covered 100 % of households in the study area at the beginning of the study period. Of the total 2511 households in the five intervention villages, the 504 households that had previously been recruited to the parent trial were excluded from the sample. From the remaining 2007 non-participant households, we randomly selected 500 households. Participants were screened for eligibility at the household level and invited to participate if the household: (i) had a woman of reproductive age with a child younger than 10 years of age; and (ii) had access to a plot of land where vegetables could be grown. If a selected household was not eligible for participation, up to two replacement households from a list of randomly selected households belonging to the same hamlet (sub-village) were visited and screened in its place. The replacement list contained only 930 as there were not enough households within each hamlet to allow a 2:1 ratio in the replacement household list. Replacement households were not sampled from other hamlets in the HDSS database, as this could prevent replacements from being representative of the initial household. Of the screened households, only 457 households met the inclusion criteria and were successfully recruited to the study, 222 of which recruited from the replacement household list. Questionnaires administered by trained interviewers on electronic tablets collected data on socio-economic and demographic characteristics, food consumption, home gardening and related domains.
Primary and secondary outcomes of interest
The primary outcome of interest was women’s dietary diversity. This indicator was derived from an FFQ adapted to the Tanzanian context. The locally adapted FFQ has been validated against a 24 h dietary recall in a previous study( Reference Zack, Irema and Kazonda 9 ). Participants were asked how many times per month they consumed a given food item, and responses to these questions were used to calculate daily frequencies of consumption for each item. Each food item consumed was grouped into one of ten food groups according to the US Agency for International Development’s Food and Nutrition Technical Assistance III Project (FANTA) guidelines( 10 ). Food items and food groups are listed in the Appendix. The respondent was counted as having consumed a food group if the sum of daily consumption frequencies of all food items within that food group was equal to or greater than one. For example, if a respondent reported eating rice twice per week and maize five times per week, the respondent was considered to have consumed the grain food group. Dietary diversity was modelled linearly as the number of food groups consumed daily out of ten. Additionally, according to FANTA recommendations, the consumption patterns were used to create an index for whether or not a participant consumed five or more out of ten food groups per day, which is considered the minimum dietary diversity score for women of reproductive age (MDD-W)( 10 ). This threshold measure is a recognized threshold indicator for whether a person’s diet is likely to achieve micronutrient adequacy( Reference Martin-Prével, Allemand and Wiesmann 11 ).
The secondary outcome of interest was adoption of home gardens among the women in the study population. Two indicators were used for this outcome: growing a home garden (yes/no) and ever having attempted to grow a home garden (yes/no).
Primary exposures of interest
The main exposures of interest for predicting dietary diversity were the dichotomous indicators of respondents’ participation in home gardening, as well whether the participants reported that a neighbour had a home garden. The primary exposure of interest for predicting the likelihood of adoption of home gardening or attempts at doing so was neighbours’ participation in home gardening, including whether a neighbour has a home garden and whether the neighbour currently grows crops in his/her home garden.
Statistical analysis
All analyses were conducted in the statistical software package SAS version 9.4. Descriptive statistics for demographic and nutritional variables were summarized using means and sd for continuous variables and proportions for categorical variables. We used linear models with robust se to evaluate predictors of continuous dietary diversity scores. To evaluate predictors of the odds of achieving MDD-W, growing a home garden or ever having attempted to grow a home garden, we used generalized logistic mixed models. Both sets of models included fixed effects for village to account for endogeneity by cluster.
Covariates were selected for inclusion into multivariate models based on a directed acyclic graph, shown in Fig. 1 ( Reference Textor and van der Zander 12 ). Data collected included woman’s age, marital status, wealth quintile, education, employment status, household size, pregnancy or postpartum status, household distance to nearest market and the number of food groups grown in the garden (Table 1).
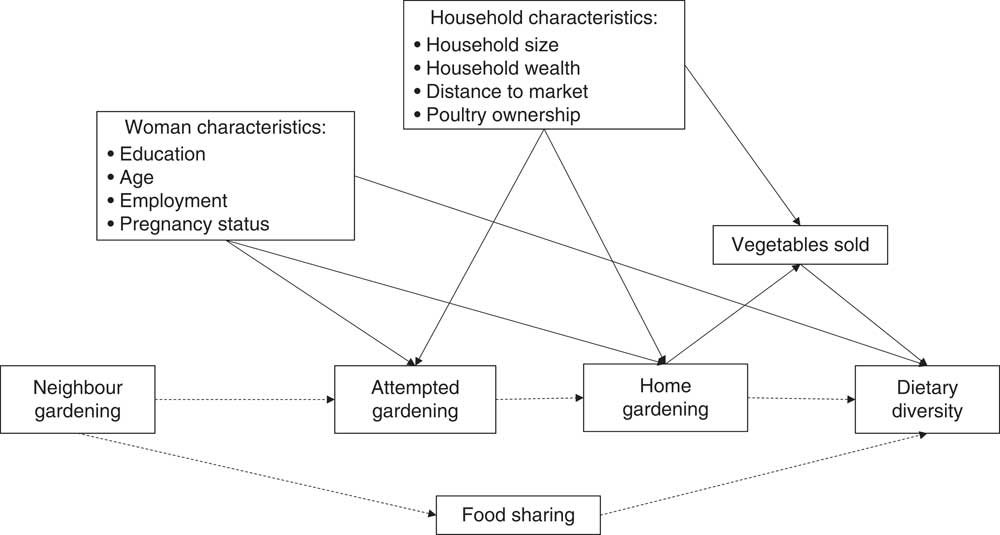
Fig. 1 Directed acyclic graph displaying the hypothesized relationship between neighbour home gardening and woman dietary diversity, represented by dashed pathways. Solid arrows represent relationships for which there is evidence in the literature
Table 1 Demographic characteristics of the study population of women of reproductive age (18–49 years) from rural Tanzania, 2017

* Tanzanian Shillings; exchange rate in 2017: 2257·76 TSh=$US 1.
Household socio-economic status was included as a wealth index derived from principal component analysis of household asset variables( Reference Filmer and Pritchett 13 ). Factor variables included were roof type, floor type, working electricity, toilet facility, and ownership of fridge, couch, fan and/or television.
Results
Table 1 reports characteristics of the survey respondents and corresponding households. The majority of the respondents were married (66·3 %) and had at least primary education (67·2 %). Many of the women were engaged in formal or informal employment (76·4 %). The average household size was 6·4 (sd 2·9) members. Few women had a BMI below 18·5 kg/m2 (6·6 %), but more than a quarter were of short stature with height less than 150 cm. Women lived, on average, 2·7 (sd 3·3) km from the nearest market and grew on average 2·3 (sd 0·9) food groups in their home gardens (Table 1)( Reference Kozuki, Katz and Lee 14 ).
Table 2 reports frequencies and means of the outcome variables. Mean dietary diversity was low, with women consuming on average 3·36 (sd 1·64) out of 10 possible food groups (Table 2). Only 23·4 % of respondents achieved daily minimum dietary diversity of five or more food groups per day. All participants reported consuming a starchy staple every day, and most respondents (62·8 %) consumed meat, poultry or fish every day. The respondents reported low consumption of nuts and seeds (0·7 %), dairy (5·3 %) and eggs (0·4 %). Almost one in three study respondents reported having attempted to grow a home garden (31·5 %; Table 2). However, out of the 457 women, only 18·6 % reported currently having a home garden. By contrast, 42·0 % of respondents said that their neighbour had a home garden and 34·6 % had neighbours who grew crops in their home garden.
Table 2 Outcome variables among the study population of women of reproductive age (18–49 years) from rural Tanzania, 2017

Based on the multivariate linear predictive model for dietary diversity, respondents who had a neighbour who grew crops in their home garden ate an average of 0·53 more food groups per day than those who did not (95 % CI 0·22, 0·83, P=0·0007; Table 3). Relative to the highest wealth quintile, the bottom three quintiles consumed approximately one food group less per day, on average (1st quintile: β=−0·75, 95 % CI −1·25, −0·24, P=0·004; 2nd quintile: β=−0·60, 95 % CI −1·10, −0·11, P=0·02; 3rd quintile: β=−0·95, 95 % CI −1·44, −0·46, P = 0·0001; 4th quintile: β=−0·35, 95 % CI −0·89, 0·19, P=0·2). The P for trend for wealth was 0·003.
Table 3 Predictors of dietary diversity score among the study population of women of reproductive age (18–49 years) from rural Tanzania, 2017

Ref., reference category.
* Bivariate model with fixed effects for village to account for clustering.
† The multivariate model is adjusted for whether respondent currently grows a home garden, whether respondent ever attempted to grow a home garden, woman’s age, education, employment and pregnancy status, household wealth quintile, household size, distance to nearest market, number of crops grown in garden and fixed effects for village.
Based on the multivariate logistic predictive model for minimum dietary diversity for women (MDD-W), respondents who had a neighbour who grew crops in their home garden were 2·71 times more likely to achieve minimum dietary diversity than those who did not (95 % CI 1·60, 4·59, P=0·0002; Table 4). Relative to the highest wealth quintile, the 1st and 3rd quintiles were 69–84 % less likely to achieve minimum dietary diversity (1st quintile: adjusted OR (AOR)=0·26, 95 % CI 0·11, 0·61, P=0·0002; 2nd quintile: AOR=0·53, 95 % CI 0·26, 1·09, P=0·08; 3rd quintile: AOR=0·27, 95 % CI 0·12, 0·65, P=0·003; Table 4). The P for trend for wealth was 0·005.
Table 4 Predictors of eating five or more food groups per day among the study population of women of reproductive age (18–49 years) from rural Tanzania, 2017
AOR, adjusted OR; ref., reference category.
* Bivariate model with fixed effects for village to account for clustering.
† The multivariate model is adjusted for whether respondent currently grows a home garden, whether respondent ever attempted to grow a home garden, woman’s age, education, employment and pregnancy status, household wealth quintile, household size, distance to nearest market, number of crops grown in garden and fixed effects for village.
Additionally, respondents who had a neighbour who grew crops in their home garden were also 1·75 times more likely to grow a home garden (95 % CI 1·02, 2·99, P=0·04) and 2·42 times more likely to ever have attempted to grow a home garden (95 % CI 1·53, 3·81, P=0·0002) compared with those who did not (Table 5).
Table 5 Outcomes predicted by neighbours growing crops in home garden among the study population of women of reproductive age (18–49 years) from rural Tanzania, 2017
AOR, adjusted OR.
* Multivariate model adjusted for woman’s age, education, BMI, employment and pregnancy status, household wealth quintile, household size, distance to nearest market, poultry ownership, and fixed effects for village.
† Multivariate model adjusted for whether respondent currently grows home garden, whether respondent ever attempted to grow a home garden, woman’s age, education, employment and pregnancy status, household wealth tertile, household size, distance to nearest market, number of crops grown in garden and fixed effects for village.
Discussion
Dietary diversity scores have been shown to be consistent and low-cost indicators for assessing dietary quality at the population level( Reference Kennedy, Pedro and Seghieri 4 , Reference Arimond, Wiesmann and Becquey 15 ). In countries like Tanzania, people in rural settings often derive most of their energy from nutrient-poor staple crops( 16 ). In line with these population-level trends, the dietary diversity of our study population was also quite low at 3·36 food groups out of 10 (Table 2). Less than one in four women were consuming the minimum dietary diversity of five food groups per day, which has been defined by the FAO as a marker of a micronutrient adequacy (Table 2)( 10 ).
In our study, wealth quintiles and woman’s age, education and employment status were predictive of dietary diversity. These findings are in accordance with findings from a recent study from Ethiopia that found woman’s age, marital status and parent’s education were significant predictors of higher dietary diversity in children( Reference Agize, Jara and Dejenu 17 ). These results suggest that socio-economic status may be related to availability and/or consumption of a diverse diet in the study population.
Previous studies have found that higher nutritional knowledge, women’s household decision-making power, better access to markets and higher on-farm production diversity are predictive of higher dietary diversity( Reference Agize, Jara and Dejenu 17 – Reference Koppmair, Kassie and Qaim 20 ). In a study from Benin, access to markets and on-farm diversity were predictive of dietary diversity( Reference Bellon, Ntandou-Bouzitou and Caracciolo 19 ). In Malawi, farm production diversity was predictive of higher dietary diversity among smallholder farm households( Reference Koppmair, Kassie and Qaim 20 ). However, neither distance to market nor the number of food groups grown were significant predictors of dietary diversity in our analysis.
Several studies have linked women’s nutrition knowledge and empowerment with diet. A study from Ethiopia showed that higher nutritional knowledge was predictive of higher dietary diversity( Reference Agize, Jara and Dejenu 17 ). In Ghana, women’s participation in household decision making predicted higher dietary diversity( Reference Amugsi, Lartey and Kimani 18 ). However, the present study did not collect data on nutritional knowledge or women’s empowerment and we therefore did not evaluate these as covariates.
To understand the drivers of dietary diversity, we wanted to examine what propelled the respondents to grow a home garden, or at least attempt to do so. Having attempted to grow a garden is arguably indicative of an interest in improving diet and/or health outcomes: an attempt at growing a garden can be thought of as a measure of effort or interest in nutrition by the individual. Growing a home garden, however, was not predictive of dietary diversity (Tables 3 and 4). We suspect that simply having a home garden may not be enough to improve dietary diversity if other barriers, including high start-up costs (e.g. cost of purchasing seeds, fencing, fertilizer, watering or watering cans), lack of agricultural know-how or low awareness of healthy crops, prevent a woman from being able to successfully cultivate crops in her garden.
Interestingly, respondents who lived in the vicinity of someone growing crops in a home garden had significantly higher dietary diversity and were more likely to achieve a nutritionally adequate diet (measured as consuming five or more food groups out of ten per day; Table 4). These women lived next to a neighbour who not only had a garden but also successfully cultivated crops in his/her plot. In the Rufiji population, anecdotal evidence suggests that neighbours have high community cohesion and value reciprocity; they are often expected to share their food resources with neighbours who are food insecure. Our hypothesis that neighbour home gardening and community food sharing may play a role in dietary diversity is supported by a study from India, in which perceived community cohesion was shown to predict child dietary diversity among disadvantaged populations( Reference Barman and Vadrevu 21 ). By this logic, it is plausible that productive home gardens also improved neighbours’ dietary diversity if households who grow crops also share their produce with their neighbours.
The associations uncovered by the present study highlight an important and often overlooked aspect of homestead food production: home gardens can influence household and community diets both through consumption pathways and through income pathways. First, vegetables produced in a home garden can be consumed during daily family meals. Consequently, cultivation of nutritious crops such as vegetables may increase the consumption of vegetables by the farmer and his or her family. Our finding that home gardening influences the diet of neighbouring households suggests that this consumption pathway of improved diet may extend to the diets of immediate neighbours of garden households. Second, through homestead vegetable production, individuals may increase their purchasing power by selling vegetables at local markets or by saving the money they otherwise would have spent on food( Reference Jones, Shrinivas and Bezner-Kerr 22 ).
The present study had several limitations. We used a cross-sectional design, which limits our ability to make causal inferences. Additionally, dietary diversity is known to vary by season, suggesting our results could have differed had we conducted the FFQ at a different point in the year( Reference Olumakaiye 23 , Reference Omori and Greksa 24 ). Lastly, previous studies have linked women’s nutritional knowledge and empowerment to dietary diversity; however, we were not able to assess these covariates in our model.
Despite these limitations, our results indicate that a productive home garden can improve dietary diversity and possibly the nutritional status not just for the farmer, but also for neighbouring households, possibly due to a culture of community cohesion and sharing. The positive impacts of home gardens, such as access to vegetables and dietary diversity, may spread from farming households to their surrounding communities.
Our results suggest that there are substantial positive externalities of home gardens beyond those attained by the households that own and grow vegetables. This has important implications for home garden programmes implemented globally. In particular, cost-effectiveness evaluations of home garden interventions should factor in effects on the community as a whole, and not just for the individual households receiving homestead food production interventions.
Acknowledgements
Financial support: This work was supported by the IZUMI foundation. M.M.B. was supported by Aker Scholarship, the Ray Goldberg Fellowship in Global Food Systems, the Maternal Health Task Force and the Department of Global Health and Population at the Harvard T.H. Chan School of Public Health. D.M. was supported by Fogarty International Center of the National Institutes of Health. The funders had no role in the design, analysis or writing of this article. Conflicts of interest: None. Authorship: M.M.B. designed the study, prepared the data for analysis, conducted the analysis and wrote the initial manuscript draft. A.L.B. and C.R.C. designed the study and the parent study, prepared the data for analysis, and reviewed and revised the manuscript. K.M. managed fieldwork and data collection and reviewed and revised the manuscript. D.M., J.K. and H.M. conceptualized and designed the parent study, oversaw implementation of data collection, and reviewed and revised the manuscript. M.E.K. conceptualized the analysis and reviewed and revised the manuscript. W.W.F. conceptualized and designed the study and parent study, oversaw implementation of data collection, designed the study, and reviewed and revised the manuscript. All authors approved the final manuscript as submitted and agree to be accountable for all aspects of the work. Ethics of human subject participation: This study was conducted according to the guidelines laid down in the Declaration of Helsinki and all procedures involving human subjects were approved by the Institutional Review Board of Ifakara Health Institute in Tanzania, by the National Institutes for Medical Research (NIMR) in Tanzania and by the Institutional Review Board at Harvard University. Written informed consent was obtained from all subjects. In cases where individual participants or their parent or guardian was illiterate, witnessed informed consent was documented.
Appendix
Food groups included in dietary diversity score


