


The prevalence of hospital malnutrition is reported to be between 15 and 70 %( Reference Aghdassi, McArthur and Liu 1 – Reference Allard, Keller and Jeejeebhoy 9 ) depending on types of institutions and nutritional measurements. Regardless of prevalence, malnutrition negatively affects clinical outcomes and increases healthcare costs( Reference Allard, Keller and Jeejeebhoy 9 – Reference Sorensen, Kondrup and Prokopowicz 19 ) independently of other factors. Patients are often admitted malnourished, and pre-admission factors associated with this can be underlying illnesses, ageing and socio-economic situations( Reference Allard, Keller and Jeejeebhoy 9 , Reference Pirlich, Schutz and Kemps 20 , Reference Amaral, Matos and Teixeira 21 ). In-hospital factors may also be associated with the presence of hospital malnutrition and are related to age, underlying disease, polypharmacy, infections, procedures that impact food intake, lack of monitoring of nutritional status and lack of standardised nutrition-care protocols( Reference Pirlich, Schutz and Norman 5 , Reference Waitzberg, Caiaffa and Correia 8 , Reference Pirlich, Schutz and Kemps 20 – Reference Kondrup, Johansen and Plum 22 ). However, except for one report( Reference Kondrup, Johansen and Plum 22 ), all these studies were cross-sectional, assessing nutritional status at one time point during hospitalisation and change over time was not assessed. Kondrup et al. ( Reference Kondrup, Johansen and Plum 22 ) reported on the distribution of weight gain and weight loss from admission to discharge but did not rigorously assess potentially associated factors, other than describing nutritional care. Nutritional decline during hospitalisation is frequently observed in clinical practice and is independently associated with detrimental outcomes and prolonged length of stay( Reference Caccialanza, Klersy and Cereda 10 , Reference Braunschweig, Gomez and Sheean 23 , Reference Allard, Keller and Jeejeebhoy 24 ). However, there is very little understanding of the factors related to the actual in-hospital nutritional decline. The only studies we could find were in the field of oncology where concurrent radiotherapy and chemotherapy, advanced-stage tumours and tumour size were independently associated with weight loss ≥5 %( Reference Kiss, Isenring and Gough 25 , 26 ). As oncology patients account for only a fraction of patients admitted to acute-care hospitals, more studies are required to assess the factors associated with nutritional decline in the general patient population. Identifying these factors is important as it may assist clinicians in providing nutritional care to these patients.
Subjective global assessment (SGA) is a tool that assesses multiple aspects of nutritional status, taking into account declining body mass associated with reduced food intake, poor function and disease stress( Reference Detsky, McLaughlin and Baker 27 ). It is a well-validated tool used in various populations worldwide( Reference Pirlich, Schutz and Norman 5 , Reference Waitzberg, Caiaffa and Correia 8 , Reference Correia and Waitzberg 11 , Reference Baccaro, Moreno and Borlenghi 28 – Reference Sacks, Dearman and Replogle 33 ) and is associated with clinical outcomes( Reference Correia and Waitzberg 11 , Reference Lim, Ong and Chan 16 , Reference Braunschweig, Gomez and Sheean 23 , Reference Sacks, Dearman and Replogle 33 – Reference Wakahara, Shiraki and Murase 39 ). It has also been used to assess nutritional decline( Reference Braunschweig, Gomez and Sheean 23 , Reference Allard, Keller and Jeejeebhoy 24 ), and it was found that SGA deterioration was associated with prolonged length of stay independently of factors reflecting demographics, living accommodations and disease severity( Reference Allard, Keller and Jeejeebhoy 24 ). However, there are no studies assessing the factors associated with nutritional decline using SGA as the indicator of malnutrition. Furthermore, none of the studies assessing nutritional decline included patient-reported barriers to food intake and perceptions of food quality. The latter is important to assess as we found that malnourished patients, and those eating <50 % of their meals, reported several barriers to food intake, according to a validated questionnaire on barriers to food intake that included perceptions of food quality( Reference Keller, Allard and Vesnaver 40 ). Considering that patient dissatisfaction with the food service is a patient-reported outcome( Reference Fallon, Gurr and Hannan-Jones 41 – Reference Messina, Fenucci and Vencia 43 ) associated with low food intake( Reference Caccialanza, Klersy and Cereda 10 ) and increased length of stay( Reference Stanga, Zurfluh and Roselli 42 , Reference Messina, Fenucci and Vencia 43 ), we thought that it would be important to assess this in our study. Therefore, the aim of this study was to determine the factors that are associated with in-hospital nutritional decline, including patient-reported barriers to food intake, in medical and surgical patients using SGA as a measurement of nutritional status.
Methods
Study sample
We included patients from a larger prospective multicentre cohort study with a hospital stay of at least 7 d, discharged alive and with nutritional assessment performed at admission and discharge( Reference Allard, Keller and Jeejeebhoy 9 ). A 7 d threshold was chosen to define the study subgroup based on clinical experience and literature( Reference Braunschweig, Gomez and Sheean 23 ). The large cohort study was conducted from July 2010 to February 2013 and included 1022 adult patients (≥18 years) admitted for ≥2 d directly to the surgical and medical wards of the eighteen participating acute-care hospitals (eleven academic, seven community) from eight provinces across Canada. The main aim of this study was to determine contributors to malnutrition at hospital admission and their impact on hospital length of stay( Reference Allard, Keller and Jeejeebhoy 9 ). Hospitals were made aware of the study by various modes of communication (national conferences, direct contact with hospital dietitians and administrators and the CMTF website (www.nutritioncareincanada.ca)). Patients were excluded from the cohort study if they were admitted directly to the intensive care unit (ICU), obstetric, psychiatry or palliative wards or admitted to a medical day unit. Each hospital with >200 beds recruited sixty patients and those with <200 beds recruited forty patients. Patients were approached for consent and were enroled according to a strict protocol to avoid selection bias. Days of enrolment rotated from Monday to Friday, with Monday capturing the week-end admissions from Friday 17.00 hours to Monday 17.00 hours. Consecutive admissions were approached for consent and a maximum of seven patients were followed-up at the same time. Patients were monitored every 2nd day and the site coordinator was notified in advance of the discharge date for final measurements. Site coordinators captured data on paper forms at their respective hospital site from patients or medical charts, and entered the information into a database for future analysis. All site coordinators received standard training, a study manual and had the opportunity to discuss issues throughout the study with the national study coordinator. Questions and answers were shared electronically among all site coordinators. The study was approved by all the institutions’ administration and Research Ethics Boards, and all the participants or their alternative decision-maker signed a consent form.
Data collection
The nutritional status of the patients was assessed at admission and at discharge using two different measures. SGA( Reference Detsky, McLaughlin and Baker 27 ) was performed by uniformly trained coordinators to avoid inter-rater variability. SGA relies on the patient’s history regarding weight loss, dietary intake, gastrointestinal symptoms, functional capacity and the disease and its relation to nutritional requirements, as well as physical signs of malnutrition (loss of subcutaneous fat or muscle mass, oedema or ascites). Each patient was classified as well nourished (SGA A), mildly/moderately malnourished (SGA B) and severely malnourished (SGA C). The second indicator was body weight measured in light clothes using a chair scale (Seca 952 Chair Scale; Weigh and Measure, LLC). Assessment of both the parameters was completed within 48 h from admission to the hospital ward and just before discharge.
Change in nutritional status was assessed as a difference between nutritional measures at admission and at discharge. For SGA, we considered that patients with SGA A at admission and SGA B or C at discharge or SGA B at admission and SGA C at discharge had a decline in nutritional status. For SGA C, further deterioration was defined as having ≥5 % decrease in weight from admission to discharge. Change in weight was calculated as a percentage based on the difference in weight between discharge and admission divided by admission weight. Improved nutritional status was SGA C at admission moving to B or A and SGA B moving to A by discharge. Those who did not have any changes in their SGA classifications during admission were considered stable.
Data regarding demography, contact information, living arrangements, primary admission diagnosis, presence/absence of cancer, Charlson Comorbidity Index (CCI)( Reference Charlson, Pompei and Ales 44 ) and number of medications were collected at admission. The CCI predicts the 10-year mortality for a patient who may have a range of comorbid conditions (up to twenty-two conditions), where each condition is assigned a score of 1, 2, 3 or 6, depending on the risk of dying associated with it. Scores are summed to provide a total score to predict mortality. The higher the score, the more likely the predicted outcome will result in mortality or higher resource use. It is used in this study as an index of disease severity. Due to the variety of diagnoses, these were classified under eleven broad standard categories by the authors and, in the large cohort( Reference Allard, Keller and Jeejeebhoy 9 ), were compared with parts of the database of the Canadian Institute for Health Information Discharge Abstract Database Research Analytic Files (sampled from fiscal years 2009–2010 and 2010–2011). The diagnosis of infection covered all systems and was excluded for each specific system – for example, pneumonia was classified under infection and not respiratory; urinary tract infection was classified under infection and not genitourinary, etc. If there was more than one category for the same patient, a second and third diagnostic category was coded. During hospitalisation, patient charts were reviewed approximately every 2 d: new diagnostic categories, new diagnosis of cancer, days of dietitian visits, diet orders (including nil per os (NPO) and nutrition support), number of daily medications for the first 10 d of admission, surgical interventions and ICU stays were recorded. At discharge, CCI was evaluated again to assess potential changes in medical condition during hospitalisation. Length of hospital stay was recorded as the difference (days) between the date of discharge or transfer to another hospital and the date of admission to the hospital.
In-hospital dietary intake was estimated using patient-generated nutritionDay™ Forms( Reference Hiesmayr, Schindler and Pernicka 45 , Reference Schindler, Pernicka and Laviano 46 ) completed by the patient at the noon mealtime for up to 3 d of the 1st week of stay.
A patient survey regarding barriers to food intake and meal satisfaction during hospitalisation was completed by patients just before discharge. This survey was slightly modified from a previously published survey by Naithani et al. ( Reference Naithani, Thomas and Whelan 47 ) to make it suitable for Canadian hospitals( Reference Keller, Allard and Vesnaver 40 ). It included six domains that contained statements (items) related to different barriers to food access in hospitals. Patients were asked to choose a response on a Likert-like scale (reflecting level of agreement) for each item. As only small proportions of participants used extreme response options, each item was reduced to a binary (‘affected’ v. ‘not affected’) and the score for a domain was calculated as a sum of ‘affected’ items( Reference Keller, Allard and Vesnaver 40 ). Patients with incomplete set of answers for a domain were excluded. Affected items were summed into a domain score, with higher scores indicating that more barriers were experienced by the patient. In addition, proportions of ‘affected’ respondents for separate items in domains where scores were significantly associated with nutritional deterioration were used in this analysis. Choice and organisational domains were excluded as these domains reflected hospital-level organisational problems not directly relevant to the present study( Reference Naithani, Thomas and Whelan 47 ) (online Supplementary Appendix 2).
Statistical analysis
Distribution of continuous and count variables was assessed by graphical methods. Mean values, standard errors, medians and first and third quartiles were calculated for continuous and count variables, and percentages were calculated for categorical variables.
Factors potentially related to deterioration in nutritional status were identified based on clinical experience and literature review, focusing specifically on demographic, disease-related and nutrition-related measures, medical interventions, self-reported food intake and barriers to food intake. Factors used in the models included the following: age, sex, number of diagnostic categories (one category v. two or more), presence/absence of cancer, CCI at admission (dichotomised at two), indicators of a new infection during hospitalisation, ICU stay, median number of daily medications, presence/absence of surgical procedure during hospitalisation (ward-type proxy), admission SGA, admission BMI, average food intake (<50 v. ≥50 % of the main plate) during the 1st week of hospitalisation (online Supplementary Appendix 1) as well as patient self-report of feeling hungry, physical barriers to food intake, food quality and effects of illness and treatment on food intake. The indicator of an increase in CCI from admission to discharge was used to account for deterioration in medical condition.
Associations between continuous factors of interest and nutritional deterioration were tested using independent samples t test or the Wilcoxon–Mann–Whitney test as appropriate. Associations with categorical variables were tested using the χ 2 and the Fisher exact (for contingency tables with counts <5) tests. Bonferroni correction was used for multiple tests. Following that, all predictors of interest were tested in multiple logistic regression models. Based on bivariate analyses, all the models included SGA at admission, presence of surgical procedure indicator and the interaction term between surgical procedure and predictor of interest to account for differences in effect size between medical and surgical subgroups; in addition, all the models included a random intercept to account for hospital effect. From these models, marginal odds ratios of nutritional deterioration were calculated for each factor of interest for medical and surgical patients by specifying contrasts using the ESTIMATE statement in SAS. Two sensitivity analyses were carried out, in which low prevalence predictors (ICU stay and change in CCI) were considered. All the analyses were performed using SAS 9.4 software (SAS Institute Inc). All the tests were two-sided, and a P value <0·05 was considered to be statistically significant.
Results
Study sample and patient characteristics
Of the 1022 patients who participated in the large cohort study( Reference Allard, Keller and Jeejeebhoy 9 ), 478 had lengths of stay ≥7 d and were discharged alive, and, of these, 424 patients had admission and discharge SGA assessments that could be used to determine the outcome variable. Patients not included in the analysis due to missing values had lower length of stay (median 9 d compared with 11 d for those included, P value=0·04) but did not differ in terms of age, admission BMI, admission SGA, number of diagnostic categories and frequency of cancer.
Demographic, disease-related and nutritional characteristics of the study sample along with diagnostic categories are presented in Table 1. The median length of stay was 11 d. The median age was 68 years and 52·2 % were males: 38·4 % had a surgical procedure, 22·2 % had a diagnosis of cancer and 42·0 % had more than one diagnostic category. The most common diagnostic category was gastrointestinal, followed by infection and respiratory. Overall, 50·9 % were malnourished at admission (SGA B or C), 173 (40·8 %) patients had dietitian visits during hospitalisation and sixty-nine (16·3 %) patients received some form of nutritional support (forty-one patients oral, seven enteral, twelve parenteral and nine some combination of those).
Table 1 Characteristics of medical and surgical patients for categorical and continuous predictors (Medians and quartiles; numbers and percentages)
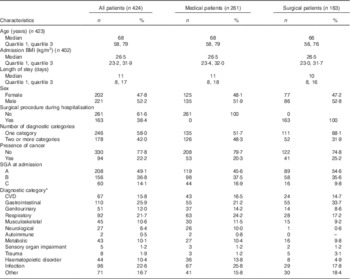
SGA, subjective global assessment.
* Number of patients with this diagnostic category out of the total number of patients in the cohort; some patients have more than one category.
Compared with the surgical group, the medical group had a higher proportion of patients with two or more diagnostic categories (P value=0·0009), neurological (P value<0·0001) and haematopoetic (P value=0·004) diagnoses, and a lower proportion of patients with gastrointestinal diagnoses (P value=0·004) (Table 1). The patients who had a surgical procedure compared with those who did not also differed in proportions of patients with SGA C, genitourinary, respiratory and infection diagnoses, but the differences were not statistically significant, possibly due to the small sample size.
Among all the patients, 157 (37·0 %) had changes in SGA while staying at the hospital: eighty-three (19·6 %) deteriorated (14·6 % from SGA A to B/C and 5 % from SGA B to C) while seventy-four (17·4 %) improved (10·6 % from SGA B to A, 6·8 % from SGA C to B/A). One patient with SGA C at admission and at discharge had a weight loss ≥5 %. This patient had ‘presence of oedema’ recorded at admission. Considering that only one patient in that category had weight loss and that weight loss may have been due to fluid loss rather than due to nutritional decline, this patient was included in the SGA C stable category; 267 (63·0 %) patients had no changes in their nutritional status from admission to discharge; among them, 146 (34·4 %) were SGA A, ninety (21·3 %) were SGA B and thirty-one (7·3 %) were SGA C.
Factors associated with nutritional deterioration
The results of the bivariate analyses for factors potentially associated with nutritional deterioration are presented in Table 2, and the results of multiple logistic regression analyses are presented in Table 3. The analysis was restricted to the subset of patients with admission SGA A and B (n 364) who had non-missing observations for each variable. The highest percentage of missing observations was present in the patient mealtime survey variables (7–11 %); in addition, five out of ten remaining variables had 4 % (admission BMI) or less (sex, admission CCI, change in CCI, food intake, age and number of medications) missing values. For the <50 % food intake indicator, ten out of fourteen missing observations were due to NPO, clear fluid only and enteral/parenteral nutrition orders throughout the 1st week of stay. Sensitivity analyses were carried out imputing values <50 % food intake for these observations.
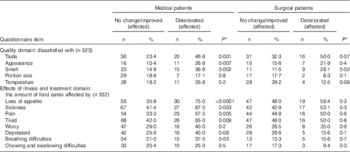
Table 2 Deterioration in nutritional status in medical and surgical patients classified on admission as only subjective global assessment (SGA) A and BFootnote * (Mean values with their standard errors; medians and quartiles; numbers and percentages; n 364)
ICU, intensive care unit.
* P values are given for t test for age, BMI and number of medications, the Wilcoxon–Mann–Whitney test for length of stay and Patient Mealtime Survey domain scores and the χ 2 tests (or Fisher’s test if cell frequencies<5) for categorical variables.
†Total number of observations is presented in parentheses for variables containing missing values.
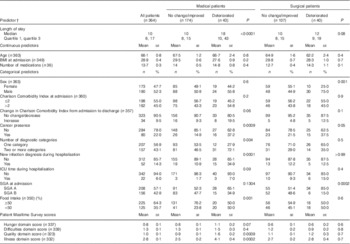
Table 3 Probability of deterioration in patients with admission subjective global assessment (SGA) A and BFootnote * (Odds ratios and 95 % confidence intervals; n 364)
Ref, reference category.
* Multiple logistic regression: all the models were controlled for admission SGA, presence of surgical procedure and included interaction between surgical procedure and predictor of interest and random term for hospital effect.
† Number of patients with complete data on variables used in the model.
The proportion of deteriorated patients was higher among those with SGA A at admission compared with SGA B (30·2 % compared with 13·5 % correspondingly, P value=0·0002); this finding was consistent for medical and surgical patients, but was more pronounced in the latter group (Table 2). Overall, the proportion of deteriorated patients was slightly higher in surgical compared with medical patients (27·2 v. 19·8 % correspondingly), but the difference was not statistically significant (P value=0·1).
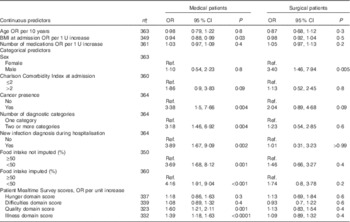
After controlling for SGA at admission, presence of surgical procedure and hospital effect, the following factors were statistically significantly associated with higher risks of deterioration in medical patients: lower admission BMI, presence of cancer, two or more diagnostic categories, new infection diagnosis while at the hospital, low food intake and more barriers (higher scores) on quality and illness domains reported in the patient survey. For surgical patients, only sex was found to be statistically significantly associated with nutritional deterioration: males were at higher risk for deterioration. Age, number of medications and hunger and eating difficulties domain scores from the patient survey were NS predictors in either group (Table 3). Sensitivity analysis including ten patients with food intake variables missing due to NPO or clear fluid diet orders produced results similar to those obtained in the main analysis: OR were 4·16 (95 % CI 1·91, 9·04) for medical and 1·74 (95 % CI 0·8, 3·78) for surgical patients. Additional bivariate analyses based on individual items within quality of food and illness domains of the patient survey showed that for medical patients nutritional deterioration was statistically significantly (after Bonferroni correction) associated with higher frequencies of the following: dissatisfaction with taste, appearance and smell of food as well as loss of appetite, sickness and pain affecting the amount of food eaten (Table 4). Portion size, temperature as well as tiredness, worrying, depression, breathing and chewing/swallowing difficulties were not associated with deterioration.
Table 4 Relationship between deterioration in nutritional status and individual items within quality and illness domains of Patient Mealtime Survey in medical and surgical patients with admission subjective global assessments A and B, n %, χ 2 and the Fisher exact tests as appropriate (Numbers and percentages)
* Not corrected. Bonferroni-corrected threshold for 0·05 level of significance is 0·01 for tests of quality domain items and 0·006 for tests of illness and treatment domain items.
Patients with ICU stay, increase in CCI and on artificial nutrition (enteral and parenteral) were in low numbers (and proportions) in the sample (<10 %); therefore, these predictors were not considered in the main multivariate analyses. Bivariate analyses showed that for both medical and surgical wards the deteriorated group had a higher proportion of patients with ICU stays and increase in CCI in comparison with no change/improved group, but the differences were not statistically significant.
Sensitivity analyses were carried out by adding the indicator of increase in CCI to all the models (online Supplementary Table S1) in order to test whether the association of the considered factors with nutritional decline was independent of deterioration in medical condition. The sensitivity models were very similar to the main ones. OR for disease-related predictors changed; this was expected because the disease status at admission and the disease deterioration were related parameters. OR for nutrition-related factors remained stable, providing evidence that their relationship with nutritional decline was not affected by disease deterioration as characterised by CCI.
Another sensitivity analysis was performed for multivariate models excluding patients who stayed in ICU (online Supplementary Table S2). The results were not different from those obtained in the main analyses.
The relationship between food intake, sex and nutritional deterioration was examined in more detail in order to clarify the association between sex and nutritional deterioration in surgical patients. Among patients with reduced food intake, the proportion of females was higher than the proportion of males at 62 v. 38 % (P value=0·009) in medical patients and 58 v. 42 % (P value=0·02) in surgical patients. For the medical group, both males and females had reduced food intake that was statistically significantly associated with deterioration. In the surgical group, the direction of the relationship was similar for both sexes, but the association was not statistically significant (online Supplementary Table S3).
Discussion
This study shows that factors associated with nutritional decline are different for medical and surgical patients: lower admission BMI, presence of cancer, two or more diagnostic categories, new in-hospital infection diagnosis, reduced food intake and more barriers of food quality and illness affecting food intake were significant in the medical group, whereas for the surgical group only male sex was significant. To our knowledge, there are no other studies comprehensively assessing such factors, particularly patients’ feedback on barriers to food intake, including quality aspects of the food, in both medical and surgical patients.
Our findings add significant information to the very small body of literature on factors associated with nutritional decline during hospitalisation. The only prospective study that we could find in general acute-care hospital populations( Reference Kondrup, Johansen and Plum 22 ) was descriptive and used a nutritional risk tool rather than a nutritional assessment tool. It assessed 750 randomly selected patients in three hospitals who were screened at admission and followed-up during their entire hospitalisation, re-assessing nutritional risk, weight changes and monitoring nutritional care. The objective of that study was to define the relative importance of various potential causes of inadequate nutritional care. If a patient was found to be not treated according to defined nutritional standards, the nurse responsible for the patient was interviewed in a standardised way. It was found that screening for nutritional problems was performed in only 60 % of the patients, and only 25 % of the patients found at nutritional risk received adequate amount of energy and protein. The main potential causes for inadequate nutritional care were lack of instructions to deal with the problem and lack of basic knowledge of dietary requirements and practical aspects of the hospital food service. In that study( Reference Kondrup, Johansen and Plum 22 ), no rigorous assessment of factors related to nutritional decline was completed, but the descriptions of the problems associated with screening, food intake, food service and food satisfaction suggest that these factors have a role in the nutritional care of these patients. There are a few more studies in oncology addressing the factors associated with nutritional decline but these studies were restricted to very specialised patient populations. For example, one( Reference Kiss, Isenring and Gough 25 ) was a retrospective study of ninety-six patients treated with high-dose palliative or radical radiotherapy for lung cancer. Weight loss between the start and up to 90 d from radiotherapy commencement was calculated. Associations between ≥5 % weight loss and risk factors of enteral feeding, demographic and clinical characteristics were assessed. The prevalence of weight loss ≥5 % was 31 % and of starting enteral feeding was 12 % when undergoing chemotherapy. Patients receiving concurrent chemotherapy were more likely to have ≥5 % weight loss and the odds of a patient with late-stage disease having ≥5 % weight loss were fifteen times greater than that for a patient with earlier stage disease. Another study( 26 ) in the head and neck cancer population found similar results with concurrent chemotherapy and disease stage being associated with a higher likelihood of enteral feeding. The authors suggested that identification of these factors associated with weight loss helped with the early identification of, and intervention for, patients at high nutritional risk in these oncological and mostly ambulatory patient populations. Following the commencement of enteral feeding, weight stabilised in the majority of patients, suggesting that a nutrition intervention can be effective in this group, although the impact of weight stabilisation on clinical outcomes remain unknown. Yet, oncology patients under active treatment comprise a small fraction of the population seen in acute-care hospitals, and these results are not generalisable, but still emphasise the need to identify factors associated with nutritional decline as a means of targeting treatment.
Other prospective studies on nutritional decline assessed its relationship with clinical outcomes, principally length of stay( Reference Caccialanza, Klersy and Cereda 10 , Reference Braunschweig, Gomez and Sheean 23 , Reference Allard, Keller and Jeejeebhoy 24 ), but did not look specifically at factors associated with the decline itself. Additional studies were cross-sectional( Reference Pirlich, Schutz and Norman 5 , Reference Waitzberg, Caiaffa and Correia 8 , Reference Pirlich, Schutz and Kemps 20 , Reference Amaral, Matos and Teixeira 21 ), assessing the presence of nutritional risk( Reference Amaral, Matos and Teixeira 21 ) or malnutrition( Reference Pirlich, Schutz and Kemps 20 ) at one time point, either at admission or during hospitalisation, and determining pre-admission or hospital factors associated with high nutritional risk or malnutrition. In those, illiteracy, older age, being male, living alone, lower education level, smoking, presence of malignant disease and polypharmacy were associated with being at nutritional risk or malnourished. One study( Reference Amaral, Matos and Teixeira 21 ) also showed that surgical patients were at decreased nutritional risk compared with medical patients. Therefore, our prospective cohort study extends this work further as, first, it assessed nutritional status rather than nutritional risk, second, it measured nutritional status at two time points and, third, it considered factors potentially related to the risk of in-hospital nutritional decline assessed over time rather than just at one time point.
Another unique feature of our study is related to patients’ feedback on their meals and barriers to food intake obtained in a standardised survey( Reference Naithani, Thomas and Whelan 47 ). High scores in food quality and severity of illness domains were significant and independent predictors in logistic regression models, indicating that poor satisfaction with food served in hospitals, particularly with its taste, appearance and smell, were associated with nutritional decline. Whether this reflects the quality of hospital food or the effect of illness or polypharmacy on perceptions such as taste and smell is unclear, but considering that reduced food intake is also associated with nutritional decline, it might be advisable to pay more attention to the quality of the food service, including the type and quality of food we are serving to our patients and consider that their perceptions of food may be affected by the underlying illness and, possibly, medications. Unfortunately, food and meal service are generally undervalued in patient care( Reference Keller, Vesnaver and Davidson 48 , Reference Diez-Garcia, de Sousa and Proenca 49 ). In this analysis, food and the barriers to intake of hospital food are a few of the factors that are potentially amenable to change. Literature suggests that we need to change the mealtime culture( Reference Keller, Vesnaver and Davidson 48 , Reference Dickinson, Welch and Ager 50 ) and identify areas for quality improvements based on patients’ feedback( Reference Fallon, Gurr and Hannan-Jones 41 , Reference Naithani, Thomas and Whelan 47 ), as patient satisfaction with food service is a patient-reported outcome( Reference Fallon, Gurr and Hannan-Jones 41 – Reference Messina, Fenucci and Vencia 43 ) that is associated with low food intake( Reference Amaral, Matos and Teixeira 21 ) and increased length of stay( Reference Stanga, Zurfluh and Roselli 42 , Reference Messina, Fenucci and Vencia 43 ). Many factors influence food intake such as illness, social, psychological and biological factors( Reference Naithani, Thomas and Whelan 47 , Reference Dickinson, Welch and Ager 50 , Reference Ahmed and Haboubi 51 ) as well as organisational and physical barriers to food intake( Reference Dickinson, Welch and Ager 50 , Reference Bell, Bauer and Capra 52 – Reference Jessri, Mirmiran and Johns 55 ). Some of these challenges can be addressed to improve patient nutritional care( Reference Hartwell, Shepherd and Edwards 56 – Reference Davidson and Scholefield 58 ). We also showed that high score in the illness domain was associated with nutritional decline. Food intake may be reduced due to loss of appetite from illness, feeling sick and having pain. In addition, being tired, worried, depressed or having breathing, chewing or swallowing difficulties may have an impact. Several of these factors can be corrected. Monitoring of food intake and identifying barriers to intake while at the hospitals appears to be prudent if it is coupled with interventions that remove these barriers, thus potentially minimising nutritional decline.
We found that factors associated with nutritional decline are quite different between medical and surgical patients. It is unclear why male sex is the only factor associated with nutritional decline in the surgical population. One study performed in general acute-care patients found that being male was associated with in-hospital under-nutrition risk( Reference Amaral, Matos and Teixeira 21 ) but this was not specific to surgery. One possible explanation for our results is the existence of protocols in surgery that standardise selection and treatment of patients before and after procedures. For example, malnourished patients are more likely to get some form of nutritional support to improve their nutritional status before surgery, and the implementation of perioperative nutritional care similar to the Enhanced Recovery After Surgery (ERAS) programme may minimise catabolism, support anabolism thereby reducing morbidity, length of stay( Reference Teeuwen, Bleichrodt and Strik 59 ) and, likely, nutritional decline. Otherwise, we did not find any particular difference between the characteristics of the medical and surgical patient groups to explain this. Whether males are more at risk of nutritional decline because of unmet higher nutritional requirements or because of physiological or psycho-social factors is not known.
The strength of this study was the prospective design, patient sample from several hospital centres across the country and the assessment of nutritional status using the ‘gold standard’ of SGA, which was performed by trained coordinators to ensure internal validity. Changes in SGA as a measure of changes in nutritional status was also used in a previous cohort study( Reference Braunschweig, Gomez and Sheean 23 ) and interventional studies( Reference Vashi, Popiel and Lammersfeld 60 , Reference Sokulmez, Demirbag and Arslan 61 ). We considered several potential social and disease-related factors and took into account confounders such as initial SGA, hospital site and surgical procedures. These unique strengths allowed us to more firmly establish the factors associated with nutritional decline during hospitalisation.
There are certain limitations to this study. It cannot confirm causality owing to the observational design. Specifically, it cannot clearly distinguish between the effect of factors such as disease severity, lower admission BMI, reduced food intake and barriers of food intake on nutritional decline, as well as the possible effect of nutritional decline contributing to these factors. The true relationship between these factors and deterioration in nutritional status would need to be clarified with interventional studies. Another limitation is that CCI may not well reflect disease acuity. CCI is a well-validated tool( Reference Charlson, Pompei and Ales 44 ) to measure disease/comorbidity severity; however, it is possible that it cannot capture all the changes in acuity from medical conditions equally as well as if we would use individualised disease-specific severity scoring systems. For such a large-scale study as ours, using disease-specific systems for analyses would not be feasible due to the high diversity of diagnoses in our patient population. Another limitation is that nutritional assessment was performed at two time points (admission and discharge) similar to other studies( Reference Caccialanza, Klersy and Cereda 10 , Reference Braunschweig, Gomez and Sheean 23 ), thus the time span between SGA assessments for different patients was not the same, and those staying longer may have had higher chances for nutritional decline, potentially introducing some bias in the estimates. Other limitations include presence of missing data, which reflects the reality of observational studies in a complex and busy healthcare system environment, as well as voluntary hospital enrolment and voluntary patient consent that may have introduced a bias. Due to sample size limitations, we could not conduct further multivariate analyses to examine the relationships between the considered factors. We also cannot fully exclude the possibility that there are unmeasured patient factors and heterogeneity in clinical practice and policies between institutions and provinces that may have contributed to nutritional decline.
Conclusion
In medical patients, low BMI at admission, concomitant illnesses and infection, reduced food intake and perceived low food quality and illness affecting food intake were associated with nutritional decline, whereas in surgical patients only male sex was a significant factor. Identification of some of these factors may assist in providing prompt nutritional care with the potential effect of preventing or reducing nutritional decline. Perhaps protocols or care pathways such as in surgery should be implemented in medical wards. However, specific nutritional interventions targeting specific patient populations will require randomised controlled trials if we are to assess true benefits.
Acknowledgements
The authors thank Elisabeth Vesnaver, Department of Family Relations and Applied Nutrition University of Guelph, for setting up the initial database and the study coordinators of the participating institutions: South West Health, Regional Health Authority A, Réseau de santé Vitalité Health Network, Jewish General Hospital, Centre de santé et de services sociaux du Sud de Lanaudière, Centre hospitalier de l’Université de Montréal, University Health Network, University of Waterloo, University of Guelph, Toronto East General Hospital, St Michael’s Hospital, McMaster University, Niagara Health System, University of Manitoba, Regina Qu’Appelle Health Region, University of Alberta, University of Calgary, University of British Columbia, Vancouver Island Health Authority.
The Canadian Nutrition Society had no role in the design, analysis or writing of this article. All the authors declare financial support from the Canadian Nutrition Society, which funded the study with unrestricted grants from Abbott Nutrition, Baxter, Fresenius–Kabi Canada, Nestle Healthcare Nutrition, Pfizer.
J. P. A., H. K. with the participation of K. N. J., M. L., D. R. D., L. G. and H. P. were involved in conception and design of the study; A. T., J. P. A., W. L. with the participation of H. K., K. N. J., M. L., D. R., L. G., L. P. and P. B. carried out the statistical analysis and interpreted the data; J. P. A. and A. T. drafted the manuscript; J. P. A., H. K., M. L., K. N., D. R. D., L. G., A. T., H. P. and W. L. carried out the critical revision of the article for important intellectual content; B. D. and A. T. carried out the data collection and assembly.
J. A., H. K., K. J., M. L., D. R. D., L. G., H. P. and P. B. are also members of Abbott Nutrition speaker bureau. There are no other relationships or activities that appear to have influenced the submitted work.
Supplementary material
For supplementary material/s referred to in this article, please visit http://dx.doi.org/doi:10.1017/S0007114515003244


