


In the pandemic era, the maintenance of good immunity is a pivotal factor in protecting against infection. Innate immunity does not adapt to previous infections, and it depends on recognition patterns to identify the harmful microorganisms(Reference Slaats, Ten Oever and van de Veerdonk1). Cells responsible for innate immunity originate from the primitive bone marrow cells, genetically programmed to recognise and react to foreign substances and activate adaptive immunity(Reference Toubi and Vadasz2). However, the innate immune system cannot always distinguish between self-debris and foreign substances. The disturbance of adaptive immune regulation causes an overactive innate and adaptive immune response, leading to the perpetuation of an immune-mediated metabolic dysfunction with increased risk from infections and other diseases associated with chronic inflammation. It is also related to chronic low-grade subclinical inflammation with ageing, known as inflammaging(Reference Barbé-Tuana, Funchal and Schmitz3).
Inflammaging is associated with genetic and environmental factors, although the pathophysiology of inflammaging remains unclear(Reference Custodero, Mankowski and Lee4). Endogenous and exogenous triggers stimulate inflammatory processes. Exogenous factors are lifestyle factors such as physical activity, smoking and diets, air pollution and an unsanitary environment. In contrast, endogenous factors include overproduction of reactive oxygen species, advanced glycated end-products, mitochondrial dysfunction and defective autophagy, resulting in cell debris accumulation, visceral adiposity and gut microbiota dysbiosis. The alteration of these environmental factors controls inflammaging that contributes to systemic inflammation. However, genetic predisposition also needs to be explored as a cause of systemic inflammation(Reference Capurso, Solfrizzi and D’Introno5).
C-reactive protein (CRP), a ring-shaped pentameric protein, is produced in the liver in response to proteins secreted by macrophages and adipocytes(Reference Nehring, Goyal and Bansal6,Reference Mantovani, Garlanda and Doni7) . CRP binds to phosphocholine on the surface of dead or dying cells and bacteria and activates the complement system to promote phagocytosis of dead cells and bacteria by macrophages(Reference Nehring, Goyal and Bansal6). Serum CRP concentrations are elevated following IL-6 release by macrophage and T cells in response to inflammation(Reference Custodero, Mankowski and Lee4). As a result, serum CRP concentration is a well-accepted marker of acute and chronic systemic inflammatory conditions(Reference Mantovani, Garlanda and Doni7). It is used to determine low-grade systemic inflammation and innate immunity status in clinical settings. Serum CRP concentration increases with the ageing process, and its high concentration contributes to elevating the age-related risk of morbidity and mortality in the elderly from infectious and metabolic diseases(Reference Koshikawa, Harada and Noyama8,Reference Lee, Kim and Huh9) . Serum CRP concentration is linked to nuclear factor kappa B activation, a pro-inflammatory transcription factor. The inhibition of the nuclear factor kappa B pathway results in a reduction of serum CRP concentrations.
Genetic factors can affect serum CRP concentrations. In the Strong Heart Family Study, the genetic variants at the CRP, hepatocyte nuclear factor-1 alpha and other loci exhibited nominal associations with increased serum CRP concentrations(Reference Best, Balakrishnan and Cole10). The genetic variants related to immune response, including IL10, CRP, glutathione S-transferase P-1, IL1B and nitric oxide synthase-2, are associated with prostate cancer recurrence independent of its prognostic factors. These results indicate that the genetic variations involved in immunity and inflammation are associated with cancer recurrence. Individuals with these genetic variations need to promote optimal immunity by modulating lifestyles, including nutrient intake(Reference Dluzniewski, Wang and Zheng11). Variations in the IL-1 receptor-associated kinase-1 gene are positively associated with serum CRP concentration in Caucasian women in the Diabetes Heart Study(Reference Lakoski, Li and Langefeld12). Therefore, genetic variants that increase serum CRP concentrations may be related to not only immune-related diseases but also metabolic diseases. The purpose of the present study was to explore genetic variants associated with increased serum CRP concentrations and their relationship with metabolic-related parameters in the middle-aged and elderly in the Korean Genome and Epidemiology Study (KoGES). The interaction between genetic variants and lifestyles was also determined.
Materials and methods
Ethics statement
The present study was conducted according to the guidelines laid down in the Declaration of Helsinki, and the institutional review board approved all procedures involving human subjects/patients of the Korean National Institute of Health for the KoGES (KBP-2015–055) and Hoseo University (1 041 231–150 811-HR-034–01). Written informed consent was received from all participants.
Sample size calculation and participants
The sample size was calculated for studying the logistic analysis using a G-power calculator (G × power Software, the University of Dusseldorf, Germany). It was determined to achieve significance at α = 0·05 and β = 0·99 at an OR of 1·05. The total sample size, 49 203, in the city hospital cohort was sufficient to achieve the significance goal. The 58 701 participants aged 40–79 years had a voluntary recruit from a large urban hospital cohort study in the KoGES conducted in 2010–2014(Reference Ryu and Lee13), but 9498 participants had missing values, including no serum CRP concentrations. The replicate was checked in 8842 volunteers aged 40–79 years in Ansan/Ansung cohort conducted during 2001–2014.
Basal characteristics, anthropometric and biochemical parameters of the participants
Information on age, gender, residence area living for more than the last 6-months, education, income, smoking history, alcohol consumption and physical activity was collected in the survey questionnaires at a health interview. Smoking status was classified as a current-smoker, past-smoker and never-smoker by smoking twenty cigarettes within the last six months(Reference Park, Ahn and Lee14). Average daily alcohol consumption was calculated by the frequencies of alcohol drinking and alcohol amounts, and the participants were divided into nondrinker, light drinker (0–1 g), moderate drinker (1–20 g) and heavy drinker (>20 g)(Reference Park, Ahn and Lee14). Coffee intake was assessed in the same manner as was alcohol intake, and it was categorised into three groups by the tertiles of daily coffee intake. Regular exercise was defined as over 30 min of exercise per day for three days a week.
Height, weight, waist and hip circumferences were measured wearing a light gown with bare feet(Reference Daily and Park15,Reference Park, Daily and Zhang16) . Obesity was defined as BMI ≥ 25 kg/m2. Blood pressure was measured by a doctor via a sphygmomanometer under resting conditions three times, and the average systolic blood pressure and diastolic blood pressure were used for further analysis. Blood was collected after fasting for > 12 h in heparin-treated tubes, and leucocytes was counted from the blood. Lipid profiles in the plasma and serum concentrations of glucose and creatinine were measured using a Hitachi 7600 Automatic Analyzer (Hitachi LTD.). Serum high-sensitive CRP concentrations were measured by ELISA kit. Blood HbA1c was measured using an automatic analyzer (ZEUS 9·9). Estimated glomerular filtration rate was calculated by the equation of 175 × (serum creatinine concentrations)–1·154 × (age)–0·203. In females, estimated glomerular filtration rate was multiplied by 0·742.
Definition of inflammation, its related diseases and metabolic syndrome
Serum CRP concentrations are a biomarker of inflammation risk. Serum CRP concentrations are positively associated with metabolic syndrome (MetS) risk even in the normal ranges (<1 mg/dl) and those of 0·5–0·9 mg/dl elevates MetS risk by 1·7 times in the reference of <0·2 mg/dl(Reference Yoon, Ryu and Lee17). In some Korean hospitals, 0·5 mg/dl serum CRP concentration was used for the cut-off. Therefore, serum CRP concentrations > 0·5 mg/dl were considered to be High-CRP (case), indicating high inflammation (n 2018) and those ≤ 0·5 mg/dl were assigned as the Low-CRP (control) and normal inflammation (n 47 185). The participants without serum CRP concentrations were excluded (n 9498). Participants answered whether they had a diagnosis of inflammation-related diseases and CVD, including myocardial infarction and stroke, diagnosed by a doctor.
MetS was defined according to the 2005 revised National Cholesterol Education Program-Adult Treatment Panel III criteria for Asia(Reference Park, Daily and Zhang16,Reference Yoon, Ryu and Lee17) . Participants having three or more of the following criteria had MetS: (1) elevated blood pressure (average systolic blood pressure ≥ 130 mmHg or diastolic blood pressure ≥ 85 mmHg) or current blood pressure medication use; (2) low HDL-cholesterol level (< 40 mg/dl for men and < 50 mg/dl for women); (3) elevated serum TAG level (≥ 150 mmol/l) or current anti-dyslipidaemic medication use; (4) elevated fasting blood glucose level (≥ 100 mmol/l) or current use of anti-diabetic medication and (5) abdominal obesity (waist circumference ≥ 90 cm for men and ≥ 85 cm for women).
Assessment of nutrient intake and dietary pattern analysis
Usual food intake during the previous year was assessed using a semi-quantitative food frequency questionnaire (SQFFQ). The 3-day food records for four seasons have validated the accuracy and reproducibility of the SQFFQ(Reference Park, Zhang and Lee18). The SQFFQ includes 103 food items that are often consumed by Koreans daily. The food frequencies were divided into the following nine categories: never or seldom, once per month, two to three times monthly, once or twice weekly, three or four times weekly, five or six times weekly, daily, twice daily and ≥ three times daily. Food intakes per meal were scored as more than, equal to or less than the standard portion size visualised using photographs of foods in each food category. Participants selected the frequencies of the portion size, and daily food intakes were computed by multiplying the median of weekly consumed frequencies by portion sizes for each food category. Energy, protein, carbohydrates, fat, vitamin and mineral intakes were calculated using Can-Pro 2·0 nutrient intake assessment software developed by the Korean Nutrition Society.
Dietary inflammatory index
Dietary inflammatory index (DII) is an index of dietary inflammatory potentials calculated from the dietary anti-inflammatory weights for certain foods and nutrients (energy, thirty-two nutrients, four food products, four spices and caffeine), as previously described(Reference van Woudenbergh, Theofylaktopoulou and Kuijsten19). The SQFFQ in the KoGES did not contain garlic, ginger, saffron and turmeric, and they were excluded from DII calculations. The higher DII indicated that the participant consumed a potential inflammatory diet. We calculated DII by the following equation:
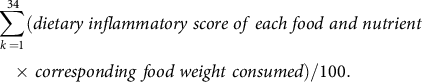 $$\sum \limits_{k \,= 1}^{34} (dietary\;inflammatory\;score\;of\;each\;food\;and\;nutrient\, \\ \times \,corresponding\;food\;weight\; consumed)/100. $$
Genotyping and quality control
Genomic DNA was extracted from whole blood, and genotypes were determined using the Affymetrix Korean Chip (Affymetrix, Santa Clara, CA), made available for scientific studies(Reference Park and Kang20). This chip has been previously used to study Korean genetic variants and included disease-related SNP(Reference Liu, Jin and Park21). Genotype imputation was conducted with the IMPUTE (v2·644) containing the 1000 Genomes phase I integrated variant call set release (version 3) in NCBI build 37 (hg19) as a reference panel(Reference Hwang, Lee and Go22). Imputation quality for inclusion was useful information >0·5. The genotyping accuracy of the SNP results was examined by Bayesian Robust Linear Modeling using the Mahalanobis Distance Genotyping Algorithm(Reference Rabbee and Speed23). The genotype results met genotyping accuracy of ≥ 98 %, a missing genotype call rate of < 4 %, heterozygosity of < 30 % and showed no gender bias. Genetic variants that met the Hardy–Weinberg equilibrium (P > 0·05) were included.
Selection of genetic variants for serum C-reactive protein concentrations by GWAS
We excluded 9498 participants with no serum CRP concentrations and missing values. Genome-wide association study (GWAS) was conducted to explore genetic variants associated with inflammation risk in Low-CRP (≤ 0·5 mg/dl; n 47 185) and High-CRP groups (> 0·5 mg/dl; n 2018) after adjusting age, gender, energy intake, residence area, BMI, education, MetS, smoking, alcohol intake, fat intake, physical activity, and any medication for inflammatory diseases. Genetic variants (n 2310) were selected at P < 1X10E-5, and corresponding genes for the genetic variants were identified using scandb.org (Fig. 1). Genetic variants with unidentified gene names were deleted, and 336 genetic variants remained at P < 5X10E-6. Genetic variants (n 281) were eliminated because the genes corresponding to genetic variants were not linked to several inflammation-related pathways using genemania.org. The 55 selected genetic variants were selected. Linkage disequilibrium (LD) analyses were conducted on the 55 selected genetic variants in the same chromosome using Haploview 4·2 in PLINK (Fig. 1). Ten genetic variants having low LD (D’ < 0·3) were included for generalised multifactor dimensionality reduction (GMDR) analysis because the high LDs indicated a similar impact on inflammation risk.
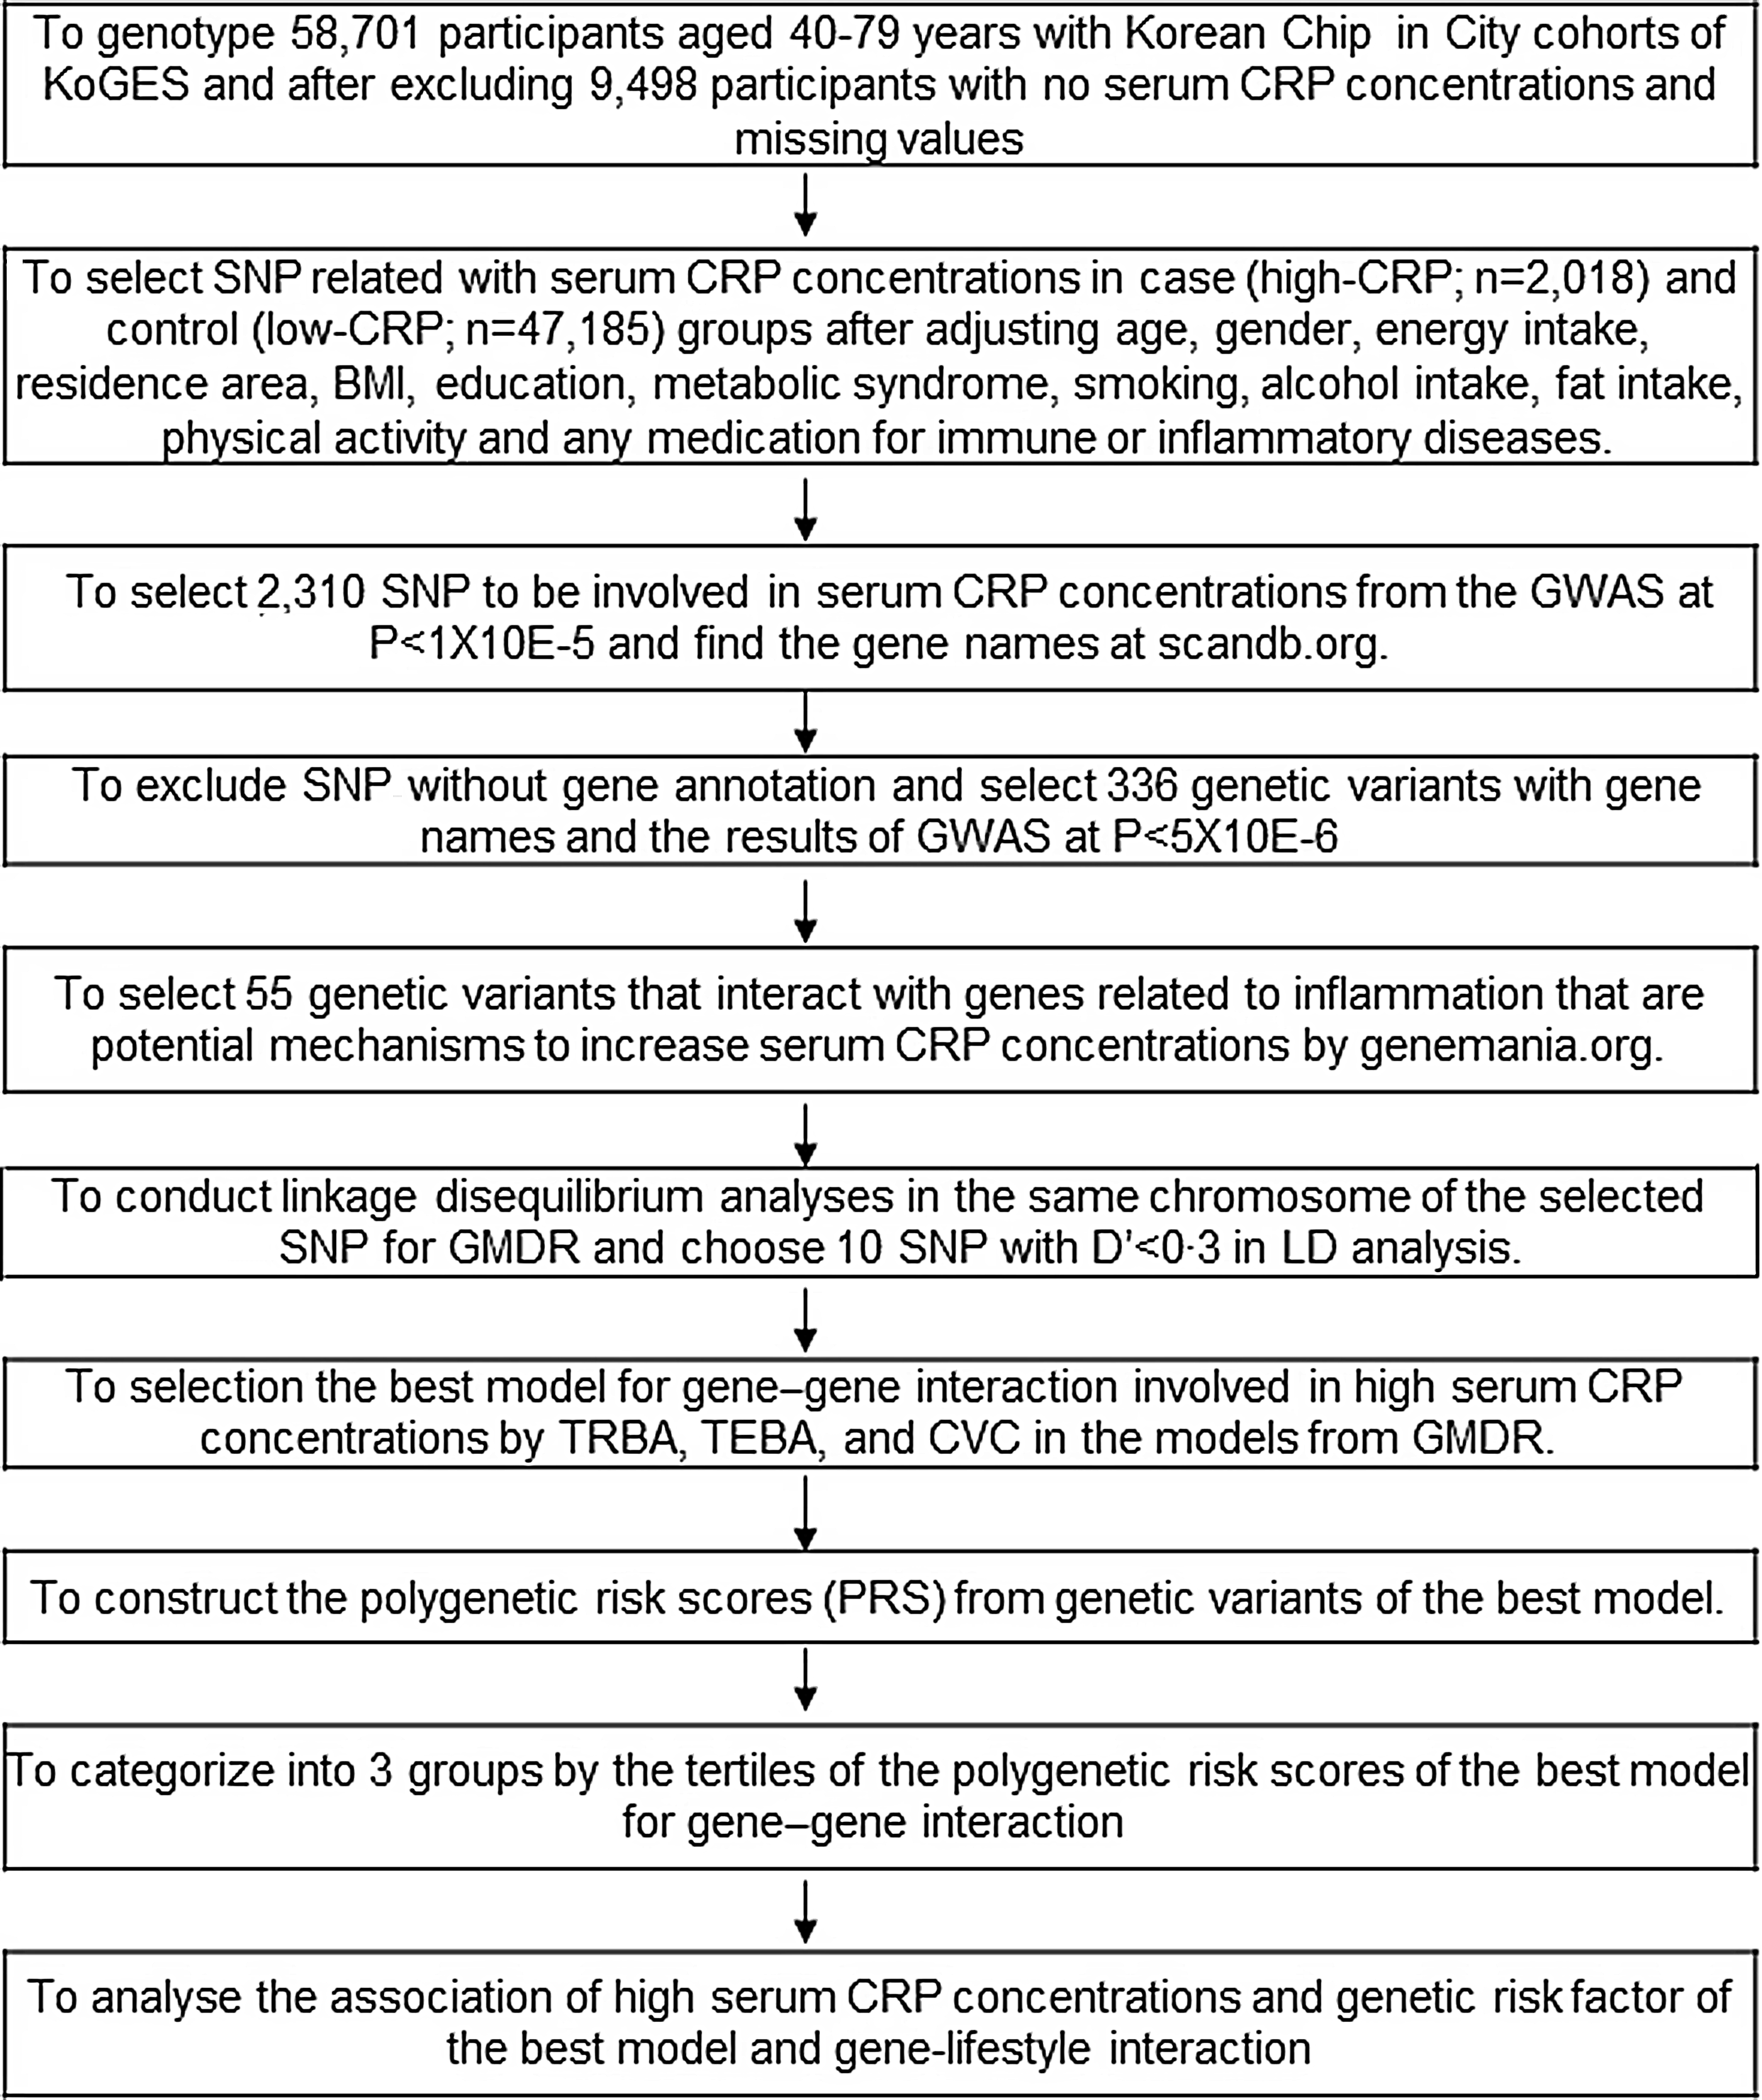
Fig. 1. Flow chart of the steps in creating polygenetic-risk scores for inflammatory risk by serum CRP concentrations.
Identification of the best model for interactions among genetic variants by generalised multifactor dimensionality reduction for inflammation
The best gene–gene interaction model for inflammation risk by serum CRP concentrations was selected using a GMDR program. The signed-rank test using a P < 0·05 with trained balanced accuracy and testing balanced accuracy with adjusting for covariates of age, gender, BMI (model 1), and covariates of model 1 plus energy intake as estimated energy requirement percentage, fat intake and any medication to inflammatory diseases (model 2)(Reference Uma Jyothi and Reddy24). Ten-fold cross-validation (CV) was used to check CV consistency since the sample size was greater than 1000(Reference Uma Jyothi and Reddy24). From the best model determined by GMDR analysis, the risk allele of each SNP in the selected best model was counted as 1(Reference Hong, Kim and Zhang25). For example, when the G allele was a risk allele for increasing serum CRP concentrations, TT, GT and GG were assigned 0, 1 and 2, respectively. Polygenetic-risk scores (PRS) were calculated by summing risk allele scores for each SNP included in the PRS for the best model. PRS was divided into Low-PRS, Medium-PRS and High-PRS with 0–4, 5–6 and > 6 risk alleles for 6 SNP GMDR model, respectively, and 0–5, 6–7, > 7 risk alleles for 7 SNP GMDR model, respectively. The sensitivity of PRS for serum CRP concentration risk was analysed with the area under the curve (AUC) of the receiver operating characteristic (ROC) curve by eliminating each covariate in the model, including PRS and covariates, using the XGBoost algorithm.
Statistical analyses
Statistical analysis was performed using PLINK version 2.0 (http://pngu.mgh.harvard.edu/ ∼purcell/plink) and SAS (version 9.3; SAS Institute). The descriptive statistics of categorical variables were calculated according to genders and serum CRP concentrations, and frequency distributions of classification variables were analysed using the χ 2 test. Adjusted means and standard deviations were analysed for continuous variables according to genders and serum CRP concentrations. Their significant differences between groups were determined by two-way ANOVA of gender and serum CRP concentrations with the adjustment for covariates of age, gender, energy intake, residence area, BMI, education, MetS, smoking, alcohol intake, fat intake, physical activity and any medication for inflammatory diseases. Tukey’s test was used to perform multiple group comparisons.
After adjusting for covariates, the association between PRS and inflammation risk by serum CRP concentrations was investigated using logistic regression analysis. OR and 95 % CI for PRS were analysed to influence serum CRP concentrations with Low-PRS as a reference, using logistic regression analysis after either adjusting for age, gender, education, residence area, BMI and daily energy intake (model 1) and covariates in the model 1 plus smoking status, alcohol intake, physical activity, MetS, fat intake and any medication to inflammatory diseases (model 2). Participants were categorised into higher or lower lifestyle variables using the criteria defined by the 50th percentiles of each variable to explore the interaction between PRS and lifestyles, including dietary intakes. A multivariate interaction model was used to evaluate interactions between PRS and lifestyles and dietary intake after adjustment for covariates. P-values of ≤ 0·05 were considered statistically significant.
Results
General and demographic characteristics of the participants
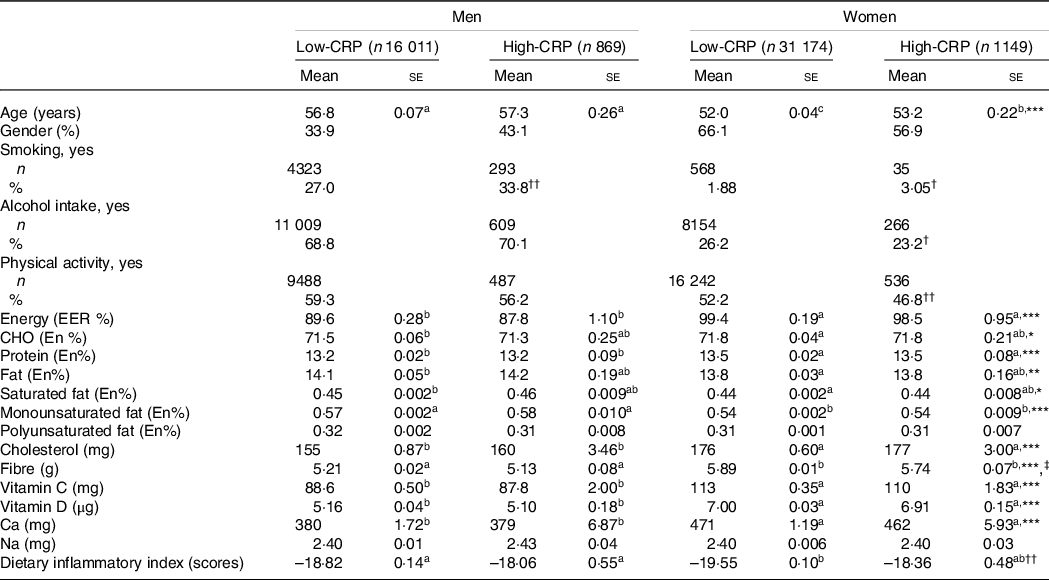
Male participants were older than women (P < 0·001), and those in the High-CRP group were older than those in the Low-CRP in both genders (P < 0·05; Table 1). Men were higher in the High-CRP group than the Low-CRP group, but women had an opposite pattern (Table 1). The smoking participants were higher in the High-CRP than the Low-CRP in both genders. The percentage of women, but not men, engaging in regular physical activity (P < 0·001) and consuming alcohol (P < 0·05) were significantly lower in the High-CRP than the Low-CRP.
Table 1. Demographic characteristics and nutrient intake of the participants according to genders and serum C-reactive protein (CRP) concentrations
(Mean values with their standard errors)
Values represented adjusted means ± standard errors or number (n) and percentage. The covariates included age, gender, energy intake, residence area, BMI, education, metabolic syndrome, smoking, alcohol intake, fat intake, physical activity and any medication for inflammatory diseases. An independent variable was eliminated from the covariates. Serum CRP concentrations were classified into low (≤ 0·5 mg/dl) and high (> 0·5 mg/dl) groups.
a,b,c Different alphabets indicated significantly different among the groups in Tukey’s test at P < 0·05.
* Significantly different with genders by two-way ANOVA at P < 0·05, ** P < 0.01, and *** P < 0.001.
† Significantly different from the Low-CRP in each gender by χ2 test at P < 0·05 and †† P < 0·001.
‡ Significantly different with serum CRP concentrations by two-way ANOVA at P < 0·05.
Energy intake based on estimated energy requirement was higher in women than in men (P < 0·001), but it did not differ between the Low-CRP and High-CRP (Table 1). Carbohydrate, protein and fat intakes as energy percentages were significantly different by gender, but they did not differ by the CRP groups. Saturated fat, monounsaturated fat and cholesterol intakes, but not polyunsaturated fat, were higher in men than in women, but CRP did not alter their intake. Fibre intake was influenced by gender and CRP groups: fibre intake was higher in women and Low-CRP groups. Calcium intake was higher in women than in men, but it did not differ between the CRP groups. However, Na intake was not different by gender and CRP groups. Average DII values in each group were negative, suggesting that most participants had an anti-inflammatory diet. The DII was lower in the Low-CRP group than in the High-CRP group, but it had no gender difference (Table 1). DII was lowest in the Low-CRP in women among the groups (Table 1), indicating that women in the Low-CRP group had the lowest inflammatory diet.
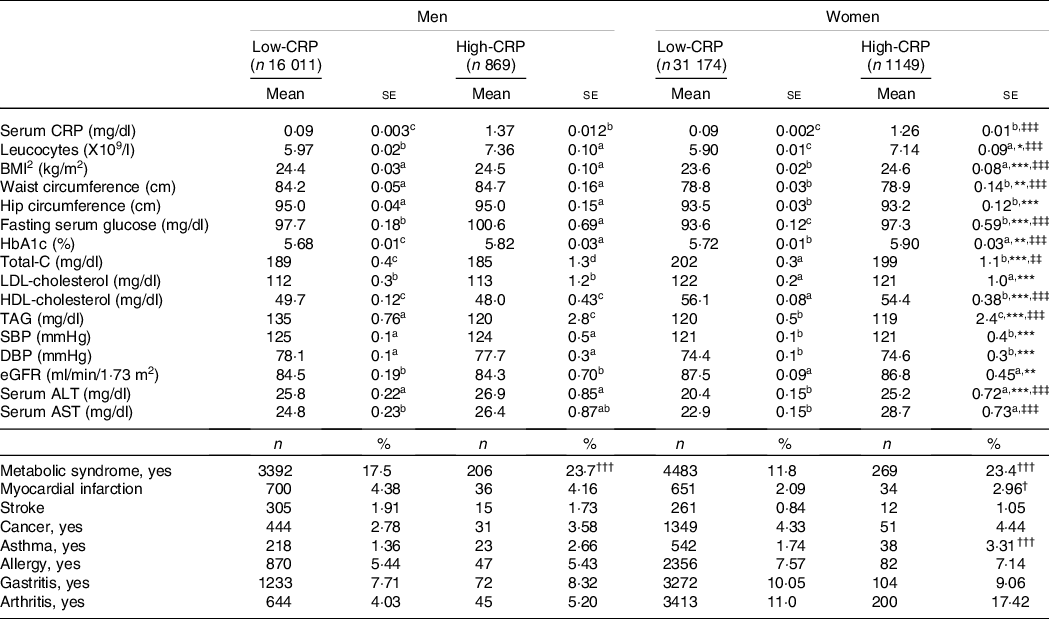
Metabolic parameters according to genders and serum C-reactive protein concentrations
Serum CRP concentrations were not affected by gender after adjusting for covariates. Leucocytes was influenced by gender and CRP groups, and leucocytes were higher in the High-CRP than in the Low-CRP in both genders (Table 2). BMI and waist circumferences were influenced according to genders and CRP groups. BMI and waist circumferences were higher in the High-CRP than the Low-CRP only in men (Table 2). Hip circumferences had a positive association with gender, but not CRP groups, and they were higher in men than in women. Serum concentrations of glucose, cholesterol, HDL, TAG and blood HbA1C concentrations were affected by gender and CRP concentration (Table 2). Fasting serum glucose and blood HbA1c concentrations were higher in the High-CRP than in the Low-CRP. Serum concentrations of HDL were much lower in men than in women, and they were higher in the Low-CRP than the High-CRP (Table 2). However, systolic blood pressure, diastolic blood pressure and estimated glomerular filtration rate showed a significant difference with gender but not with CRP groups. Systolic blood pressure and diastolic blood pressure were higher in men than in women, but estimated glomerular filtration rate was the opposite of systolic blood pressure and diastolic blood pressure (Table 2). Serum concentrations of aspartate aminotransferase (AST) and alanine aminotransferase (ALT), an index of liver damage, were influenced by gender and CRP groups. Women in the Low-CRP had the lowest serum ALT and AST concentrations.
Table 2. Adjust means of the metabolic parameters and immunity-related diseases according to genders and serum C-reactive protein (CRP) concentrations
Values represented adjusted means and standard errors after adjusting for covariates of age, gender, energy intake, residence area, BMI, education, metabolic syndrome, smoking, alcohol intake, fat intake, physical activity and any medication for inflammatory diseases. An independent variable was eliminated from the covariates. Serum high-sensitive CRP concentrations were classified into low (≤ 0·5 mg/dl) and high (> 0·5 mg/dl) groups. Total-C, total cholesterol; SBP, systolic blood pressure; DBP, diastolic blood pressure; eGFR, estimated glomerular filtration rate; ALT, alanine aminotransferase; AST, aspartate aminotransferase.
* Significantly different with genders by two-way ANOVA at P < 0·05, ** P < 0·01 and *** P < 0·01.
‡‡ Significantly different with serum CRP by two-way ANOVA at P < 0·01, ‡‡‡ P < 0.001.
† Significantly different from the Low-CRP in each gender by χ2 test at P < 0.05, ††P < 0·01 and †††P < 0.001.
a,b,c Different alphabets indicated significantly different among the groups in Tukey’s test at P < 0·05.
Among inflammation-related diseases, the incidence of asthma was higher in the High-CRP than the Low-CRP in both genders, but that of arthritis was higher in the High-CRP than the Low-CRP only in women but not in men (Table 2). Allergy and gastritis incidence were not different between the Low-CRP and High-CRP in both genders (Table 2).
Genetic variants related to inflammation status determined by serum C-reactive protein concentrations
As illustrated in Fig. 1, ten genetic variants that influence inflammation risk were selected to check the genetic variant–genetic variant interaction in GMDR. Ten genetic variants included in the GMDR are presented in Table 3. The genetic variants were as follows: CRP rs1205, glucuronidase, beta pseudogene 2 (GUSBP2) rs1250561232, HNF1A rs1169286, chromosome 12 open reading frame 43 (C12orf43) rs2257764, 2′-5′-oligoadenylate synthetase like (OASL) rs3213545, translocase of outer mitochondrial membrane 40 rs10119, apolipoprotein E rs429358, APOC1 rs7256200, Apolipoprotein C-I pseudogene 1 (APOC1P1) rs66626994 and solute carrier transporter (SLC13A3) rs424697 (Table 3). These SNP satisfied the MAF (0·096–0·461) and Hardy–Weinberg equilibrium (P > 0·05). The OR for inflammation risk ranged from 0·70 to 1·27, and p values were between 4·14E-15 and 3·72E-06 (Table 3). These SNP had similar associations with serum CRP concentrations in Ansan/Ansung cohort (Table 3).
Table 3. &The characteristics of the ten genetic variants related to serum C-reactive protein (CRP) concentration, an index of inflammation
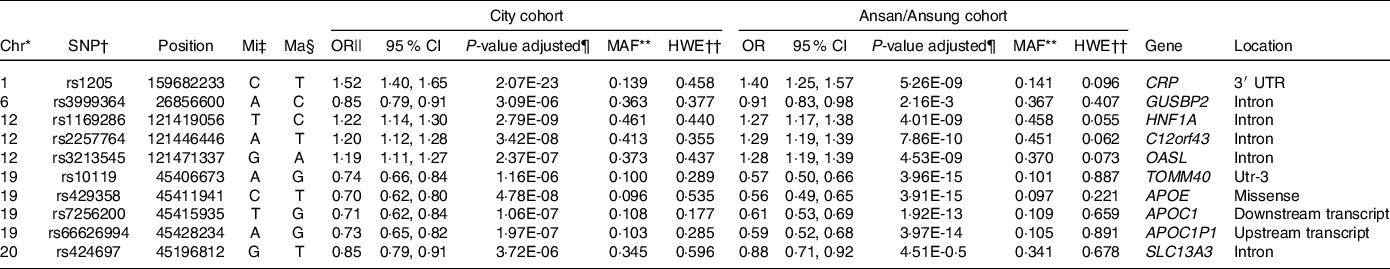
* Chromosome.
† Single Nucleotide Polymorphism.
‡ Minor allele.
§ Major allele.
|| Odds Ratio (OR) and lower and upper ends of 95 % confidence intervals (CI).
¶ P-value for OR after adjusting for covariates of age, gender, energy intake, residence area, BMI, education, metabolic syndrome, smoking, alcohol intake, fat intake, physical activity and any medication for inflammatory diseases.
** Minor allele frequency.
†† P-value for Hardy–Weinberg equilibrium (HWE). GUSBP2, glucuronidase, beta pseudogene 2; HNF-1α, hepatocyte nuclear factor-1 alpha; GSTP1, glutathione S-transferase P-1; IL1B, interleukin-1β; NOS2, nitric oxide synthase-2; C12orf43, chromosome 12 open reading frame 43; OASL, 2′-5′-oligoadenylate synthetase like; TOMM40, translocase of outer mitochondrial membrane 40; APOE, apolipoprotein E; APOC1P1, apolipoprotein C-I pseudogene 1; TLDC2, TBC/LysM-associated domain containing 2.
Genetic variants were selected from the variants that exhibited interactions with other variants to influence serum CRP concentrations in GMDR. CRP itself met the significance level for trained balanced accuracy and CV consistency (online Supplementary Table 1). However, the SNP that interacted with each other needed to be selected for the best model for SNP–SNP interaction. After adjusting covariates, the model included six and seven genetic variants from GMDR that met the trained balanced accuracy, testing balanced accuracy and CV consistency. Six SNP model included CRP_rs1205, OASL_rs3213545, APOE_rs429358, HNF1A_rs1169286, APOC1_rs7256200 and SLC13A3_rs424697 (online Supplementary Table 2). The model with 7 SNP also met the significance levels, and it included 6 SNP in the 6 SNP model plus C12orf43_rs2257764 (online Supplementary Table 1). The genes with SNP–SNP interaction were involved in LDL metabolism, suggesting that inflammation and LDL metabolism may be closely related.
The High-PRS with 6 SNP from the SNP–SNP interaction model was positively associated with serum CRP concentrations by 1·96 and 2·00 times after adjusting for covariates 1 and 2, respectively (Table 4). The High-PRS with 7 SNP also showed a positive association with serum CRP concentrations (OR = 1·75 for model 1 and 1·76 for model 2), but the OR in the 7 SNP model were smaller than those in the 6-SNP model (Table 4). Interestingly, leucocytes also had a positive association with the High-PRS for inflammation risk by 1·124 times in the model with 6 SNP and 7 SNP after adjusting for covariates of model 2 (Table 4). However, the PRS had no association with BMI, waist circumference, serum glucose concentrations and blood pressure for inflammation risk (online Supplementary Table 2). AUC of the ROC curve did not differ in all classification models for serum CRP concentrations when one covariate was removed, although it was weakly associated with serum CRP concentrations (AUC = 0·636; Fig. 2(a)). The importance of variables to explain serum CRP concentration risk was shown in Fig. 2(b), and BMI, energy intake, age, fat intake and PRS of the 6-SNP model were ranked in the top part of importance. Therefore, the results explained that the 6-SNP model was the best to explain the association with serum CRP concentration.
Table 4. Adjusted OR for the risk of serum C-reactive protein (CRP) concentrations by polygenetic risk scores of the 6 and 7 SNP model (PRS) for gene–gene interaction after covariate adjustments
(Odd ratio (OR) and 95 % confidence intervals (CI))
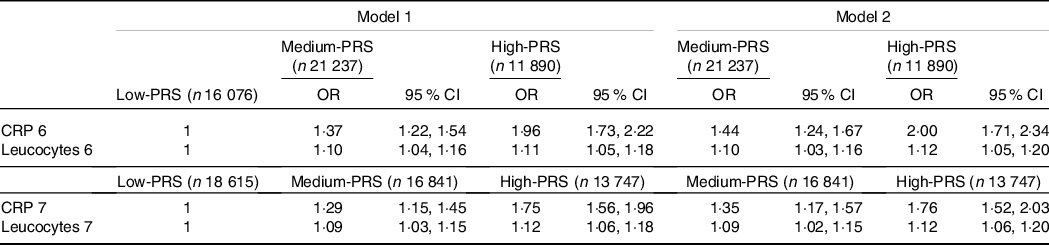
GMDR, generalised multifactor dimensionality reduction. PRS, poly-genetic risk scores.
Values represented adjusted OR and 95 % CI. Covariates of model 1 were age, gender, BMI, residence area, education and daily energy intake, and those of model 2 were covariates for model 1 plus smoking, alcohol drinking, exercise, metabolic syndrome, fat intake and any medication to inflammatory diseases.
Gene–gene interaction model with 6 SNP included CRP_rs1205, GUSBP2_rs1250561232, OASL_rs3213545, APOC1_rs7256200, TLDC2_rs59310406 and HNF1A_rs1169286. Gene–gene interaction model with 7 SNP included 6 SNP in the 6 SNP model plus C12orf43_rs2257764.
Low-PRS, Medium-PRS and High-PRS were divided into 0–4, 5–6 and > 6 risk alleles for 6 SNP GMDR model, respectively, and 0–5, 6–7 and > 7 risk alleles for 7 SNP model, respectively. The number (n) of the participants was for 6 SNP models of serum CRP concentrations.
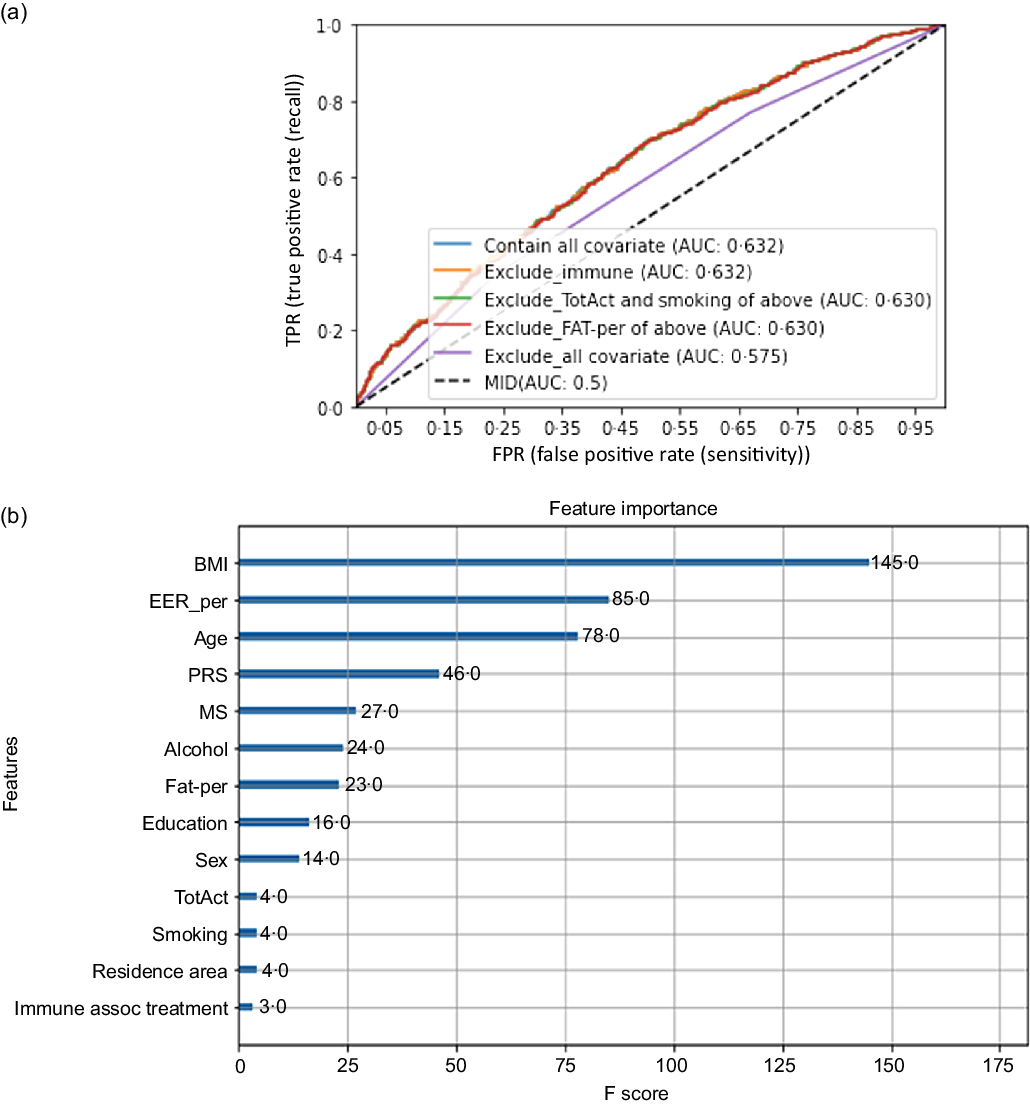
Fig. 2. Receiver operating characteristic (ROC) curve with eliminating one covariate in the model for serum C-reactive protein (CRP) concentration risk, including covariates. The covariates included age, gender, energy intake, residence area, BMI, education, metabolic syndrome, smoking, alcohol intake, fat intake, physical activity and any medication for inflammatory diseases.
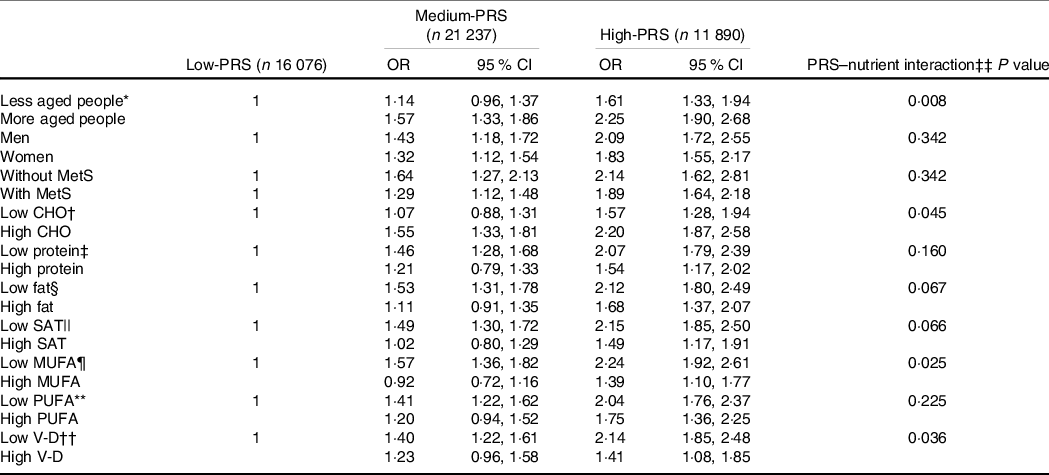
Interaction of polygenetic-risk scores and nutrient intake in inflammation risk
Age exhibited an interaction with PRS to increase inflammation risk (P = 0·0077). High-PRS had a higher OR with inflammation risk in the participants aged ≥ 55 years than those aged < 55 years. Serum CRP concentrations were much higher in the High-PRS than the Low-PRS only in the participants aged ≥55 years (Fig. 3(a)). There was no interaction of genders with PRS for inflammation risk, and MetS did not interact with PRS for inflammation risk.
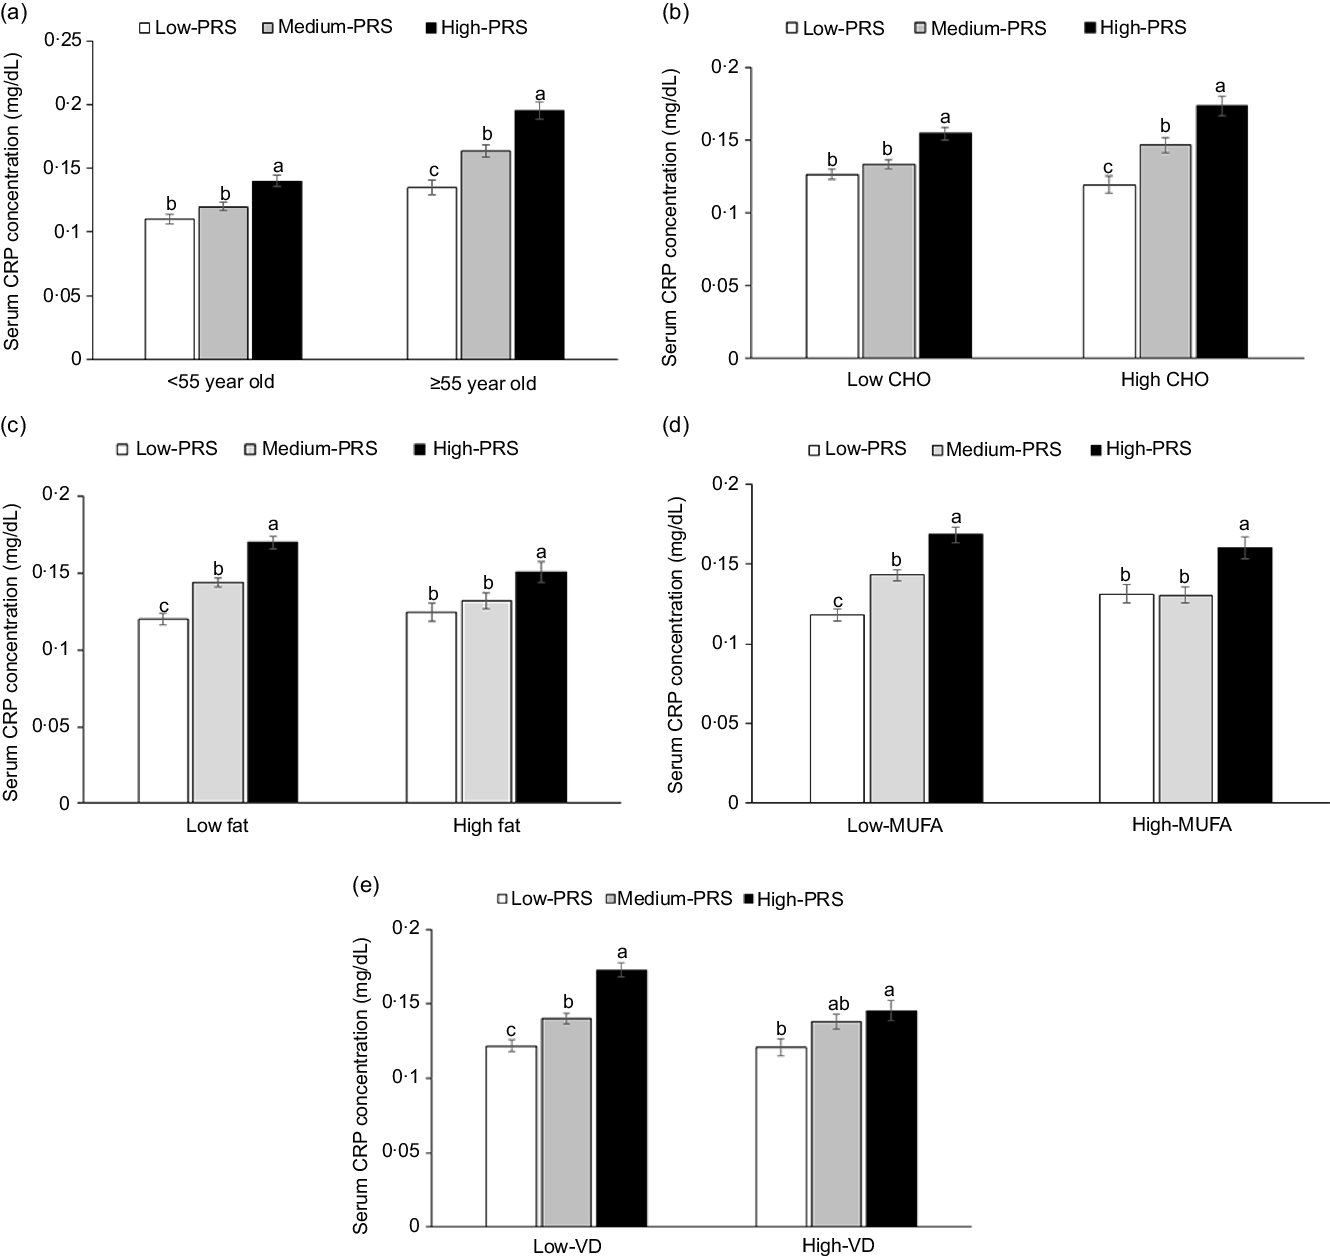
Fig. 3. Serum C-reactive protein (CRP) concentrations in the three groups of polygenetic-risk scores (PRS) of the best model, including 6 SNP according to age and nutrient intake. (a) In the participants, according to age (cut-off point: 55 years old). (b) In the participants, according to carbohydrate intake (cut-off point: 70 energy %). (c) In the participants, according to fat intake (cut-off point: 15 energy %). (d) In the participants, according to MUFA intake (cut-off point: 5.5 energy %). (e) In the participants, according to vitamin D intake (cut-off point: 9·3 µg/d). The PRS of 6 SNP included CRP_rs1205, GUSBP2_rs1250561232, OASL_rs3213545, APOC1_rs7256200, SLC13A3_rs424697 and HNF1A_rs1169286. PRS was calculated by the summation of risk alleles of genetic variants in the 6 SNP best model, and PRS was categorised into three groups, 0–4 (Low-PRS), 5–6 (Medium-PRS) and > 6 risk alleles (High-PRS). Covariates included age, gender, energy intake, residence area, BMI, education, metabolic syndrome, smoking, alcohol intake, fat intake, physical activity and any medication for inflammatory diseases. The reference was the low-PRS.
Carbohydrate intake was the only nutrient that exhibited an interaction with PRS for inflammation risk (P = 0·045), and with high carbohydrate intake, inflammation risk was 2·198 times higher for the participants with the High-PRS than for those with the Low-PRS (Table 5). Serum CRP concentrations were higher in the participants with High-PRS than in those with Low-PRS in high carbohydrate intake (Fig. 3(b)). The fat intake had an opposite pattern in serum CRP concentration and PRS as carbohydrate intake, but the interaction was insignificant (Table 5). Protein intake did not interact with PRS for inflammation risk (Table 5). In the types of dietary fatty acids, only MUFA, but not saturated and PUFA, had an interaction with serum CRP concentrations (Table 5). Serum CRP concentrations increased by 2·239 folds in the High-PRS group compared with the Low-PRS, only in the participants with low MUFA intake. Interestingly, vitamin D intake also interacted with serum CRP concentrations, and in the participants with low vitamin D intake, serum CRP concentrations were much higher by 2·141 folds in the High-PRS than in the Low-PRS.
Table 5. The adjusted OR for the risk of serum C-reactive protein (CRP) concentrations by the polygenetic-risk scores (PRS) with 6 SNP* after covariate adjustments according to age, gender, metabolic syndrome and nutrient intake
(Odd ratio and 95 % confidence intervals)
GMDR, generalised multifactor dimensionality reduction.
Values represent adjusted OR and 95 % CI.
Gene–gene interaction model with 6 SNP included CRP_rs1205, GUSBP2_rs1250561232, OASL_rs3213545, APOC1_rs7256200, TLDC2_rs59310406 and HNF1A_rs1169286. Low-GRS, Medium-GRS and High-GRS were divided into 0–4, 5–6 and > 6 risk alleles for 6 SNP GMDR model, respectively.
The reference was the Low-PRS.
The cut-off points for dividing the values of each parameter into two groups were as follows: * less than 55 years, † 70 % carbohydrate (CHO).
‡ Less than 13 % protein.
§ 15 % fat.
|| 4·5 % SFA.
¶ 5·5 % MUFA.
** 3·5 % PUFA.
†† 9·3 µg/d vitamin D (V-D).
‡‡ Multivariate ANCOVA models include the corresponding main effects, interaction terms of main effects, and potential confounders such as age, gender, energy intake, residence area, BMI, education, metabolic syndrome, smoking, alcohol intake, fat intake, physical activity and any medication for inflammatory diseases.
Discussion
Low-grade subclinical inflammation is sustained by the net effects of the synthesis and degradation of cell-derived mediators of inflammation. It tends to increase with age, and it is interrelated with metabolic diseases. Moreover, genetic and environmental factors are also associated with vulnerability to inflammation. We aimed to examine the effects of genetic variants and their interactions on the risk of chronic inflammation and explore its interaction with the genetic variants with lifestyles in adults > 40 years. The genetic variants for inflammation risk included CRP_rs1205, OASL_rs3213545, APOE_rs429358, HNF1A_rs1169286, APOC1_rs7256200 and SLC13A3_rs424697. The PRS of these SNP had a positive association with serum CRP concentrations and leucocytes by 2·001 and 1·123 times, rem ,spectively. Inflammation risk was 2·198 times higher for the participants with the High-PRS than for those with the Low-PRS in participants with a high CHO intake. Interestingly, APOE and APOC1 in the PRS were involved in dyslipidaemia and Alzheimer’s diseases and CVD. The present study showed that serum CRP concentrations were highly positively associated with the risk of metabolic syndrome and its components, but they were weakly linked to myocardial infarction only in women. The results suggested that serum CRP concentrations may increase the burden on CVD, especially myocardial infarction, by elevating lipid inflammation. Moreover, High CHO, low MUFA and low V-D intakes were positively associated with the older adults with High-PRS. The results can be applied to precision nutrition strategies to protect against inflammation risk involved in various diseases.
The CRP gene is located on chromosome 1 (1q23·2). CRP assembles into a stable pentameric structure with a discoid shape in the bloodstream, and it acts as a mediator of the host’s response to infection(Reference Custodero, Mankowski and Lee4). CRP production and secretion increase after IL-6 secretion by macrophages and T-cells. TNF-α, IL-1, corticosteroids, oestrogen and potentially other cytokines released from the adipocytes stimulate CRP synthesis(Reference Sproston and Ashworth26). CRP is mainly produced in the liver, but the kidneys, smooth muscle cells, adipocytes, endothelial cells, lymphocytes and neurons are also potential sites for CRP production. The minor allele of CRP rs1205 is different according to ethnicity: it was C in East Asians but T in other ethnicities. However, overall, the C allele of rs1205 is associated with increased serum CRP concentrations in various studies(Reference Shen, Arnett and Parnell27), and in Asian studies, the C allele of CRP rs1205 is positively associated with serum CRP concentrations and glucose tolerance(Reference Sheu, Wang and Wu28), consistent with the present study. However, the T allele of rs1205 in patients with aortic valve stenosis acts as an elevator of serum CRP concentrations in Caucasians(Reference Wypasek, Potaczek and Undas29). Furthermore, the CRP expression in different organs remains without significant association according to the alleles of CRP rs1205 in the GTEx eQTL calculator (https://gtexportal.org/home/testyourown). It suggested that the association of CRP rs1205 with serum CRP concentrations is complicated, and it influences CRP production with a disease-specific molecular regulatory mechanism.
CRP mediates the activation of the complement system, phagocytosis, apoptosis, nitric oxide release and cytokine production, mainly of TNF-α and IL-6. CRP is considered an essential component of the innate immune system and links innate and specific immunity. However, overactivation of CRP production may be harmful to the body. A recent study has demonstrated that the risk of developing severe COVID-19 cases is elevated by 5 % for every one-unit increase in serum CRP concentration in patients with COVID-19(Reference Ali30). It suggested that the elevated CRP levels might be linked to the overproduction of inflammatory cytokines in patients with severe COVID-19 infections. Cytokines fight against the infection, but they damage the organs like lung tissue when the immune system becomes hyperactive. Thus, a high serum CRP concentration may indicate the overactivation of immunity after adjusting for inflammatory diseases, hyperglycaemia and dyslipidaemia. The present study demonstrated that genetic variants were positively associated with elevated serum CRP concentrations after adjusting for covariates that influence low-grade inflammation, such as BMI, serum glucose concentration, lipid profiles and inflammatory diseases. The carriers with High-PRS had higher serum CRP concentrations than those with Low-PRS with similar inflammatory status. Therefore, persons with High-PRS need to maintain serum CRP concentrations at a low level by modulating lifestyles.
The present study demonstrated that the genetic variants for inflammation risk were CRP_rs1205, OASL_rs3213545, APOE_rs429358, HNF1A_rs1169286, APOC1_ rs7256200 and SLC13A3_rs424697. Interestingly, the genetic variants included in the 19q13 loci were related to lipid profiles, but they contributed to serum CRP concentrations, an index of low-grade inflammation. Serum total cholesterol concentrations were negatively associated with the PRS, indicating that the persons with Low-PRS had higher serum total cholesterol concentrations than those with High-PRS. CRP, APOE and APOC1 expressions were associated with inflammation and immunity when a tocotrienol-rich fraction supplementation was taken for six months(Reference Heng, Karsani and Abdul Rahman31). The APOE polymorphism is also associated with Alzheimer’s disease and primary biliary cirrhosis(Reference Vuoristo, Färkkilä and Gylling32). The presence of the APOE e2 allele results in 2·4 times higher risk (P < 0·01) in the patients with primary biliary cirrhosis, and the persons with the APOE4 allele developed primary biliary cirrhosis at a younger age in the Finnish population(Reference Vuoristo, Färkkilä and Gylling32). Quercetin intake has been shown to reduce plasma oxidised LDL and TNF-α in persons with ApoE3 and ApoE4, but it decreased serum HDL-cholesterol (P < 0·01) and ApoA1 (P < 0·01) and increased the ratio of LDL- and HDL-cholesterol in APOE E4 (Reference Egert, Boesch-Saadatmandi and Wolffram33). Therefore, the present study shows that the 19q13 loci, including APOE, are involved in lipid profile and inflammation-related diseases.
CRP and leucocytes counts rise rapidly in response to various infectious and inflammatory conditions. Leucocytes and CRP are interrelated with the response to infection and metabolic diseases, including CVD and diabetes(Reference Kashima, Inoue and Matsumoto34). Elevated leucocytes levels are associated with an increased risk for morbidity and mortality in middle-aged populations, and CRP increases rapidly in response to infection and inflammation(Reference Li, Manwani and Leng35). CRP links the innate and adaptive immune systems by activating complements and interaction with Fcγ receptors(Reference Du Clos and Mold36). In the present study, the PRS with 6 SNP and 7 SNP had positive associations with serum CRP concentrations and leucocytes. However, the PRS did not have any association with metabolic diseases. These results indicated that although leucocytes and CRP productions are directly interrelated to infection and metabolic diseases, the PRS was not directly linked to metabolic diseases. The changes in CRP and leucocytes by PRS indirectly influence the risk of metabolic diseases.
Serum CRP concentrations exhibited an interaction of PRS with nutrient intake. The consumption of CHO and fat, but not protein, interacted with PRS to affect serum CRP concentrations. High CHO consumption is associated with a rice-based diet in Korea. Rice contains 81·6 g CHO, 6·4 g protein and 0·5 g fat, fat intake is low, but protein intake is not low in a rice-based diet. Among the types of fatty acids, SFA had an interaction with PRS to influence serum CRP concentrations. These results indicated that high intakes of meats, fish and milk might increase serum CRP concentrations. Since rice was the main attribution for protein intake, protein intake did not interact with PRS to affect CRP, but the fat intake, especially MUFA intake, exhibited the interaction. In Korea, low fat and high CHO intakes are risk factors for MetS and serum CRP concentrations. Similar results have been shown in KNHNES and KoGES studies(Reference Park, Ahn and Lee37–Reference Park, Ahn and Kim40). The present study demonstrated that the risk might be exacerbated with High-PRS in the 6 SNP model, including CRP_rs1205, GUSBP2_rs1250561232, OASL_rs3213545, APOC1_ rs7256200, SLC13A3_rs424697 and HNF1A_rs1169286.
Vitamin D is well known to facilitate innate and adaptive immunity(Reference Park, Ham and Lee41). Vitamin D deficiency is linked to increased sarcopenia occurrence(Reference Park, Ham and Lee41) and viral diseases such as hepatitis, influenza, COVID-19 and AIDS(Reference Siddiqui, Manansala and Abdulrahman42). Sarcopenia is also associated with the impairment of immunity to exacerbate inflammation(Reference Attaway, Welch and Hatipoğlu43,Reference Livshits and Kalinkovich44) . Interestingly, vitamin D intake revealed an interaction with PRS to influence serum CRP concentrations. In the participants with low vitamin D intake, serum CRP concentrations were higher than those with high vitamin D intake. Therefore, vitamin D intake plays a crucial role in modulating serum CRP concentrations in persons with High-PRS.
A strength of the present study is that it was conducted in a large hospital cohort. The results indicated that Asian, and perhaps others, people with a High-PRS need to avoid a high CHO diet to reduce the inflammation risk. People with High-PRS need to check their serum CRP concentrations and leucocytes to protect against metabolic diseases. There were some limitations to the present study. First, the results did not show cause and effect relationships since the research was conducted in a case–control study. Second, the usual food intake was calculated from SQFFQ during the last year, validated by 3-day food records(Reference Ahn, Kwon and Shim45). The results might be under- and overestimated for the usual food intake, although validated SQFFQ is a proper method for measuring food intake in a large cohort study.
Conclusion
Serum CRP concentrations had an association with CRP_rs1205, OASL_rs3213545, APOE_rs429358, HNF1A_rs1169286, APOC1_rs7256200 and SLC13A3_rs424697. The carriers of the High-PRS with the 6 SNP were related to a higher risk of elevating serum CRP concentrations by 2·0 times and leucocytes by 1·1 times. The participants aged ≥55 years with a High-PRS had much higher serum CRP concentrations than Low-PRS. A high-CHO diet and low-fat (especially MUFA) diet exacerbated their elevation in those with High-CRP. These results can be applied to precision nutrition to reduce the low-grade inflammation risk, and persons with high serum CRP concentrations should avoid high-CHO intake (> 70 %) to avoid exacerbating the inflammation. These results suggested that the older participants with inflammation-related PRS potentially worsened inflammation status, especially in diets with high carbohydrate, low fat (especially MUFA) and low vitamin D. After conducting randomised clinical trials or prospective studies, these results can be applied to personalised nutrition to prevent or alleviate inflammation risk.
Acknowledgements
This research was supported by the National Research Foundation of Korea (2019R1A2C1007203).
S. P.: Conceptualization, formal analysis, methodology, investigation, and Writing-original draft; S. K.: Formal analysis, data curation, and writing-review & editing.
The authors declare that they have no conflicts of interest.


