


Executive functions involve a set of cognitive processes, such as attentional control, inhibitory control, working memory and cognitive flexibility, as well as reasoning, problem solving and planning. Executive functions are considered to be of great importance not only for academic performance, but also for mental and physical health as well as for overall success in life( Reference Cukierman-Yaffe, Kasher-Meron and Fruchter 1 , Reference Diamond 2 ). Within executive functions, attentional control is a major component. Attentional control enables us to selectively attend to certain stimuli while inhibiting others and is therefore important in any learning process( Reference Diamond 2 ). Adolescence represents an important period for the development of executive functions( Reference Luna 3 ), and therefore it may be important to identify modifiable factors, such as health behaviours, which can promote cognitive development in adolescence. Diet and physical activity behaviours are two main health behaviours, and we have previously shown that higher levels of physical activity in adolescents is related to higher attention capacity( Reference Vanhelst, Beghin and Duhamel 4 ); however, little is known about the influence of dietary behaviours on attention capacity. A few studies have reported associations in adolescence between specific components of the diet, such as intakes of fish, vegetables, fruits and soft drinks, and cognitive or academic performance( Reference Aberg, Aberg and Brisman 5 – Reference Stea and Torstveit 8 ). However, as pointed out previously( Reference Hu 9 ), it may be difficult to separate out specific effects of single nutrients/foods on health in epidemiological research, and thus dietary patterns may be an appealing alternative. Interestingly, a previous study showed that dietary patterns may be more strongly associated with executive functions than single nutrient/food intakes( Reference Haapala, Eloranta and Venalainen 10 ) and it is possible that such findings also extend to attention capacity. Although only a few studies have examined relationships between diet and attention in childhood, several studies have investigated associations of dietary patterns and macronutrient intakes with other measures of cognitive and academic performance. For instance, healthier diets as indicated by higher scores for the Dietary Approaches to Stop Hypertension dietary pattern (DASH)( Reference Haapala, Eloranta and Venalainen 10 ) and the healthy eating index( Reference Khan, Raine and Drollette 11 ) have been associated with greater cognitive performance. In addition, positive associations between adherence to a Mediterranean dietary pattern and academic performance have been reported in Spanish and Greek children( Reference Esteban-Cornejo, Izquierdo-Gomez and Gomez-Martinez 12 , Reference Vassiloudis, Yiannakouris and Panagiotakos 13 ). Studies have also reported positive associations of PUFA( Reference Zhang, Hebert and Muldoon 14 ) and fibre intakes( Reference Khan, Raine and Drollette 11 ) with cognitive performance. Nyaradi et al. ( Reference Nyaradi, Foster and Hickling 15 ) reported some evidence that a Western dietary pattern at 14 years of age was related to worse cognitive performance, including visual attention, 3 years later. However, to the best of our knowledge, no other study has explored the association of dietary patterns with attention capacity in adolescence, motivating further studies.
Data from the Healthy Lifestyle in Europe by Nutrition in Adolescence (HELENA) study provide an excellent opportunity to investigate the association of diet with attention capacity in adolescents. The HELENA study was designed to provide reliable data on nutrition and health-related variables in a relatively large sample of European adolescents and also included a measure of attention capacity in a subsample of the adolescents. Hence, we utilised data from the HELENA study to investigate the associations of dietary patterns and macronutrient composition with attention capacity in European adolescents.
Methods
Study design and participants
The HELENA study is a cross-sectional multicentre study, which was conducted between 2006 and 2007 in ten European cities from nine different countries( Reference Moreno, De Henauw and Gonzalez-Gross 16 – Reference Nagy, Vicente-Rodriguez and Manios 18 ). A cluster random sample of schools was selected for each city, and detailed information about sampling procedures and study methods are provided elsewhere( Reference Moreno, De Henauw and Gonzalez-Gross 16 – Reference Vyncke, Cruz Fernandez and Fajo-Pascual 19 ). The final study sample consisted of 3528 boys and girls between 12·5 and 17·5 years of age( Reference Beghin, Huybrechts and Vicente-Rodriguez 20 ). The online Supplementary Fig. S1 describes the sample size derivation for this study. In brief, attention capacity data were collected in six study centres (n 656) and complete data regarding attention capacity and diet were available for 400 adolescents from five study centres (Vienna in Austria, Lille in France, Dortmund in Germany, Athens in Greece and Zaragoza in Spain). In the present study, we included the 384 adolescents (165 boys and 219 girls) with complete data for attention, diet and basic confounders (i.e. age, sex, BMI, maternal education, family affluence scale (FAS) and study centre). Furthermore, objective physical activity data were available for 215 of the adolescents. This study was conducted according to the guidelines laid down in the Declaration of Helsinki and all procedures involving human subjects/patients were approved by the corresponding local Human Research Review Committees of the centres involved( Reference Beghin, Castera and Manios 21 ). Written informed consent was obtained from all adolescents and their parents or guardians before enrolment in the study.
Diet
Dietary intake assessment
As described previously in detail( Reference Vyncke, Cruz Fernandez and Fajo-Pascual 19 ), dietary intake was assessed using two non-consecutive 24 h recalls, which were provided by the adolescents using a computer-based self-administered tool (the HELENA-Dietary Intake Assessment Tool)( Reference Vereecken, Covents and Sichert-Hellert 22 ). This tool was validated against 24 h recall interviews. In brief, average macronutrient intakes were very comparable using both methods, and there were strong correlations for all investigated nutrients (r 0·86–0·91) between the methods( Reference Vereecken, Covents and Sichert-Hellert 22 ). Trained dietitians assisted the participants if needed and the assessment was based on six meal occasions the previous day.
Rationale for the selection of dietary patterns
It was decided to examine the associations of the Diet Quality Index for adolescents (DQI-A), the ideal diet and the Mediterranean diet with attention capacity. In brief, DQI-A was chosen as this dietary index takes several important aspects of the diet into account (i.e. quality, diversity and equilibrium) and as it has previously been comprehensively validated against biomarkers, nutrients and foods( Reference Vyncke, Cruz Fernandez and Fajo-Pascual 19 ). Ideal diet was selected because this diet is advocated by the American Heart Association (AHA)( Reference Lloyd-Jones, Hong and Labarthe 23 ). Furthermore, the ideal diet is based on the DASH diet, which previously has been associated with cognitive performance in children( Reference Haapala, Eloranta and Venalainen 10 ). Finally, the Mediterranean dietary pattern was included in the analyses because it has been consistently associated with cognition in older adults( Reference Hardman, Kennedy and Macpherson 24 , Reference Singh, Parsaik and Mielke 25 ), and because some studies( Reference Esteban-Cornejo, Izquierdo-Gomez and Gomez-Martinez 12 , Reference Vassiloudis, Yiannakouris and Panagiotakos 13 ), but not all( Reference Leventakou, Roumeliotaki and Sarri 26 ), have found a corresponding association with cognitive or academic performance in childhood.
Diet Quality Index for adolescents
A comprehensive description of the calculation of the DQI-A has been published previously( Reference Vyncke, Cruz Fernandez and Fajo-Pascual 19 ). In brief, the DQI-A consisted of three components: quality, diversity and equilibrium. Daily diet was divided into nine recommended food groups: (1) water, (2) bread and cereal, (3) potatoes and grains, (4) vegetables, (5) fruits, (6) milk products, (7) cheese, (8) meat, fish and substitutes and (9) fats and oils. Dietary quality expressed whether the adolescent made the optimal food quality choices within a food group and was represented by a ‘preference group’ (i.e. the healthiest foods: cereal/brown bread, fresh fruit and fish), an ‘intermediate group’ (e.g. white bread, minced meat) and a ‘low-nutrient, energy-dense group’ (i.e. the unhealthiest foods: soft drinks, sweet snacks and chicken nuggets) using predefined criteria. The dietary quality score was then calculated by multiplying the amount (in g) of the foods consumed with a weighing factor (+1 for preference group, 0 for intermediate group and –1 for the low-nutrient, energy-dense group) divided by the total amount of food. The diet quality score was expressed as a percentage, and thus it could vary between –100 and 100 %. Dietary diversity describes the degree of variation in the diet. This score was obtained by assigning 1 point for each food group that had at least one serving at the preference level, which was subsequently divided by 9 (which represents the maximum score) and then expressed as a percentage between 0 and 100 %. Dietary equilibrium was calculated as the difference between an adequacy score (percentage of food groups with intake above the minimum recommended intake) and the excess component (percentage of food groups exceeding the upper level of the recommended intake) and ranged between 0 and 100 %. DQI-A was calculated as the mean of the three components and could therefore range from −33 to 100 %, with higher values reflecting a higher diet quality. The DQI-A score was calculated for each day, and the average daily score was used as an indicator of the overall diet quality. The DQI-A score was also categorised in quartiles (quartile 1: <36·7 %; quartile 2: 36·7–51·0 %; quartile 3: 51·1–61·1 %; and quartile 4: >61·2 %).
Ideal diet score
The ideal diet score, as proposed by the AHA, is based on the DASH diet( Reference Lloyd-Jones, Hong and Labarthe 23 ). It consists of five dietary indicators and cut-off values to define a healthy – that is, an ideal – diet( Reference Lloyd-Jones, Hong and Labarthe 23 ). As described previously( Reference Ruiz, Huybrechts and Cuenca-Garcia 27 ), cut-off values for ideal intake levels for a 8368 kJ/d (2000 kcal/d) diet were: (i)≥400 g of fruits and vegetables, (ii)≥28 g of fish, (iii)≥28 gram-equivalent servings of fibre-rich grains (≥1·1 g of fibre/10 g of carbohydrate), (iv)<1500 mg Na and (v)≤145 ml of soft drinks. We scaled these cut-off values individually for energy intakes other than 8368 kJ (2000 kcal). Each dietary indicator at ideal level represented 1 point and, thus the ideal diet score can range between 0 and 5.
Mediterranean diet score for adolescents
Adherence to the Mediterranean dietary pattern was assessed using an adapted version of the traditional Mediterranean Diet Score as reported by Trichopoulou et al. ( Reference Trichopoulou, Costacou and Bamia 28 ). A score for adherence to the Mediterranean diet for adolescents was calculated using nine components: vegetables (excluding potatoes), fruits and nuts (including seeds and olives and excluding juices), cereals (bread and rolls, flour, cereals, rice, pasta, potatoes), legumes (excluding fresh peas, sweet maize and broad beans), fish (including seafood), the ratio of unsaturated fat:SFA, dairy products (white milk, buttermilk, yogurt, fromage blanc and cheese), meat (including poultry) and alcohol. Age- and sex-specific medians for intakes of the nine components were derived from the whole HELENA sample with complete dietary data (n 2330). Subsequently, 1 point was assigned to participants with an intake at or above the median for the seven beneficial components (i.e. vegetables, fruits and nuts, cereals, legumes, fish, the unsaturated:SFA fraction and dairy products), whereas intakes below the median were assigned 0 points. Meat and alcohol were scored in reverse as these components are presumed to be detrimental. Therefore, no intake of alcohol and a meat intake below the median were scored as 1 point each, whereas any alcohol consumption and higher intake of meat (i.e. at or above median) were assigned 0 points. Hence, the possible score for the Mediterranean diet ranged from 0 to 9, with higher values reflecting a higher adherence to the Mediterranean diet.
Macronutrient and fibre intakes
Nutrient intakes were calculated using the German Food Code and Nutrient Data Base (Bundeslebensmittelschlüssel, version II·3.1)( Reference Dehne, Klemm and Henseler 29 ), and the Multiple Source Method was used to estimate the usual dietary intake of nutrients and foods accounting for within-person variability( Reference Harttig, Haubrock and Knuppel 30 ).
Attention capacity
Attention capacity was assessed using the d2 Test of Attention (d2T)( Reference Bates and Lemay 31 , Reference Brickenkamp and Zillmer 32 ) administered in a classroom under the supervision of a HELENA fieldworker as previously described( Reference Vanhelst, Beghin and Duhamel 4 ). The d2T measures selective attention and response inhibition, and its reliability and validity have been tested previously in adolescents( Reference Brickenkamp and Zillmer 32 ). In brief, the d2T is a paper and pencil test consisting of fourteen different rows, each containing forty-seven randomly mixed letters (‘p’ and ‘d’). The letters ‘p’ and ‘d’ appear with one or two dashes above or below each letter. Participants were instructed to mark all ‘d’ that appeared with two dashes (i.e. relevant elements) at a rate of 20 s/row. The remaining combinations of characters were considered as irrelevant elements. The complete duration of the test was 4 min and 40 s with no pauses during the test. Attention capacity was calculated as the number of correctly identified relevant elements minus commissions (i.e. number of irrelevant elements marked), and subsequently this score was transformed into age-specific percentiles. Hence, this variable ranges between 1 and 99, with higher values indicating a higher attention capacity.
Covariates
In this study, we considered age, sex, BMI, maternal education, FAS, study centre and physical activity as covariates( Reference Vanhelst, Beghin and Duhamel 4 , Reference Cadenas-Sanchez, Vanhelst and Ruiz 33 ). Weight and height were measured using standard procedures as previously described( Reference Nagy, Vicente-Rodriguez and Manios 18 ). BMI was calculated as weight (in kg) divided by height (in m2) and classified into categories (i.e. underweight, normal weight, overweight and obese) using international cut-off values described by Cole & Lobstein( Reference Cole and Lobstein 34 ). Information on maternal educational attainment and FAS, two indicators of socioeconomic status, was obtained through two questionnaires that were filled in by the mothers and adolescents, respectively. Maternal educational attainment was classified as elementary school, middle school, high school and university. FAS was categorised as low/medium/high as previously described( Reference Iglesia, Mouratidou and Gonzalez-Gross 35 ). Physical activity was assessed using an accelerometer (model GT1M; ActiGraph) as described in detail previously( Reference Ruiz, Ortega and Martinez-Gomez 36 ). In brief, adolescents were instructed to wear the accelerometer for 7 consecutive days during waking hours apart from time spent in water-based activities. The epoch was set at 15 s and moderate-to-vigorous physical activity was defined as ≥2000 counts/min, as argued previously( Reference Guinhouya, Hubert and Zitouni 37 ). Accelerometry inclusion criteria were as follows: (i) a minimum of 3 measurement days, (ii) at least 8 h/d of valid records and (iii) deletion of 20 min of consecutive epochs with 0 counts; these criteria showed the best fair trade-off between the number of days needed to identify the usual physical activity level (reliability of at least 0·80) and statistical power( Reference Martinez-Gomez, Ruiz and Ortega 38 ).
Statistical analysis
As this was a secondary analysis of HELENA data, we did not calculate statistical power a priori. To investigate linear associations between diet (x) and attention capacity (y), regression analyses were performed. We created three regression models: (1) unadjusted model, (2) model adjusted for basic confounders, that is, age, sex, BMI, maternal education (no university degree v. university degree), FAS (low/medium/high) and study centre (dummy variables) and (3) model adjusted for basic confounders in model 2 plus physical activity. All models with the Mediterranean diet were further adjusted for energy intake. We examined potential sex interactions by including an interaction term (i.e. diet variable×sex) in the adjusted regression models. None of the interaction terms was statistically significant (P>0·05), and thus results are presented for boys and girls together. We conducted ANCOVA, with a Bonferroni post hoc test, to examine whether attention capacity scores differed between quartiles of DQI-A and scores of ideal diet (Fig. 1). The analyses were adjusted for basic confounders, that is, age, sex, BMI, maternal educational attainment (no university degree v. university degree), FAS (low/medium/high as dummy variables) and study centre (dummy variables). Independent t tests or χ 2 tests were conducted to test differences between boys and girls. P<0·05 was considered statistically significant and all hypothesis tests were two-sided. Statistical analyses were performed using SPSS Statistics 22 (IBM).

Fig. 1 Differences in attention capacity score according to (a) Diet Quality Index for adolescents (DQI-A) and (b) ideal diet score in European adolescents using ANCOVA adjusting for age, sex, BMI, maternal educational attainment, family affluence scale and study centre. Estimated marginal means with their 95 % CI are presented. * Difference between quartiles (Q) 1 and 4 in DQI-A was statistically significant (P=0·009).
Sensitivity analysis
There were no differences between the 384 adolescents in the present study and the rest of the participants in the HELENA study in terms of average age, weight, height, BMI and sex distribution (P≥0·18). Furthermore, there were no differences between ideal diet score (P=0·70) and Mediterranean diet score (P=0·17) between the groups, yet participants in the current study had a lower DQI-A than the rest of the participants in the HELENA study (48·4 v. 51·3, P=0·002). In addition, we re-ran all analyses after excluding under-reporters who were defined as those having energy intake divided by estimated BMR≤0·96( Reference Vyncke, Cruz Fernandez and Fajo-Pascual 19 ). In these analyses, results were virtually the same (data not shown).
Results
Descriptive statistics
Descriptive data of the adolescents are presented in Table 1. Overall, 22·7 % of the adolescents were overweight or obese. A higher proportion of the boys met the physical activity recommendations in comparison with girls (P<0·001). In contrast, girls had on average a higher DQI-A and ideal diet score than boys (P≤0·001), whereas no differences were observed between the sexes for attention capacity. All dietary patterns were correlated with each other, that is, DQI-A v. ideal diet score (r 0·47, P<0·001), DQI-A v. Mediterranean diet score (r 0·35, P<0·001) and ideal diet score v. Mediterranean diet score (r 0·27, P<0·001). Furthermore, there was no significant difference in the Mediterranean diet score between adolescents from the centre-north of Europe (Vienna, Lille and Dortmund) and those from south Europe (Athens and Zaragoza) (4·21 v. 4·56, P=0·063).
Table 1 Descriptive characteristics of European adolescents from the Healthy Lifestyle in Europe by Nutrition in Adolescence study (Mean values and standard deviations; percentages)

PA, physical activity; FAS, family affluence scale; DQI-A, Diet Quality Index for adolescents.
* P value of an independent test (continuous variables) or χ 2 test (categorical variables) between boys and girls.
† Overweight and obesity according to Cole & Lobstein( Reference Cole and Lobstein 34 ).
‡ n 215 (eighty-nine boys and 126 girls).
§ ≥60 min moderate-to-vigorous PA per day( 39 ).
Dietary patterns and macronutrients v. attention capacity
Table 2 presents associations of dietary patterns and diet composition with attention capacity. Overall, there was little evidence of associations of single macronutrient and fibre intakes with attention capacity. On the other hand, DQI-A and ideal diet score were positively associated with attention capacity in unadjusted analyses (P≤0·019) and these associations remained statistically significant after adjustments for age, sex, BMI, maternal education attainment, FAS and study centre (P≤0·005). Thus, in adjusted analyses, each standard deviation increase in DQI-A and ideal diet score was associated with 0·16 and 0·15 sd greater attention capacity, respectively. After further adjustments for time spent in moderate-to-vigorous physical activity per day, the strength of the associations of DQI-A and ideal diet score with attention capacity were very comparable. However, the association of ideal diet with attention capacity did not quite reach statistical significance (P=0·054) due to the fact that objective physical activity data were only available for 56 % of the participants. Thus, the sample size was reduced from 384 to 215 when physical activity was included in the models. In contrast, adherence to the Mediterranean diet was not associated with attention capacity (Table 2). Fig. 1 shows the differences in attention capacity according to the quartiles of the DQI-A (a) and points of the ideal diet score (b) after adjustments for basic confounders. Average attention capacity in the highest quartile of the DQI-A was significantly higher than the average attention capacity in the lowest (54·2 v. 41·0, P=0·009).
Table 2 Association of dietary patterns and diet composition with attention capacity in European adolescentsFootnote * (Regression coefficients and 95 % confidence intervals)
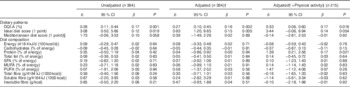
DQI-A, Diet Quality Index for adolescents.
* Analysed using regression analysis. The unstandardised regression coefficient (b) and its 95 % CI, the standardised regression coefficient (β) and the P value (P) are given for each association.
† Model adjusted for age, sex, BMI, maternal educational attainment (no university degree v. university degree), family affluence scale (low/medium/high) and study centre (dummy variables).
‡ Minutes spent in moderate-to-vigorous physical activity per day.
§ All models with Mediterranean diet score were further adjusted for energy intake.
Components of dietary patterns v. attention capacity
The online Supplementary Table S1 presents the association of the components of the three dietary patterns with attention capacity. In brief, a higher diet quality and diet equilibrium components of the DQI-A were associated with higher attention capacity. Furthermore, 1 point from the soft drink and Na consumption components (i.e. lower consumptions) from the ideal diet score was associated with higher attention capacity compared with 0 points (i.e. higher consumption) in adjusted analyses.
Discussion
The main finding of this study was that a healthier dietary pattern, as indicated by higher DQI-A and ideal diet score, was associated with greater attention capacity in European adolescents. Importantly, these associations were largely unaffected by adjustment for relevant confounders such as age, sex, BMI, socioeconomic status and physical activity. Our results may be of importance as they suggest that attention capacity, an important component in executive functions, is influenced by healthy dietary patterns in adolescence.
One interesting finding is that we observed consistent associations of DQI-A and ideal diet score with attention capacity, but there was little evidence for associations of separate dietary pattern components or macronutrient composition with attention capacity. More specifically, although the diet quality and diet equilibrium components of the DQI-A were related to attention capacity, soft drink and Na consumption (from the ideal diet score) were the only food items that were associated with attention capacity in adjusted analyses. The dietary patterns examined in this study also included several potentially important food items such as fish, vegetables and fruits, which previously have been linked to cognitive performance or academic achievement in youth( Reference Aberg, Aberg and Brisman 5 – Reference Stea and Torstveit 8 ). However, in this study, these food items were not consistently associated with attention capacity. Hence, our finding suggests that examining the diet as a whole – that is, in terms of dietary patterns – is a stronger determinant of attention capacity than examining single nutrients/foods, agreeing with a previous study on diet and cognitive performance in children( Reference Haapala, Eloranta and Venalainen 10 ). There are several potential reasons why dietary patterns may be more strongly related to cognitive performance than single nutrients/foods. First, the effect of single nutrients/foods on health may be too small to detect, whereas the combined effect of several nutrients/foods may be large enough to be detectable( Reference Hu 9 ). In our adjusted analysis with the components of ideal diet score, only two of the five components (soft drinks and Na) were significantly associated with attention capacity, whereas two other components (fruit/vegetables and fish) had estimates in the expected direction, but did not quite reach statistical significance. Nevertheless, the combined effect of the variables in the ideal diet score exhibited a strong association with attention capacity consistent across the regression models. Second, variables related to the overall diet, such as macronutrient intakes, may be measured more precisely than single micronutrients( Reference Nelson, Black and Morris 40 ), which may also be the case for dietary patterns. Finally, as pointed out previously( Reference Hu 9 , Reference Nyaradi, Li and Hickling 41 ), nutrients/food in a dietary pattern may also act in a synergistic manner to influence health. Hence, dietary patterns may offer a more holistic description of dietary habits than single nutrients/foods.
Considering that the diet as a whole, rather than single items, was of importance for attention capacity, potential mechanisms behind our findings are difficult to elucidate. Nevertheless, Western diets (which are poor in vegetables, fruits and fish, but rich in meat and refined sugars) have been linked to impaired cognitive function, and suggested mechanisms underlying these associations include increased oxidative stress, neuroinflammation and impaired blood–brain barrier integrity( Reference Francis and Stevenson 42 ). Furthermore, vegetables and fruits are rich in polyphenols, which may have neuroprotective properties( Reference Frisardi, Panza and Seripa 43 ), and in micronutrients such as folate, which may be important for cognitive development( Reference Nyaradi, Li and Hickling 41 ). Nutrients may also act in an interactive manner to influence cognitive development( Reference Nyaradi, Li and Hickling 41 ). Another potential mechanism by which dietary factors may influence cognition is through the brain-derived neurotrophic factor, which is susceptible to changes in the diet and has an important function in the growth and survival of many types of neurons and may influence synaptic plasticity and cognitive function( Reference Hardman, Kennedy and Macpherson 24 , Reference Beilharz, Maniam and Morris 44 ). Furthermore, both insulin resistance and high blood pressure have been suggested to negatively affect cognition( Reference Hardman, Kennedy and Macpherson 24 ). Hence, our identified associations of a high soft drink and Na consumption with worse attention capacity may be partly explained by the fact that excessive soft drink and Na intakes are related to the metabolic syndrome( Reference Narain, Kwok and Mamas 45 ) and higher blood pressure( Reference Mente, O’Donnell and Rangarajan 46 ), respectively. Furthermore, high soft drink and Na intake are also closely connected to a Western dietary pattern, which previously has been associated with worse cognitive and academic performance in youth( Reference Nyaradi, Foster and Hickling 15 , Reference Nyaradi, Li and Hickling 47 ).
Generally, comparisons of our results with other studies are complicated because of differences in age groups, cognitive performance tests, methods of obtaining dietary data and because dietary patterns have been derived differently (i.e. dietary patterns derived a priori v. factor analysis). Nevertheless, Nyaradi et al. ( Reference Nyaradi, Foster and Hickling 15 ) reported some evidence that a higher adherence to the Western dietary pattern at 14 years of age was associated with lower cognitive performance in tests describing visual attention, memory and attention, psychomotor functioning as well as memory and executive functions at 17 years of age. Conversely, associations with the healthy dietary pattern were less pronounced. Furthermore, Sörensen et al. ( Reference Sörensen, Dyssegaard and Damsgaard 48 ) conducted a randomised controlled trial that compared the effect of a healthy school lunch with the usual packed lunch from home (normally rye bread sandwiches). The healthy school lunch improved reading performance; however, no effect was observed on the attention capacity, which is in contrast to our findings. There are some possible explanations for the differences between the studies. Although the intervention increased the overall diet quality by increasing intakes of vegetables and fish as well as some micronutrients, this increase may have been too small to affect attention capacity. Furthermore, the intervention was only performed for 3 months, which may have been too short a time period to have an effect on attention capacity. Finally, the different study designs may also be a contributing factor to the contrasting results. Indeed, the cross-sectional design of the current study does not allow the possibility of drawing any conclusions regarding the direction of the relationship between diet and attention. It has been hypothesised that better executive functions enable healthier food choices( Reference Riggs, Spruijt-Metz and Sakuma 49 ) and Allan et al. ( Reference Allan, McMinn and Daly 50 ) suggested that the association between healthy food intake and executive functions is bidirectional. Hence, further studies are needed to elucidate the association between nutrition and cognitive performance/executive functions.
Our results may be also reconciled to studies that have investigated associations of dietary patterns with other dimensions of cognitive performance than attention capacity in youth. For instance, Haapala et al. ( Reference Haapala, Eloranta and Venalainen 10 ) reported that a higher Baltic Sea diet score and DASH score in boys was associated with higher performance in Raven’s coloured Progressive Matrices, which is suggested to reflect all core components of executive functions. The latter finding can be reconciled with our finding of a positive association between the ideal diet score (which is based on DASH) and attention capacity, although we did not find any evidence for a sex interaction. Furthermore, Khan et al. ( Reference Khan, Raine and Drollette 11 ) reported that a higher diet quality, as indicated by the Healthy-Eating Index-2005, was associated with greater cognitive flexibility, which may be compared with our identified association between DQI-A and attention capacity. Finally, in a study of Greek preschoolers, the derived ‘snacky’ dietary pattern was associated with worse verbal ability, general cognitive ability and cognitive functions of the posterior cortex( Reference Leventakou, Roumeliotaki and Sarri 26 ). However, no association was identified using a ‘Mediterranean-like dietary pattern’, which agrees with the results from the current study. These findings are somewhat unexpected as the Mediterranean diet has consistently been associated with higher cognitive function and reduced risk for mild cognitive impairment or Alzheimer’s disease in adults( Reference Hardman, Kennedy and Macpherson 24 , Reference Singh, Parsaik and Mielke 25 ). Our results are also in contrast with two previous studies that reported positive associations of the Mediterranean diet with academic performance in youth( Reference Esteban-Cornejo, Izquierdo-Gomez and Gomez-Martinez 12 , Reference Vassiloudis, Yiannakouris and Panagiotakos 13 ). One reason for this discrepancy could be that academic and cognitive performance are different concepts that are rather weakly correlated to each other and also depend on the dimension of academic and cognitive performance being examined( Reference St Clair-Thompson and Gathercole 51 ). Furthermore, diet in the studies by Esteban-Cornejo et al. and Vassiloudis et al. was measured using the KIDMED questionnaire( Reference Serra-Majem, Ribas and Ngo 52 ), which enquires only about some aspects of the diet (breakfast skipping, intakes of food and sweets), which are not included in the original Mediterranean diet score devised by Trichopoulou et al. ( Reference Trichopoulou, Costacou and Bamia 28 ). Nevertheless, our supplementary analysis (online Supplementary Table S1) found no strong evidence that any of the components in our Mediterranean diet score were associated with attention capacity. Comparisons with other reports of Mediterranean diet and cognition are complicated by the fact that most studies have investigated middle-aged and older adults( Reference Hardman, Kennedy and Macpherson 24 ) Thus, further studies are needed to clarify the role of the Mediterranean diet in cognition in youth.
A study by Khan et al. ( Reference Khan, Raine and Drollette 11 ) reported an association of higher dietary fibre intake with greater attentional inhibition. However, we were unable to replicate this finding even though our sample size was larger (384 v. sixty-five participants). Potential reasons for the discrepancy between the studies may be the age differences between the subjects and differences in the cognitive tests performed. Finally, we observed no evidence of an association of intakes of PUFA with attention capacity, which is partly in disagreement with the large (n 3666) study by Zhang et al. ( Reference Zhang, Hebert and Muldoon 14 ) who found a positive association between PUFA intake and performance in one of the four examined cognitive tests (i.e. digit span test). Furthermore, Johnson et al. ( Reference Johnson, Fransson and Ostlund 53 ) reported that an intervention increasing the intake of PUFA had a positive effect on reading ability, which was more pronounced in children with attentional problems.
Limitations of this study include the cross-sectional design, which limits the ability to draw conclusions about causality as well as the direction of the associations. Another limitation is that we assessed one dimension of executive functions, attention capacity, using one cognitive test. Further studies are needed to examine other dimensions of executive functions than attention capacity, and could also involve more sophisticated techniques such as electroencephalography and functional MRI. Finally, we cannot rule out the fact that our results are due to the inability to adjust for all confounders. Nevertheless, we were able to adjust for several relevant confounders( Reference Vanhelst, Beghin and Duhamel 4 , Reference Cadenas-Sanchez, Vanhelst and Ruiz 33 ) and the results were materially unchanged. Strengths of this study include the fact that data were collected in a diverse European population using carefully standardised procedures( Reference Moreno, De Henauw and Gonzalez-Gross 16 , Reference Nagy, Vicente-Rodriguez and Manios 18 ). Another strength was that we utilised several dietary patterns.
Overall, our findings suggest that a higher DQI-A and ideal diet score are related to a higher attention capacity, which may be of importance as attentional control represents a key component in executive functions. Given that execution functions are essential for academic achievement and overall success in life( Reference Diamond 2 ), our findings may be of great importance. As 1 sd higher DQI-A and ideal diet score were associated with 0·16 and 0·15 sd higher attention capacity, we believe that these associations are strong enough to be relevant from a public health perspective. However, further research is needed to clarify the role of nutrition in cognitive development, including further longitudinal studies and/or randomised controlled trials.
Acknowledgements
The authors thank the adolescents who participated in the study as well as their parents and teachers. The authors also thank the fieldwork members for their efforts.
The HELENA project was supported by the European Community Sixth RTD Framework Programme (contract FOOD-CT-2005-007034). P. H. was supported by a grant from Henning and Johan Throne-Holst Foundation. F. B. O. and I. E.-C. were supported by the Spanish Ministry of Science and Innovation (RYC-2011-09011 and FJCI-2014-19563). H. H. was supported by grants from the Swedish Society of Medicine and the County Council of Östergötland, Sweden. In addition, this study took place under the umbrella of the ActiveBrains project, funded by the Spanish Ministry of Economy and Competitiveness (Ref. DEP2013-47540); it was further supported by the SAMID III network, RETICS, funded by the PN I+D+I 2017-2021 (Spain), ISCIII-Sub-Directorate General for Research Assessment and Promotion and the European Regional Development Fund (Ref. RD16/0022) and by the University of Granada, Plan Propio de Investigación 2016, Excellence actions: Units of Excellence, Unit of Excellence on Exercise and Health. The funders of the HELENA study had no role in the design, analysis or writing of this article. The content of this paper reflects the authors’ views alone, and the European Community is not liable for any use that may be made of the information contained herein.
Author responsibilities were as follows: K. W., F. G., L. A. M. and F. B. O. designed the research; M. C.-G., J. V., K. W., F. G., L. A. M. and F. B. O. conducted the research; P. H. and F. B. O. analysed the data and had primary responsibility for the final content; P. H., M. C.-G., I. L., I. E.-C., H. H. and F. B. O. wrote the paper. All authors read and approved the final manuscript.
None of the authors has any conflicts of interest to declare.
Supplementary material
For supplementary material/s referred to in this article, please visit https://doi.org/10.1017/S0007114517001441


