


Introduction
Rapid diagnosis of ischemic stroke, which requires clinical and brain imaging assessments, is critical to receive time-sensitive therapy like thrombolysis. Reference Winkler, Fluri and Fuhr1–Reference Adams, del Zoppo and Alberts4 The efforts to increase the number of eligible patients receiving thrombolysis and to reduce the door-to-needle (DTN) time may lead to the administration of thrombolysis to patients who are later diagnosed as stroke mimics (SM). Reference Saver and Barsan5
The diagnosis of ischemic stroke is however not always straightforward, and similar symptoms may develop in a number of medical conditions commonly referred to as “stroke mimics”. The frequency of SM is generally estimated to be 20–50% of all stroke presentations to the emergency; however, the percentage is largely affected by the clinical setting and the expertise of the person who is evaluating the patient. Reference McClelland, Rodgers, Flynn and Price6–Reference Gargalas, Weeks and Khan-Bourne9
Telestroke has been shown to be effective in providing safe intravenous thrombolysis in locations where onsite vascular neurologists are unavailable. Reference Tsivgoulis, Zand and Katsanos10 The ease, availability, and cost-effectiveness of telestroke have led to a high number of consults by emergency physicians in rural hospitals where vascular neurology experts are not available. Reference Ali, Hubert and Switzer11,Reference Hemmen, Meyer, McClean and Lyden12
The frequency of SM thrombolysis among acute stroke presentations in the Canadian province of Alberta is unknown in both primary stroke centere (PSC) where telestroke service is the primary source of decision and comprehensive stroke center (CSC) where the decision of thrombolysis is reached after in-person assessment by a neurologist. The 13 PSCs in Alberta rely primarily on telestroke for acute stroke management including intravenous thrombolysis. In PSCs, the patient evaluation is often done physically by the emergency physician and virtually (through video conference) by a telestroke neurologist. Since the diagnosis of stroke is clinical and supported by imaging, our hypotheses were that higher rates of SM among thrombolysed acute stroke presentation through telestroke when compared to direct neurologist assessment at CSC. Hence, we aimed to study the frequency of SM among thrombolysed patients in both clinical settings and identify the key clinical features. We further compared the rate of thrombolysis complications and mortality in patients with SM versus ischemic stroke.
Methods
Retrospective chart review of prospectively collected data of consecutive patients treated with intravenous Alteplase or Tenecteplase for acute ischemic stroke in the Canadian province of Alberta between 1st April 2016 and March 31st 2021 was included. Alberta has 17 designated stroke centers, of which two are CSCs that provide endovascular treatment in addition to intravenous thrombolysis and 15 primary stroke centers that only provide intravenous thrombolysis. Four of the 15 primary stroke centers have neurology services; however, only two of those have 24/7 on-call neurology service and are not dependent on telestroke for decisions regarding the intravenous thrombolysis, whereas the remaining 13 primary stroke centers rely on telestroke for the treatment of stroke. The primary objective was to compare the rate of mimic thrombolysis among acute stroke presentation with telestroke service versus direct neurology examination. We divided 13 PHCs dependent on telestroke service as one group and the CSCs and 2 PHCs with onsite neurology service as the other.
Data Collection
The QuICR (Quality improvement and Clinical Research) registry captured demographic features including patient’s age, treatment location, date and time of thrombolysis, DTN (door to needle time), pretreatment NIHSS (National institute of health stroke scale), and mortality. 13
The Discharge Abstract Database (DAD) captures all inpatient hospital discharges in the province, including a Most Responsible Diagnosis and up to 24 secondary diagnoses coded using the International Classification of Diseases, Canadian Enhancement (ICD-10). The National Ambulatory Care Reporting System (NACRS) captures all visits to emergency departments in Alberta including a primary diagnosis and up to nine secondary diagnoses coded using ICD-10-CA.
Patient comorbidities were derived from DAD utilizing all ICD-10 codes on the index hospitalization record and all hospitalizations in the 1-year prior. Ninety-day home time was derived from DAD, NACRS, which is calculated as 90 minus nights spent away from home. Ninety-day home time is the total number of days within 90 days of an index stroke event. A patient was back at their premorbid living situation without an increase in the level of care. Reference Kamal, Jeerakathil and Stang14,Reference Amy, Rogers and Wang15 Connect Care and PACS (Picture Archiving and Communication System) were used to review the brain imaging data, clinical characteristics, and diagnosis when available. Connect Care is a provincial electronic clinical information system used by acute care hospitals that are under the accountability of Alberta Health Services (AHS), hospital diagnostic facilities, hospital labs, hospital pharmacies, and other AHS clinics and facilities.
A list of community stroke presentations with age 20 years or older treated with acute thrombolytic therapy in Alberta between April 1, 2016, and March 31, 2021 was generated using the QuICR registry. This excludes patients with in-hospital stroke onset; Patients treated on the UAH Stroke Ambulance; Patients admitted to Lloydminster General Hospital; Out-of-province patients. Linking the QuICR-based list to the DAD, a final discharge diagnosis of stroke, TIA/recovered stroke, and SM were identified for each case. The ICD codes used for stroke and TIA/recovered stroke in DAD were G08, H341, I63, I64, I676, G45 (except G454), H340, Z515, and Z509. Stroke/TIA was identified in DAD in one of the following conditions:
-
When the most responsible diagnosis during the admission was recorded as one of the above diagnostic codes.
-
Or, a condition that existed prior to admission and was a significant source of the patient’s stay in a facility recorded as one of the above diagnostic codes.
-
Or, a diagnosis associated with the first, second, or third service transfers was recorded with one of the above diagnostic codes.
SM was identified as thrombolysed patient (recorded in the QuICR Registry) who did not have stroke coded as described above.
The case files of patients who were diagnosed as SM and TIA were reviewed by the study team member, and the neuroimaging (CT head and MRI brain) was reviewed in all cases when available, including patients with a diagnosis of stroke. Neuroimaging with radiology report was reviewed by a stroke neurology fellow. In patients who were diagnosed with a stroke, the primary objective was to look for the hemorrhagic transformation in a 24-hour post-thrombolysis image. In patients who were diagnosed as SM and TIA/recovered stroke, a careful review of MRI-DWI (diffusion-weighted imaging) and post-thrombolysis CT head was done to rule out infarct and post-thrombolysis hemorrhage.
The final diagnosis of SM in our report is based on the alternate clinical diagnosis, absence of ischemic lesion on diffusion-weighted magnetic resonance imaging (DWI-MRI), repeat computed tomography (CT) head/MRI with an alternate diagnosis than ischemic stroke, or positive metabolic/infectious workup on our review of patient’s records and review of 3 months follow-up note from the neurologist. The diagnosis of TIA/recovered stroke was based on the clinical diagnosis by a treating physician/neurologist, presentation of acute cerebral ischemia with a resolution of symptoms within 24 hours of onset, absence of acute infarct on post-treatment neuroimaging, and symptoms and signs were not explained by any alternate diagnosis.
Data Analysis
The patients were stratified into two groups based on the most possible diagnosis as either stroke or SM who received thrombolysis. The SM cases were further divided into two groups based on the clinical setting where the therapeutic decision was reached, telestroke versus onsite. Normally distributed continuous data were expressed as mean and standard deviation. Non-normally distributed continuous data were expressed as median with interquartile range. Categorical data were presented as a total number with the corresponding percentage. Differences in continuous variables were assessed by the T-test for the means and Mann Whitney U test for the medians, and the chi-square test or Fischer’s exact test were used for categorical variables.
Ethics Approval
Ethical approval was obtained from University of Alberta Ethics and review committee. (Pro00112025).
Result
A total of 2471 patients who received thrombolysis between April 1st, 2016 to March 31st, 2021 for symptoms of ischemic stroke were identified using the QuICR registry. Out of 2471 patients, 169 patients had discharge diagnoses other than stroke/TIA as per DAD and were identified as SM, 2251 as ischemic stroke, and 50 cases as TIA. However, after the chart and imaging review for the 169 cases identified by DAD as SM, 109 were actually diagnosed as SM. Of the 60 remaining cases, three were TIAs/recovered stroke post thrombolysis and the remaining 57 were acute ischemic strokes.
Among the 50 patients who were labeled as TIAs in the DAD, 37 actually had the most likely diagnosis of TIA/recovered stroke at discharge, three patients were eventually diagnosed as SM, and the last 10 were finally diagnosed as ischemic stroke with imaging confirming the diagnosis.
Finally, after reviewing all the patients’ records who were identified as SM and TIA, there was a total of 112 (4.53%) patients had the diagnosis of SM and the remaining 2359 (95.46%) actually had an ischemic stroke; this includes 40 (1.61%) cases of TIA/recovered stroke (Figure 1).
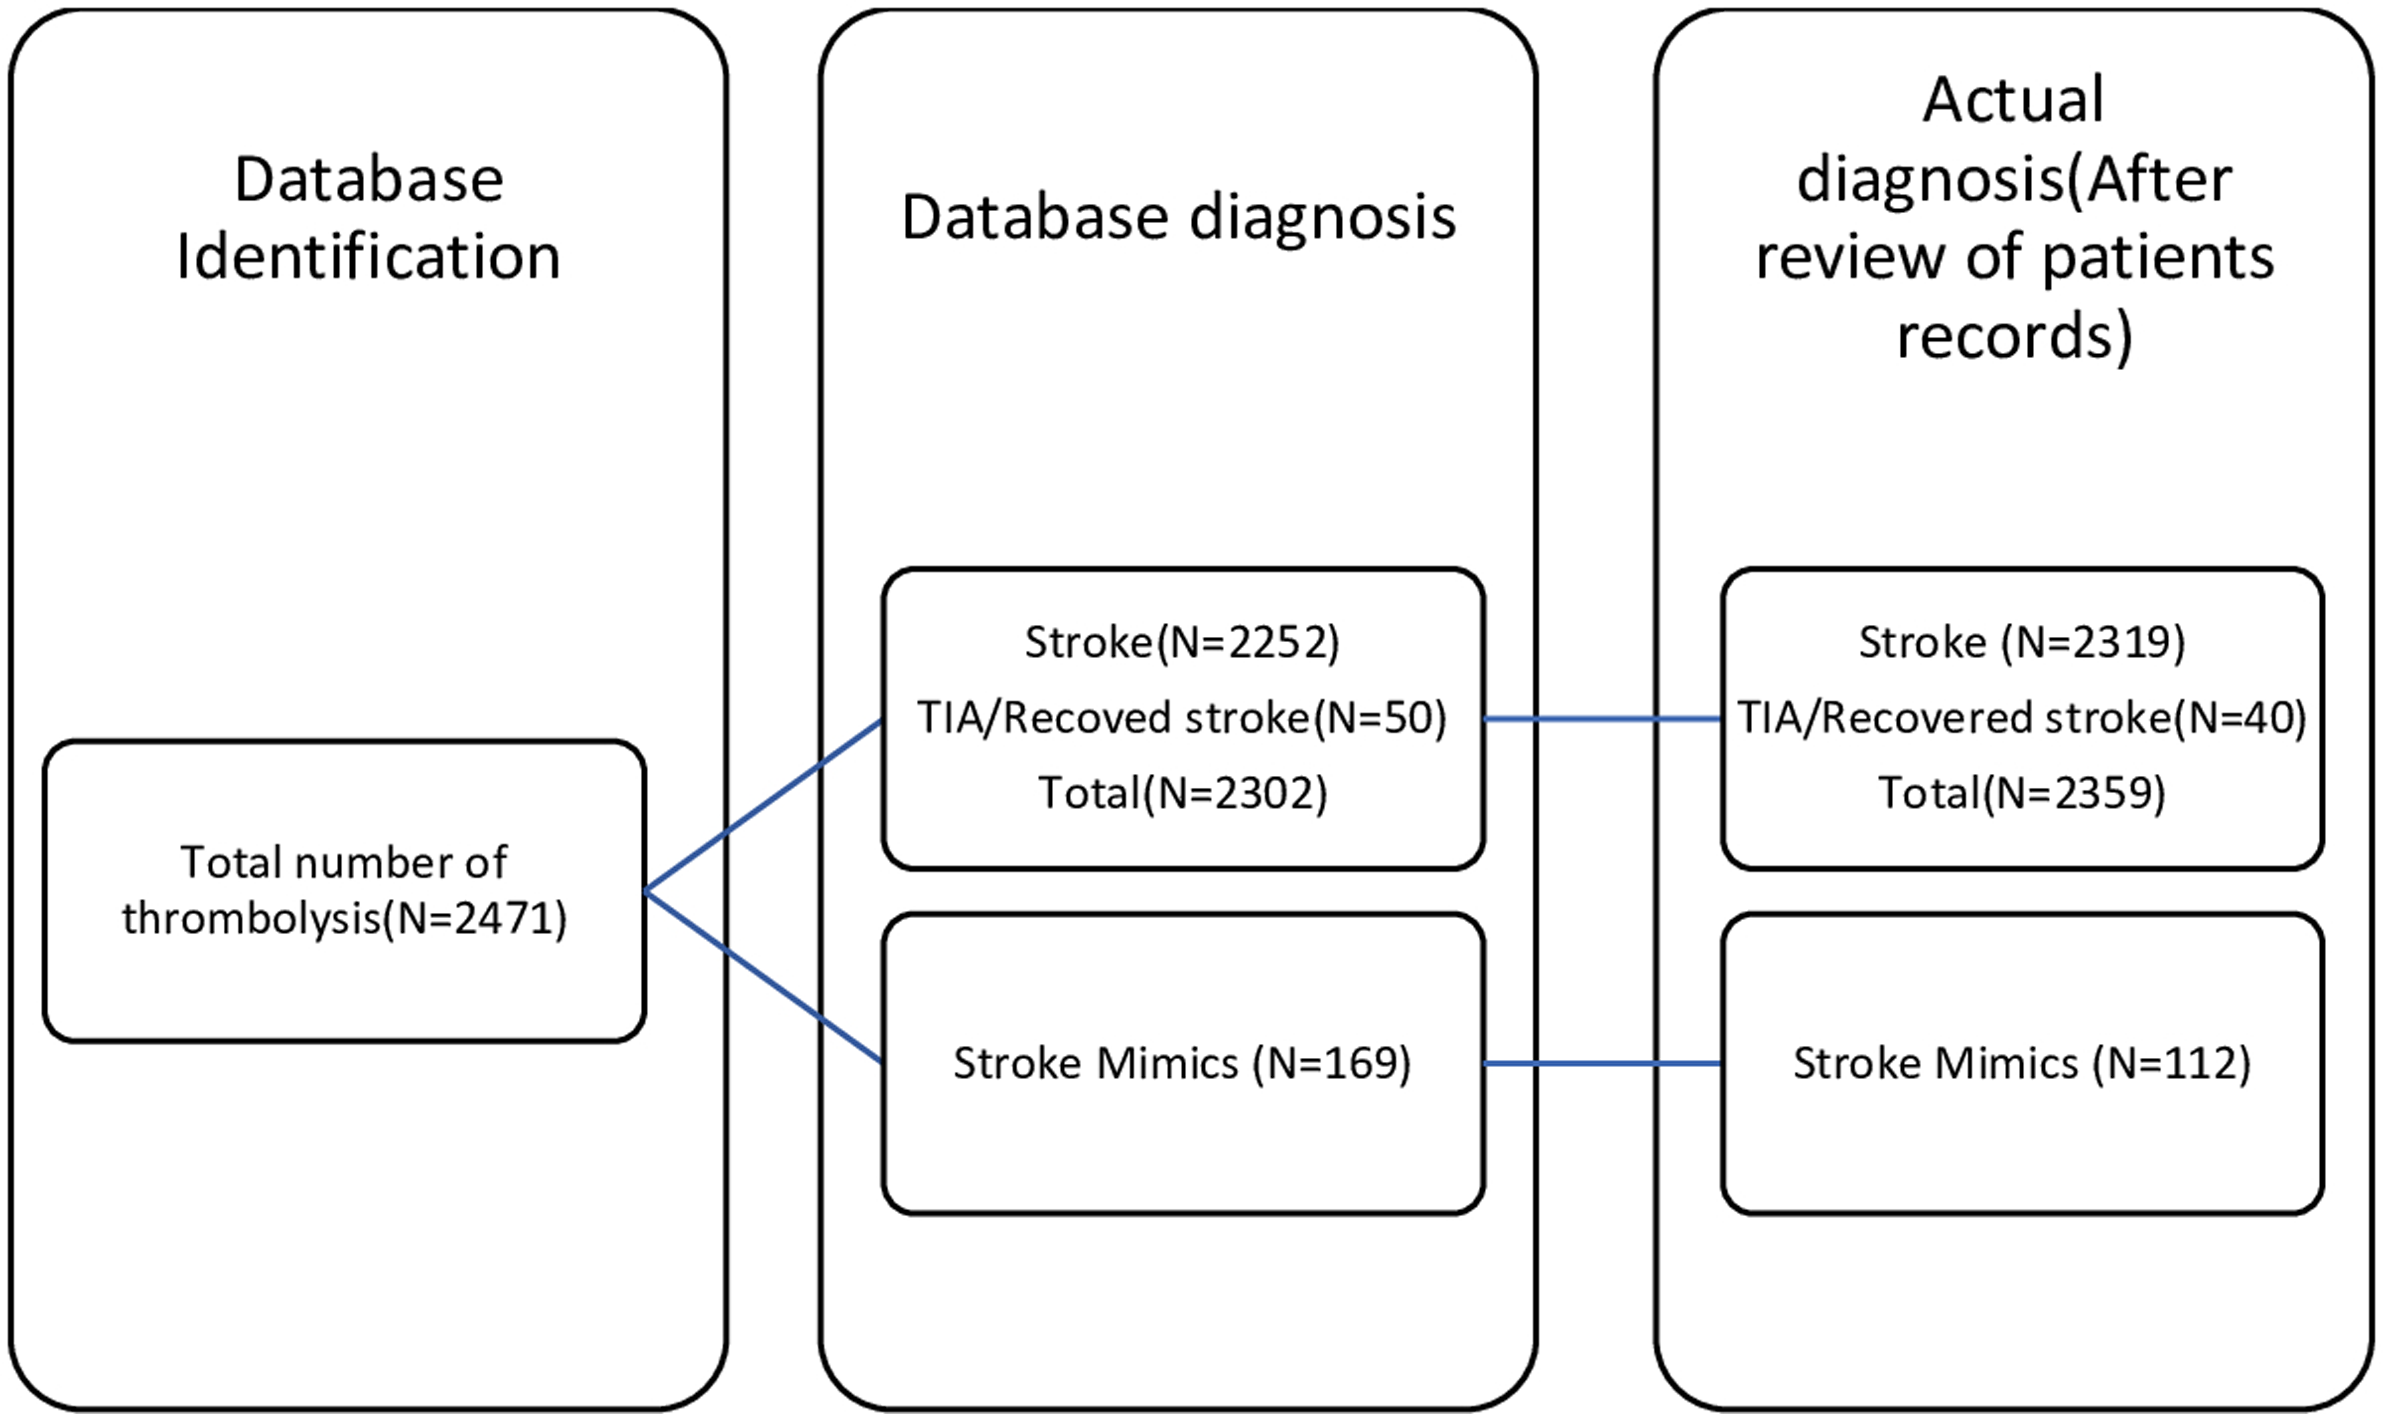
Figure 1: Comparison of database vs actual diagnosis.
Reason for Misclassification of Stroke as SM
The most common error that resulted in true strokes being classified as SM was where the discharge diagnosis was coded as culprit artery stenosis/occlusion. This was miscoded as a SM in 25 cases (43.8%). Cardiac conditions leading to embolic stroke, where the primary discharge diagnosis included atrial myxoma, severe valvular abnormality, dilated cardiomyopathy, and myocardial infarction were misdiagnosed as SM in 10 cases (17.54%). Additional strokes that were misdiagnosed as mimics included diagnosis of cardiac/respiratory arrest in 3 (5.26%) cases, diagnosis of hemiplegia in 3 (5.26%) cases, carotid artery injury, and vertebral artery dissection in 2 (3.50%) cases. There were single cases of internuclear ophthalmoplegia, dysphagia/aphasia, epilepsy, and unspecified sign involving cognitive function, cerebrovascular disease, disorientation, cerebral atherosclerosis, and unspecified ataxia in 8 (14.03%) cases. Non-neurological diagnosis included hypokalemia, malignant neoplasm of the ureter, pneumonia, malaise, and fatigue in 5 (8.77%) cases (Figure 2).

Figure 2: Coding error which misidentified actual stroke as mimics.
Baseline Demographics
Baseline characteristics, stroke severity, and outcomes in patients of stroke and SM are presented in Table 1. In comparison with stroke, who had a mean age of 71.05 (±14.56), SM patients were younger and had a mean age of 61.66 (±16.15). SM was seen more frequently in females. Patients with stroke had substantially higher vascular risk factors including hypertension, diabetes mellitus, atrial fibrillation, and coronary artery diseases compared to SM. Stroke severity measured by NIHSS at presentation was considerably higher in stroke when compared to SM. Stroke patients had the shortest median (IQR) DTN time of 42 (30–63) minutes, whereas in SM the median DTN was 45.5 (32–62.5) minutes. Only one SM patient had a minor intracranial hemorrhage in the right parieto-occipital region on follow-up CT head. MRI brain confirmed the finding with no adjacent areas of diffusion restriction or ischemia. This individual was ultimately diagnosed with metabolic encephalopathy. There were no extracranial major bleeds or orolingual edema in the SM group. The 90-day home time, which is an indirect measure of functional outcome, showed that individuals with acute ischemic stroke had significantly lower home time at 90 days with median (IQR) of 74 (0–85) and 85 (80–87). There was no death among patients of SM during their hospital stay, whereas 11.69% of acute ischemic stroke died in hospital during the admission for acute stroke (Table 1).
Table 1: Comparison between stroke/TIA and stroke mimics (SM) who received thrombolysis

Comparison between Telestroke Sites and CSCs
During the study period, 4.35% of patients thrombolysed for acute stroke presentation in Alberta were SM. The rate of SM among thrombolysed patients in PSC treating via telestroke was 5.36% (27) when compared to the CSC and PSC with 24/7 on-call stroke neurology service, which was 4.3% (85). No statistically significant difference was observed (P = 0.6) (Table 2).
Table 2: Rate of thrombolysis of stroke and stroke mimics at CSC, PSC with neurology service and PSC via tele-stroke

Frequency of SM Thrombolysis during Daytime and Nighttime
To examine the association between nighttime admission and frequency of SM thrombolysis in primary stroke centers, we divided the day into mornings 8:01 am to 5:00 pm, 5:01 pm to 10:00 pm, and 10:01 pm to 8:00 am. We compared the time of the day when the SM patient received thrombolysis with stroke patients. We found no significant difference between the groups (Table 3).
Table 3: Time of thrombolysis of stroke and mimics at primary stroke centres with the help of tele-stroke

Comorbidities in SM
Vascular risk factors for stroke were higher in CSC compared to PSC. In contrast, a history of psychiatric illness [17 (20%) vs 11 (40.74%)] and migraine [10 (11.76%) vs 7 (25.92%)] was higher in SM patients treated at PSC that relied on telestroke. Thrombolysis was initiated in three instances at a CSC where it was discontinued prior to infusion completion upon confirmed diagnosis of SM (Supplemental Table).
Imaging
All patients underwent MRI or CT scans after IV thrombolysis with alteplase or tenecteplase (Table 1, Supplemental table). Post-thrombolytic DWI-MRI was available in a total of 99 (88.39%) SM patients which were negative for diffusion restriction. The MRI was available in 77 (90.58%) out of 85 in CSC and 22 (81.48%) out of 27 patients in PSC. MRI brain demonstrated metastatic lesions in two patients, demyelination in two patients, and white matter hyperintense lesion in one patient with a final diagnosis of seizure. Further imaging with an MRI of the spine demonstrated spinal epidural hematoma in two patients and cord hyperintensity suggestive of myelopathy in one patient.
Final Diagnosis
The final diagnosis in SM and the comparison between the CSC and PSC are shown in Table 4. Complicated migraine/migraine was the most common diagnosis, followed by somatization/conversion disorder/panic attacks, seizures, delirium/encephalopathy, nonspecific neurological symptoms, and peripheral vertigo. There was one case of rotator cuff injury in PSC and one in CSC who received thrombolysis. Of note, two (7.4%) SM patients who received thrombolysis had a final diagnosis of fracture of the femur and humerus at PSC.
Table 4: Diagnosis of treated mimics

Comparison of Outcomes in SM Derived from Linking QuICR and DAD versus Actual SM
Table 5 shows the comparison of the outcome of true SM’ versus patients who were identified as SM from the data derived from linking QuICR with DAD. Four (2.36%) patients identified as SM from DAD had intracerebral hemorrhage post thrombolysis, compared to only 1 (0.82%) patient in the true SM group. In the database (DAD) derived SM group, 12 patients (7.1%) died during admission, compared to 0 in the true SM group. In true SM, the median home time increased from 83 to 85 days, when we excluded wrongly identified SM.
Table 5: Comparison of outcomes of database identified mimics vs actual mimics

Discussion
We reviewed our experience with thrombolysis in SM in patients treated at 2 CSC/2 PSC with Neurology service and via telestroke in 13 PSCs in the province of Alberta, Canada. The main findings from our study reveal that SM accounted for 4.5% of thrombolysis during the study period. The rates of thrombolysis in mimics were similar in CSC and PSCs. The rate of SM among thrombolysed for acute stroke symptoms in Alberta is low when compared to previously published studies which have reported 1.8–14% of all acute stroke thrombolysis. Reference Zinkstok, Engelter and Gensicke16,Reference Chernyshev, Martin-Schild and Albright17 In our study, we collected data from the provincial registry and database and additionally reviewed the actual cases in the electronic records and PACS for images and clinical information. The database derived 169 SM out of 2471 individuals who received thrombolysis for stroke symptoms. However, our review of the electronic records identified only 112 patients that had the most likely diagnosis of SM; as for the remaining patients, the diagnosis of SM was incorrect.
In our study, the challenges of identifying SM using ICD codes in discharge data were responsible for approximately one-third of the patients with acute stroke being misclassified as SM. Including the misclassified patients would have overestimated the occurrence of complications such as cerebral hemorrhage from an actual rate of 0.82% to 2.36% and a mortality rate of 0 to 7.1% in thrombolysed SM population. Hence, it is important to recognize such errors, which will falsely increase the number of SM being treated with thrombolytic therapy. It also results in higher-than-expected cerebral hemorrhagic complication rates thereby leading to hesitancy in treatment when there is some doubt in the diagnosis of acute stroke. Therefore, while the use of registries and databases are important for research purpose, researchers should be cautious to look for errors that could skew the results and have an impact on clinical outcomes.
An important objective of the study was to compare the rates of SM treated in the CSC versus PSCs. When the rate of thrombolysis of SM was compared between CSCs (including primary stroke centers with 24 hours neurology service) and primary stroke centers that rely on telestroke, we found no significant difference between the two (4.3%) in CSC versus (5.36%) in PSC. When compared to other studies of SM thrombolysis via telestroke, our rate of SM thrombolysis via telestroke is in the lower range. In a study by Lee VH, 64 (23.7%) of 270 patients receiving thrombolysis via telestroke had the final diagnosis of SM. Reference Lee, Howell, Yadav, Heaton, Wiles and Lakhani18 Sinn et al. reported 53 of 195 patients who received thrombolysis via telestroke for stroke symptoms were ultimately diagnosed with SM, accounting for 27.2% of SM thrombolysis. In-hospital patients, however, had a higher rate of mimic thrombolysis, with 13 of 88 patients accounting for 14.8% of all SM thrombolysis. Reference Sinn, Kasab, Banerjee and Ozark19 In a study, Yaghi et al. 4.3% of patients who received thrombolysis after being diagnosed with a stroke face-to-face at a primary stroke center and 7.8% of those diagnosed via telestroke were SM. Reference Yaghi, Rayaz, Bianchi, Hall-Barrow and Hinduja20
Diagnosing errors, poor decision-making, mistakes, and accidents are more common during night hours than during the day. Reference Miller, Piro, Rudisill, Bookstaver, Bair and Bennett21,Reference Niu, Chu and Chen22 Since the diagnosis of stroke is clinical and supported by imaging, we assumed that thrombolysis of mimics would be more common at night and via telestroke, where the clinical diagnosis relied mostly on emergency physician assessment and a virtual assessment via video chat. Hence, we examined the association between nighttime admission and frequency of SM thrombolysis among acute stroke presentation through telestroke. We compared the time of the day at which the mimic patient received thrombolysis with that of stroke and TIA’s. We found no significant difference between the groups.
Tsivgoulis et al., in a prospective 5 years study and comprehensive meta-analysis, found that patients with SM had a considerably lower risk of intracerebral hemorrhage and a better functional outcome, three times higher than patients with ischemic stroke. Reference Gargalas, Weeks and Khan-Bourne9 According to a multicentre observational study, it was found that SM was younger, more typically female, and had fewer risk factors except smoking and previous stroke or transient ischemic attack. Reference Winkler, Fluri and Fuhr1 These findings are comparable with our study.
The most common diagnosis of SM who received thrombolysis was migraine/migraine equivalent and functional neurological disorder, followed by seizures, encephalopathy/delirium, and nonspecific neurological symptoms. These findings are comparable with previous studies of thrombolysis in SM. Reference Winkler, Fluri and Fuhr1,Reference Sinn, Kasab, Banerjee and Ozark19,Reference Keselman, Cooray and Vanhooren23 Comparing the final diagnosis of SM between CSC and PSC, we noted that PSC had a greater number of unusual diagnoses of SM, such as fracture of humerus and femur, and rotator cuff injury, which are probably easily differentiated from stroke if a direct evaluation was done by a neurologist.
When the diagnosis is ambiguous, a DWI/ADC MRI scan of the brain (where the time required is about 10 minutes) can help distinguish between SM. According to a report, 0.5% of SM received thrombolysis at a comprehensive center when MRI was used as the imaging method, whereas 16% of SM received thrombolysis via telestroke where CT was the only imaging modality. Reference Burton, Luby and Nadareishvili24 When in doubt, an emergency MRI can help reduce the frequency of SM thrombolysis cases. However, in most primary healthcare facilities, emergency MRI is not available. In a study using multimodal CT imaging, Seiger et al. found that SM was more likely to have a normal Tmax pattern in CT Perfusion studies, and even if the Tmax pattern was abnormal, the patterns were fully discordant with clinical symptoms, with a negative predictive value of 91% for identifying mimic. Reference Siegler, Rosenberg and Cristancho25 Another study by Prodi et al. reported low sensitivity but high specificity of multimodal CT in diagnosing mimics. Reference Prodi, Danieli, Manno, Pagnamenta, Pravata and Roccatagliata26 Hence, liberal use of CTA/CTP may aid in the diagnosis of SM and prevent unnecessary thrombolysis of mimic patients. Reference H.Buck, Akhtar, Alrohimi, Khan and Shuaib7
There are some limitations to the study. This was a retrospective chart review of cases from the provincial registry and database, who received thrombolysis for acute stroke presentation and ultimately had a discharge diagnosis other than stroke. The review of the chart was done for cases who were diagnosed as SM/TIA. Chart was not reviewed for patients who had the primary diagnosis of stroke as per the DAD registry. This could have caused the missing of false negative cases that were actually mimics but diagnosed as a stroke. However, given that SM diagnosis in our study is primarily based on treating physicians’ assessment supported by laboratory and imaging evidence, we assume that this number is low. The diagnosis of SM or TIA was based on the treating physician’s assessment and the data/imaging was not available for our review in 7 cases of SM and 276 cases of stroke. MRI which is more sensitive in diagnosing small strokes was available only in 88% of SM.
Conclusion
The risk of thrombolysis in SM via telestroke is similar to treatment in person at CSC; given the low prevalence of hemorrhage and systemic complications, rapid treatment is likely to be more beneficial than delaying the treatment for extensive examination, additional imaging, or transfer of patients to another center. Future clinical research would benefit from more work on identifying a validated administrative data case definition for SM.
Supplementary Material
To view supplementary material for this article, please visit https://doi.org/10.1017/cjn.2022.325
Conflict of Interest
We have no conflicts of interest to disclose.
Statement of Authorship
Research Project Conception: AS, KK.
Research project organization, Statistical analysis design: AS, KK, RN, AA, MLH, JS.
Data collection: JS, MLH, EY and RN.
Statistical analysis: RN.
Writing of the draft: RN, AS.
Review and critique: AS, KK, JS, MLH, EY, AA.


 Open access