


Voluntary fortification of foods has historically been a successful strategy in reducing nutritional inadequacy in the USA(1). Shifting dietary patterns, particularly emerging nutritional risks from both nutrient inadequacies and, potentially, excess intakes of energy and some nutrients, require that food manufacturers periodically re-examine their fortification policies. Public health efforts to reduce the risk of dietary inadequacy include encouraging dietary diversity, fortification and targeted programmes with dietary supplements(Reference Bailey, West and Black2). Indeed, current US fortification practices play a substantial role in reducing the prevalence of intakes below the Estimated Average Requirement (EAR), the Dietary Reference Intake (DRI) threshold for population nutritional adequacy, across all age groups(Reference Fulgoni, Keast and Bailey3,Reference Berner, Keast and Bailey4) .
The DRI, developed by the US Food and Nutrition Board of The National Academies, provide nutrient reference values for over forty nutrient substances and serve as the scientific basis for the development of food guidelines in the USA and Canada(5–7). The DRI are comprised of a set of values including: (i) the EAR, which is used to assess population nutritional adequacy; (ii) the RDA, which is the average daily level of intake sufficient to meet the nutrient requirements of nearly all healthy people; and (iii) the Tolerable Upper Intake Level (UL), which is the maximum daily intake unlikely to cause adverse health effects.
The DRI can be used to assess population-level nutrient intakes and form the basis for the Daily Value (DV) recommendations by the US Food and Drug Administration (FDA)(1). The DV are used for food labelling in the USA and provide information on how much of a nutrient, relative to the daily requirement for a 8368 kJ (2000 kcal) diet, is in a serving of food on the Nutrition Facts Panel of packaged food products. The FDA regulates the contents of the Nutrition Facts Panel including the reference amount customarily consumed (RACC), which is used as the basis for the labelled serving size, and the DV. Recently, the FDA updated the requirements of the Nutrition Facts Panel including the RACC for some foods and the DV for several nutrients under Nutrition Label Reform (NLR). The NLR regulation was finalized in 2016 and large companies are required to comply with the regulation by 1 January 2020. Both the changes in RACC and the changes in DV will impact fortified nutrients in foods: companies will either need to change the amount of nutrients added per 100 g of food to maintain their current labelled percentage of the DV (%DV) values or change the labelled %DV if products are not reformulated.
Greater ready-to-eat (RTE) cereal consumption (compared with low/no consumption) is associated with higher nutrient intakes in the diets of US(Reference Berner, Keast and Bailey4,Reference Fulgoni and Buckley8) and European(Reference Michels, De Henauw and Breidenassel9,Reference Priebe and McMonagle10) children and adolescents. RTE cereal consumption has been associated with enhanced intakes of many vitamins and minerals in adults and children, either directly through its consumption(Reference Fulgoni and Buckley8,Reference Balvin Frantzen, Trevino and Echon11) or through its co-consumption with milk(Reference Hill, Jonnalagadda and Albertson12). Serum folate and vitamin B12 concentrations were higher(Reference Yeung, Cogswell and Carriquiry13) in children who consume RTE cereals(Reference Albertson, Affenito and Bauserman14) and RTE cereal consumption in older adults was associated with higher intakes of fibre, whole grains, and several vitamins and minerals(Reference Albertson, Wold and Joshi15). While from foods alone few adults exceed the UL, some children and adolescents (aged 2–18 years) exceed the UL for folic acid (3 %), Cu (3 %), vitamin A (5 %) and Zn (13 %), especially among children using dietary supplements(Reference Bailey, Fulgoni and Keast16). Recent data from the Feeding and Infants and Toddlers Study (FITS 2016) suggest that usual intakes from diet and supplements of >30 % of infants and toddlers were above the UL for vitamin A and Zn(Reference Bailey, Catellier and Jun17,Reference Jun, Catellier and Eldridge18) .
Because RTE cereal is a major source of nutrients in the American diet, periodic re-evaluation of the fortification approach of RTE cereal should be undertaken to ensure that nutrients within RTE cereal are still meeting public health needs for both children and adults. Furthermore, changing the nutrient content of RTE cereal in response to NLR may impact population-level intakes of several key nutrients, changing the percentage that is consuming either below recommendations (i.e. below the EAR) or above the UL. Therefore, the purpose of the current analysis was to use dietary modelling to test an optimized fortification strategy for RTE cereal that balances the amount of nutrients to not unduly increase the likelihood of contributing towards dietary intakes above the UL while retaining the public health benefit of reducing the risk of nutritional inadequacy.
Methods
Survey design and participants
The National Health and Nutrition Examination Survey (NHANES) is a nationally representative, cross-sectional series of surveys that samples the resident, non-institutionalized, civilian US population, collected by the National Center for Health Statistics of the Centers for Disease Control and Prevention(19). Data from the 2013 to 2014 NHANES cycle were used for the current analyses. Written informed consent was obtained for all participants or proxies and the NHANES survey protocols were approved by the Research Ethics Review Board at the National Center for Health Statistics.
NHANES data are collected in multiple ways. First, participants are asked to complete an in-person household interview, during which demographic data are collected through a computer-assisted personal interview. Second, participants are asked to attend a health examination in a mobile examination centre and complete an in-person 24 h dietary recall (24HR)(Reference Johnson, Dohrmann and Burt20). The final data collection occurs via telephone when a second 24HR is collected; this occurs approximately 3–10 d after the health examination, with an emphasis on collecting both weekday and weekend dietary intakes. Both 24HR are collected as part of the US Department of Agriculture’s What We Eat in America (WWEIA) using the validated Automated Multiple-Pass Method(Reference Moshfegh, Rhodes and Baer21,Reference Blanton, Moshfegh and Baer22) .
The analytic sample included 8167 participants aged ≥1 year who had complete 24 h dietary intake data. Results were also examined by age group: toddlers aged 1–3 years, n 559; children aged 4–12 years, n 1540; adolescents aged 13–18 years, n 992; and adults aged ≥19 years excluding those pregnant or lactating (n 100), n 5076. The age groups of 1–3 years and ≥4 years were purposefully chosen because of the FDA’s prescribed RACC for foods on a category basis differ for these population age groups. RACC reflect the regulatory serving size that food manufacturers must utilize to calculate the labelled serving size on their products(23,24) . We defined RTE cereal eaters as those participants who reported eating any quantity of RTE cereal (see definition of RTE cereal below) on their first 24HR.
Dietary data
The US Department of Agriculture’s Food and Nutrient Database for Dietary Studies (FNDDS) is used to calculate the nutrient values of all reported foods and beverages within NHANES(25). Individual foods and beverages within FNDDS are grouped according to the WWEIA Food Categories, which includes two categories for RTE cereal (‘ready-to-eat cereal, lower sugar’ and ‘ready-to-eat cereal, higher sugar’) which we combined. We included all FNDDS food codes within the WWEIA RTE cereal categories in the current analysis. Nutrients from dietary supplements were not analysed in this food optimization project based on the rationale that an underlying premise of the 2015–2020 Dietary Guidelines for Americans is that ‘nutritional needs should be met primarily from foods’(6). The scope of this project included nutrients that are typically added to RTE cereal, including the B-vitamins (thiamin, riboflavin, niacin, vitamin B6, folic acid, vitamin B12), vitamins A, D and C, and Ca, Fe and Zn(26–28).
Ready-to-eat cereal fortification models
We considered the amount of nutrient in RTE cereal per 100 g of cereal and adjusted the level of fortification to reflect: (i) the change in fortification according to the three scenarios below; and (ii) the changes to the DV as required by the FDA’s NLR (see online supplementary material, Supplemental Table S1) and the changes in the RACC for RTE cereal as part of NLR(24). Compared with previous DV, the NLR DV for some nutrients decreased (thiamin, riboflavin, vitamin B6, vitamin B12, Zn), increased (vitamin D, vitamin C, Ca), changed units (vitamin A, niacin, folate) or did not change (Fe).
For labelling purposes, there are three categories of RTE cereal based on their density (g/cup), each with a different RACC: (i) light-weight cereal which weighs <20 g per cup; (ii) medium-weight cereal which weighs 20 g or more but less than 43 g per cup and also includes high-fibre cereals containing 28 g or more fibre per 100 g; and (iii) heavy-weight cereals, weighing 43 g or more per cup or biscuit-type cereal. The RACC for two categories of RTE cereal changed under NLR: the RACC for medium-weight cereal changed from 30 to 40 g and the RACC for heavy-weight RTE cereal changed from 55 to 60 g. The RACC for light-weight cereal remained 15 g. This change in RACC will influence the ‘density’ of nutrients per 100 g of cereal if the labelled %DV of nutrients does not change. For example, if a cereal fortifies at 20 %DV for Fe at a 30 g RACC, it will contain a greater absolute amount of Fe per 100 g (approximately 15 mg per 100 g RTE cereal) than a 40 g RACC that also labels at 20 %DV of Fe (approximately 9 mg per 100 g RTE cereal).
For the present study, we assumed that the entire nutrient content of RTE cereal of those vitamins and minerals listed above were from fortification. The fortification scenarios and amount of nutrients per 100 g for the three fortification models are presented in Table 1(24,29) .
Table 1 Current and proposed levels of fortification of US ready-to-eat (RTE) cereal

NLR, Food and Drug Administration’s Nutrition Label Reform(24); DV, Daily Value; RACC, reference amount customarily consumed; %DV, percentage of the Daily Value; RAE, retinol activity equivalents; NE, niacin equivalents; DFE, dietary folate equivalents.
* Current fortification levels are a typical representation of most RTE cereals; however, not all RTE cereals are fortified to these precise levels. In the baseline condition, we show results for the percentage of the population below the Estimated Average Requirement and above the Tolerable Upper Intake Level based on current intakes of cereal and the most recent version of the US Department of Agriculture’s National Nutrient Database.
† These are modelled changes to the fortification scheme of RTE cereals. In modelling these fortification levels, we assumed only a decrease in nutrients. That is, we did not model an increase in nutrients among RTE cereals fortifying below these levels the baseline levels.
‡ Pre-NLR RACC for RTE cereals are 30 g for medium-weight cereals and 55 g for heavy-weight cereals(24). The DV are reported in the units in which they appeared in the regulations. The DV for several nutrients (i.e. vitamin A, vitamin D, niacin, and folic acid) changed units under NLR regulation. The conversion to the previous DV unit is provided for clarity.
§ Post-NLR RACC for RTE cereals are 40 g for medium-weight cereals and 60 g for heavy-weight cereals(24). The DV are reported in the units in which they appeared in the regulations. The DV for several nutrients (i.e. vitamin A, vitamin D, niacin, and folic acid) changed units under NLR regulation. The conversion to the previous DV unit is provided for clarity.
|| RTE cereals that qualify for the Special Supplemental Nutrition Program for Women, Infants, and Children are fortified at higher Fe level; that is, 45 %DV(29).
¶ We assumed all folate in RTE cereal is the folic acid form when converting μg DFE to μg.
Baseline
For the baseline scenario we used the nutrient content of RTE cereal as reported in FNDDS 2013–2014. Table 1 reports the typical contemporary fortification practices representative of most of the current US RTE cereal marketplace; however, it should be noted that not all RTE cereals contain these levels of fortification.
Zero fortification
We assumed for the B-vitamins (thiamin, riboflavin, niacin, vitamin B6, folic acid, vitamin B12), vitamins A, D, and C, and Ca, Fe and Zn that the entire content of RTE cereal was from fortification and none was naturally occurring. Therefore, we assumed under this model that RTE cereal did not contribute to the daily intake of these nutrients.
Optimized fortification
A set of alternative %DV for RTE cereal was developed that considered several sources of information including: (i) current labelled %DV; (ii) NLR changes to the DV; (iii) recommendations within the Dietary Guidelines for Americans (e.g. nutrients of public health concern); and (iv) current nutrient intakes. In some cases, we tested the impact of several different fortified levels of nutrients before selecting the ‘optimized’ value (data not shown). We considered a fortification level for a nutrient ‘optimized’ if it decreased the percentage of the population above the UL or the percentage of the population below the EAR for under-consumed nutrients by a meaningful amount (i.e. 5 percentage points (pp)). Here we are showing one set of alternative fortification levels that represent the balance between decreasing the percentage of the population below the EAR and above the UL. Fortification levels of nutrients were adjusted according to the levels in Table 1: we lowered the %DV for B-vitamins, Fe and Zn and the %DV remained the same for vitamin A, vitamin C, vitamin D and Ca. We accounted for the changes in RACC and DV under NLR when calculating the amount per 100 g of RTE cereal. We only modelled a decrease in nutrient content per 100 g RTE cereal: for the RTE cereal FNDDS food codes that either contained no fortification or fortification levels lower than those in our optimized scenario, we did not increase the amount of nutrient. By only modelling a decrease in fortification, we estimated the impact of fortification changes among those RTE cereals that currently fortify at typical levels (Table 1) while excluding those cereals that either do not currently fortify (such as organic RTE cereals) or fortify at levels below most RTE cereals.
Statistical analysis
Statistical analyses were performed using the statistical software package SAS version 9.3 and procedures that account for the complex survey design and sampling weights necessary to make the NHANES data reflective of the US population. Before the diet can be characterized relative to DRI, usual or long-term estimates are needed that are adjusted for the known random measurement error in self-reported diet(Reference Beaton, Milner and Corey30–Reference Kipnis, Midthune and Freedman32). For this analysis, the National Cancer Institute method(Reference Dodd, Guenther and Freedman33,Reference Tooze, Midthune and Dodd34) was used to produce the mean and percentiles of usual nutrient intakes. Covariates in the National Cancer Institute usual intake models included whether the 24HR was collected on a weekday or weekend day and the interview method (in-person or telephone) of the 24HR.
Using usual intakes, we calculated the percentage of the population meeting or exceeding the DRI for twelve micronutrients. To calculate the percentage of the population meeting their nutrient requirements, we used the EAR, which is represents the median requirements of a nutrient and is used to estimate the needs of a group or population. The percentage of the population below the EAR was calculated for vitamin A, vitamin C, vitamin D, thiamin, riboflavin, niacin, vitamin B6, vitamin B12, folate, Ca and Zn using the cut-point method. Because the distribution of requirements is skewed for Fe, we used the probability method to determine the prevalence of the population below the EAR.
The percentage of the population above the UL was also determined for the nine of the twelve nutrients with an established UL: vitamin A, vitamin C, vitamin D, niacin, vitamin B6, folate, Ca, Fe and Zn. The UL for vitamin A was established only for the retinol form of the vitamin; for folate it was established only for folic acid; and for niacin, it was established only for niacin from fortified foods or supplements. Therefore, in calculating the percentage of the population above the UL for these nutrients, we used retinol for vitamin A and folic acid for folate. For niacin, we referred to the FNDDS 2013–2014 which categorizes each food code as being unfortified, fortified or containing fortified ingredients(25). For calculating the UL, we considered 0 % of the niacin from unfortified foods, 100 % of the niacin from fortified foods and 75 % of the niacin from foods containing fortified ingredients. We used 75 % of niacin for foods containing fortified ingredients as a conservative estimate of the amount of fortified niacin in these foods that would error on the side of overestimating the percentage of the population above the UL for niacin. We compared the baseline percentage below the EAR and baseline percentage above the UL for males v. females using an approximate χ 2 test. In cases with very low estimates and standard errors, normal approximations would not be appropriate and P values were not calculated(Reference Cox, Kotz and Johnson35). We considered a P value of <0·05 to be statistically significant.
Results
Fortification levels of ready-to-eat cereal under the three scenarios
Comparing the current with the optimized scenario, there were no changes in the %DV for vitamin A, vitamin C, vitamin D and Ca; however, due to NLR RACC and DV changes, the absolute amount of nutrient content within RTE cereal decreased for vitamin A (−55 %) and Ca (−2 %) and increased for vitamin C (+13 %) and vitamin D (+50 %). For thiamin, vitamin B6 and Zn, the %DV changed from 25 %DV at baseline to 20 %DV for the optimized scenario; however, when also considering the NLR changes, this represented about a 50 % decrease in the absolute amount of these nutrients. Fe had a 5-pp decrease in the %DV and this resulted in a 40 % decrease in the absolute amount of Fe. The largest absolute decreases were seen for vitamin B12, riboflavin, niacin and folic acid (−76 to −82 %) and this was largely attributed to the lower DV set forth under NLR (Table 1).
Prevalence and median amount of cereal consumption
Overall, 24·2 % of the US population aged ≥1 year consume RTE cereal on a given day. Toddlers are the age group with the highest prevalence of RTE cereal consumption (45·5 %) and consumption tends to decline with age: 39·9 % of children reported eating RTE cereal, while 27·3 % of adolescents and 20·3 % of adults did so. However, the median daily consumption of RTE cereal was highest in adults (45·9 g/d) and decreased across age groups, with toddlers having the smallest daily intake of RTE cereal (21·2 g/d; Table 2). Demographic characteristics of the study participants can be found in the online supplementary material, Supplemental Table S2.
Table 2 Prevalence and amount of ready-to-eat (RTE) cereal consumption among US toddlers, children, adolescents and adults*
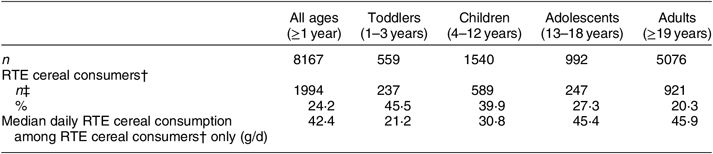
* Data are from the National Health and Nutrition Examination Survey (NHANES) 2013–2014, excluding pregnant and lactating women, using self-reported food intake from the first 24 h dietary recall.
† RTE cereal consumers were identified as those who reported consuming any quantity of RTE cereal in their first 24 h dietary recall in NHANES 2013–2014.
‡ Percentages were weighted using the appropriate weights set by NHANES to account for the sampling design, non-response and current demographics of the US population.
Percentage of the population below the Estimated Average Requirement under the three fortification scenarios
We noted a pattern of overall higher percentages of the total population below the EAR than seen among RTE cereal eaters only; however, given that RTE cereal consumers are also part of the entire population, no statistical comparisons were possible (nor was this an objective of the current analyses; Table 3). Similar to the entire US population, the percentage of RTE cereal eaters aged ≥1 year below the EAR was highest for vitamin D (82·5 %; Table 3). Over one-quarter of RTE cereal eaters aged ≥1 year were below the EAR for vitamin C (28·8 %) and Ca (26·9 %). The percentage of RTE cereal eaters aged ≥1 year consuming below the EAR of the other nutrients, including vitamin A, Zn, B-vitamins and Fe, ranged from 0 to 6 %.
Table 3 Percentage of the total population and of ready-to-eat (RTE) cereal eaters below the Estimated Average Requirement (EAR) for nutrients fortified in RTE cereal for the US population aged ≥1 year*
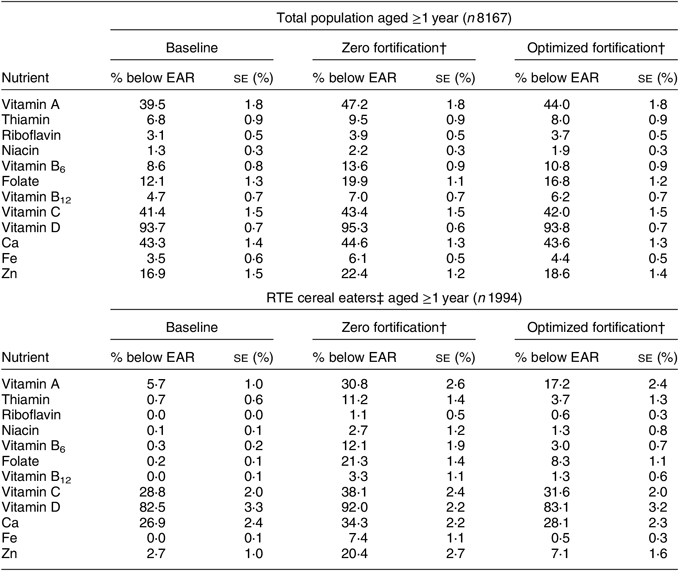
* Data are from the National Health and Nutrition Examination Survey (NHANES) 2013–2014, excluding pregnant and lactating women, using self-reported food intake from the first 24 h dietary recall. Data by age group (toddlers aged 1–3 years, children aged 4–12 years, adolescents aged 13–18 years and adults aged ≥19 years) are available in the online supplementary materials.
† For the zero-fortification scenario, we modelled removing all fortification of the nutrients listed in this table. In the optimized fortification scenario, we modelled fortification levels of 10 % of the Daily Value for vitamins A, C and D, riboflavin, niacin and Ca, and 20 % of the Daily Value for thiamin, vitamins B6 and B12, folic acid, Fe and Zn.
‡ RTE cereal consumers were identified as those who reported consuming any quantity of RTE cereal in their first 24 h dietary recall in NHANES 2013–2014.
When we modelled removing all fortification from RTE cereal, the percentage of RTE cereal eaters aged ≥1 year who were below the EAR for nutrients increased compared with the baseline scenario, ranging from an increase of 25·1 pp for vitamin A to 1·1 pp for riboflavin. Under the optimized fortification scenario, this increase in the percentage of RTE cereal consumers aged ≥1 year below the EAR from baseline was attenuated compared with the zero fortification model, ranging from an increase of 11·5 pp for vitamin A to 0·5 pp for Fe.
At baseline among RTE cereal consumers, the prevalence of intakes below the EAR differed across age groups and tended to be higher for adolescents and adults compared with toddlers and children for vitamin A, vitamin C, vitamin D and Ca (all P < 0·0001; Fig. 1 and online supplementary material, Supplemental Tables S3a and S3b). In the modelled scenarios we saw a similar pattern among all age groups: the percentage of RTE cereal eaters below the EAR was lowest at baseline and highest in the zero-fortification scenario (Fig. 1 and Supplemental Tables S3a and S3b).

Fig. 1 Percentage of US ready-to-eat (RTE) cereal eaters below the Estimated Average Requirement (EAR) for nutrients fortified in RTE cereal for under three scenarios: baseline (![]() ), zero fortification (
), zero fortification (![]() ) and optimized fortification (
) and optimized fortification (![]() ): (a) toddlers aged 1–3 years, n 237; (b) children aged 4–12 years, n 589; (c) adolescents aged 13–18 years, n 247; (d) adults aged ≥19 years, n 921. Data are from the National Health and Nutrition Examination Survey (NHANES) 2013–2014. The baseline scenario is the current nutrient intake; for the zero-fortification scenario, we modelled removing all fortification of the nutrients listed in this figure. In the optimized fortification scenario, we modelled fortification levels of 10 % of the Daily Value for vitamins A, C and D, riboflavin, niacin and Ca, and 20 % of the Daily Value for thiamin, vitamins B6 and B12, folic acid, iron and zinc. Values are percentages with their standard errors indicated by vertical bars
): (a) toddlers aged 1–3 years, n 237; (b) children aged 4–12 years, n 589; (c) adolescents aged 13–18 years, n 247; (d) adults aged ≥19 years, n 921. Data are from the National Health and Nutrition Examination Survey (NHANES) 2013–2014. The baseline scenario is the current nutrient intake; for the zero-fortification scenario, we modelled removing all fortification of the nutrients listed in this figure. In the optimized fortification scenario, we modelled fortification levels of 10 % of the Daily Value for vitamins A, C and D, riboflavin, niacin and Ca, and 20 % of the Daily Value for thiamin, vitamins B6 and B12, folic acid, iron and zinc. Values are percentages with their standard errors indicated by vertical bars
We did observe a differential pattern in vitamin D and Ca intakes below the EAR by sex. At baseline, a greater percentage of female RTE cereal eaters aged ≥1 year, compared with males, were consuming below the EAR for vitamin D (93·7 v. 71·0 %, P < 0·0001) and Ca (39·5 v. 16·3 %, P < 0·0001). Under the zero-fortification scenario, we saw a greater increase in the percentage of females (increase of 31·5 pp) not consuming adequate folate compared with males (increase of 24·1 pp). This increase was attenuated, although still present, in the optimized fortification scenario (increase compared with baseline of 13·7 pp for females and 9·2 pp for males). Similarly, removing fortification of all other nutrients appeared to have a greater impact on females compared with males. Again, this impact was attenuated in the optimized fortification scenario (online supplementary material, Supplemental Table S4).
When we examined the impact of the modelled fortification scenarios in the total population (including RTE cereal eaters and non-eaters) to estimate the overall population public health impact, we found a similar pattern of results to that observed among RTE cereal eaters only, although the magnitude of the impact of changing cereal fortification was attenuated since only the nutrient intakes of those consuming RTE cereal were considered (Table 3 and online supplementary material, Supplemental Tables S3a, S3b and S4).
Percentage of the population above the Upper Tolerable Intake Level under the three fortification scenarios
In both the entire US population and among RTE cereal eaters only, the percentage above the UL was highest at baseline for niacin (total population, 3·4 %; RTE cereal eaters, 15·9 %) followed by Zn (total population, 2·8 %; RTE cereal eaters, 9·1 %). For all other nutrients, the percentage above the UL at baseline was less than 1 % for the total US population; this was similar for RTE cereal eaters, except for retinol and folic acid where <5 % of RTE cereal eaters were above the UL. When we modelled removing all fortification from RTE cereal, the percentage of RTE cereal eaters aged ≥1 year who were above the UL decreased to <1 % for all nutrients except Zn (2·5 % above the UL); and in the optimized scenario this decreased to <1·1 % for all nutrients, again except for Zn (5·1 % above the UL). Similar patterns were seen for the entire population (Table 4).
Table 4 Percentage of the total population and of ready-to-eat (RTE) cereal eaters above the Tolerable Upper Intake Level (UL) for nutrients fortified in RTE cereal for the US population aged ≥1 year*
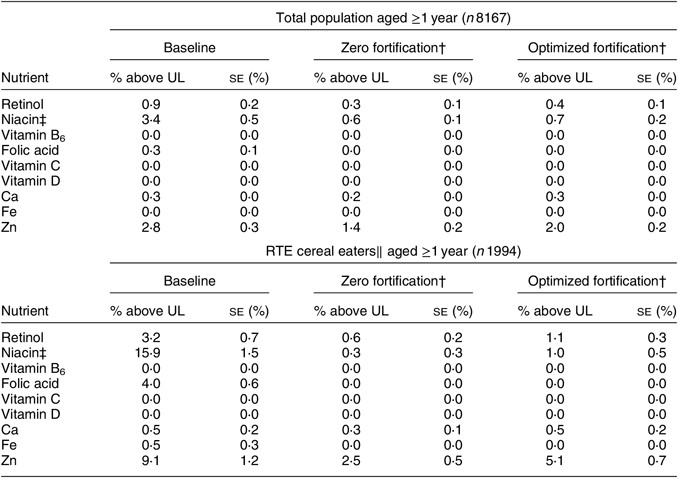
* Data are from the National Health and Nutrition Examination Survey (NHANES) 2013–2014, excluding pregnant and lactating women, using self-reported food intake from the first 24 h dietary recall. Data by age group (toddlers aged 1–3 years, children aged 4–12 years, adolescents aged 13–18 years and adults aged ≥19 years) are available in the online supplementary material.
† For the zero-fortification scenario, we modelled removing all fortification of the nutrients listed in this table. In the optimized fortification scenario, we modelled fortification levels of 10 % of the Daily Value for vitamins A, C and D, riboflavin, niacin and Ca, and 20 % of the Daily Value for thiamin, vitamins B6 and B12, folic acid, Fe and Zn.
‡ The UL for niacin is based on fortified or supplemental niacin only. Therefore, we identified fortified foods using the US Department of Agriculture’s Food and Nutrient Database for Dietary Studies 2013–2014 and considered 100 % of the niacin content of the foods from fortification for fortified foods, 0 % of the niacin content of the foods from fortification for unfortified foods and 75 % of the niacin content of the foods from fortification for partially fortified foods in calculating the percentage above the UL.
‖ RTE cereal consumers were identified as those who reported consuming any quantity of RTE cereal in their first 24 h dietary recall in NHANES 2013–2014.
Across age groups, 0 % of RTE cereal eaters were above the UL for vitamin C, vitamin D and vitamin B6 at baseline. Less than 1 % of adults were above the UL for Ca and Fe, and for all other age groups this was 0 %. Toddlers and children appeared to have a higher percentage above the UL for retinol, niacin, folic acid and Zn compared with adolescents and adults, although statistical comparisons were not possible for many nutrients due to very low estimates (Fig. 2 and online supplementary material, Supplemental Tables S5a and S5b). The percentage above the UL decreased in all age groups in the zero fortification and optimized fortification scenarios compared with baseline for retinol, niacin, folic acid and Zn, sometimes dramatically among RTE cereal eaters; for example, among toddlers, the percentage above the UL for niacin decreased from 63·8 % at baseline to 10·1 % in the optimized fortification scenario. Likewise, the percentage of adolescents above the UL for folic acid decreased from 28·9 % at baseline to 0·4 % in the optimized fortification scenario (Fig. 2 and Supplemental Tables S5a and S5b).
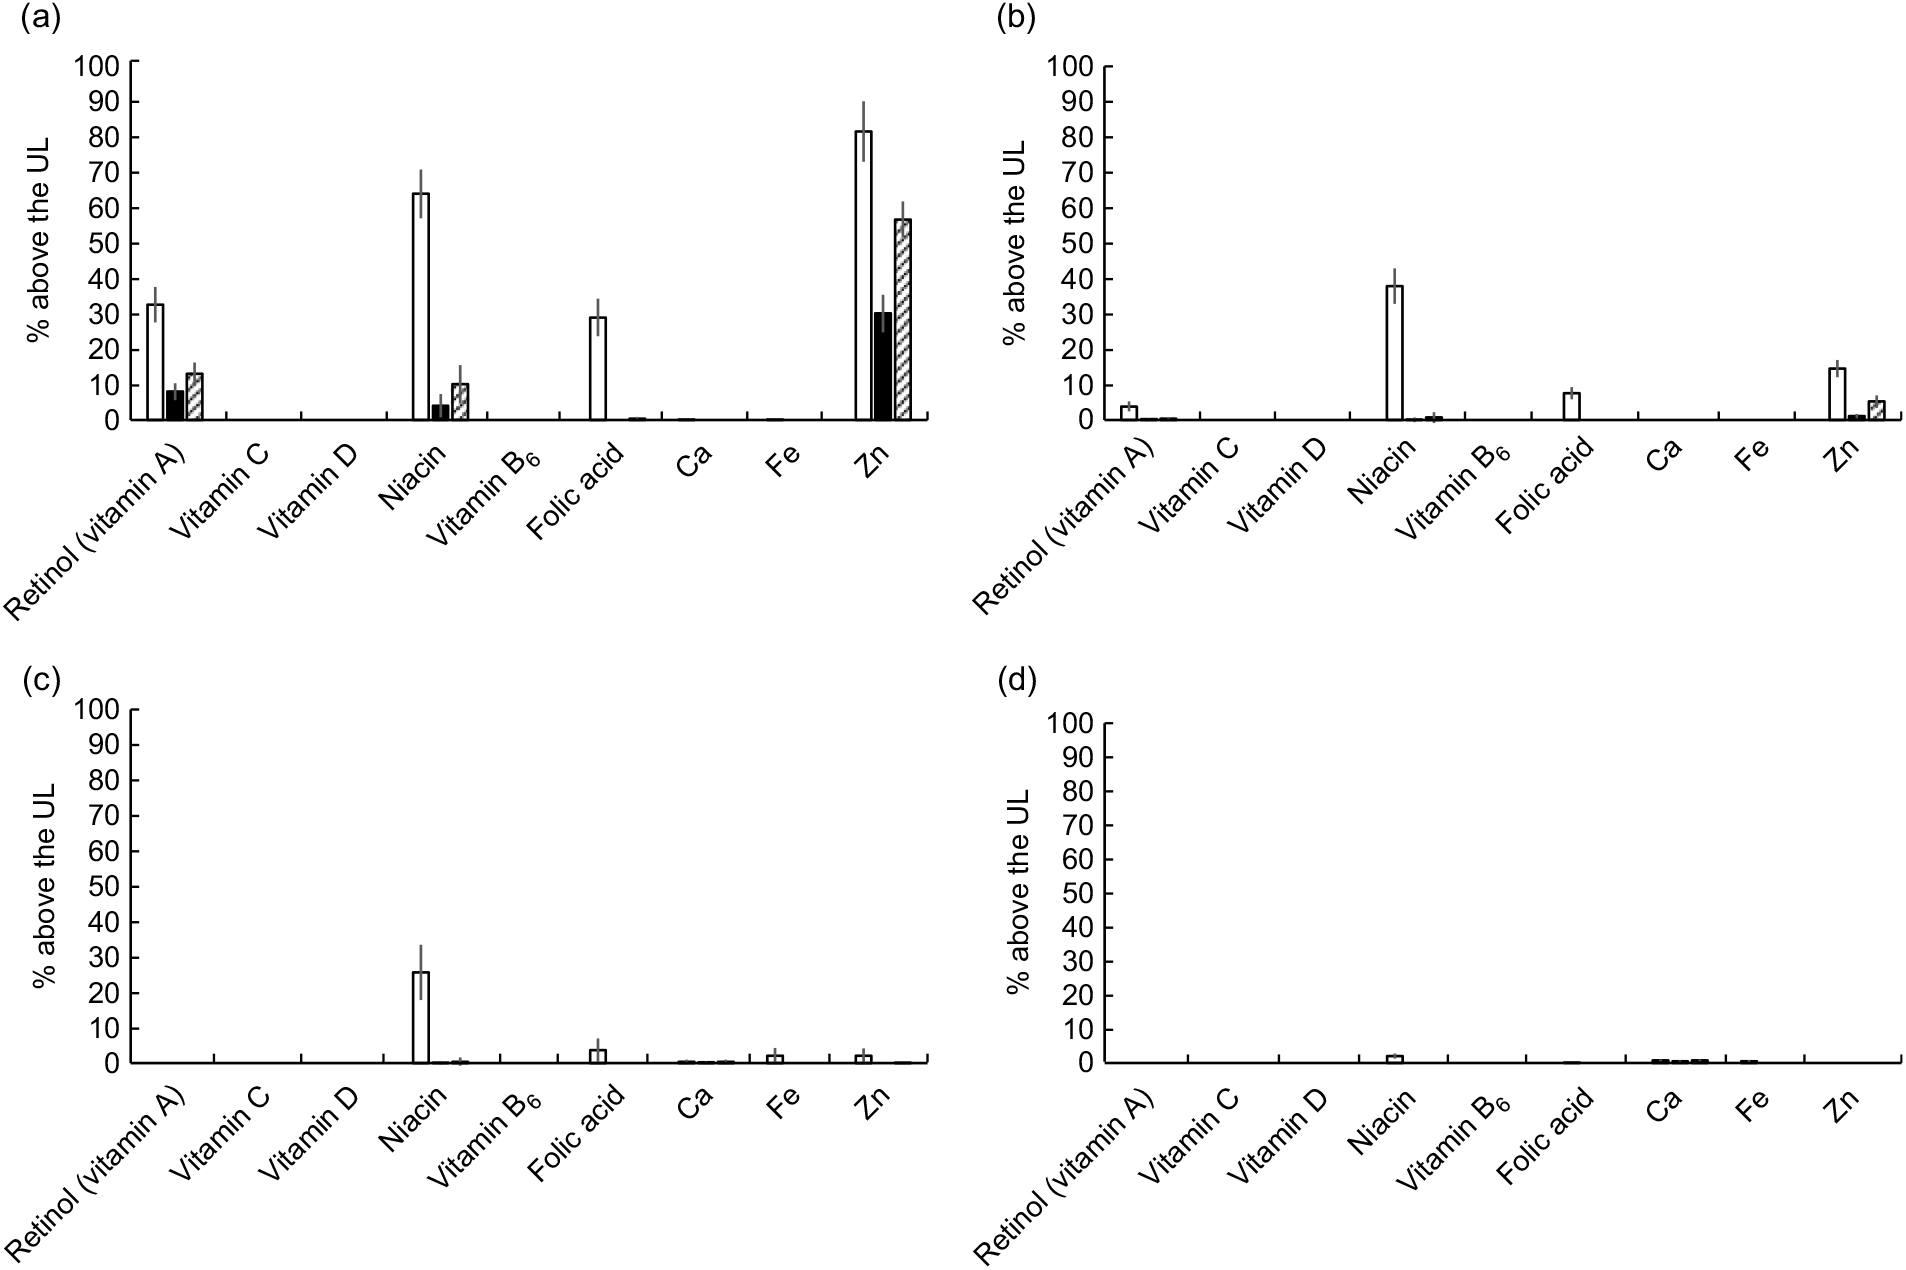
Fig. 2 Percentage of US ready-to-eat (RTE) cereal eaters above the Tolerable Upper Intake Level (UL) for nutrients fortified in RTE cereal under three scenarios: baseline (![]() ), zero fortification (
), zero fortification (![]() ) and optimized fortification (
) and optimized fortification (![]() ): (a) toddlers aged 1–3 years, n 237; (b) children aged 4–12 years, n 589; (c) adolescents aged 13–18 years, n 247; (d) adults aged ≥19 years, n 921. Data are from the National Health and Nutrition Examination Survey (NHANES) 2013–2014. The baseline scenario is the current nutrient intake; for the zero-fortification scenario, we modelled removing all fortification of the nutrients listed in this figure. In the optimized fortification scenario, we modelled fortification levels of 10 % of the Daily Value for vitamins A, C and D, riboflavin, niacin and calcium, and 20 % of the Daily Value for thiamin, vitamins B6 and B12, folic acid, iron and zinc. Values are percentages with their standard errors indicated by vertical bars
): (a) toddlers aged 1–3 years, n 237; (b) children aged 4–12 years, n 589; (c) adolescents aged 13–18 years, n 247; (d) adults aged ≥19 years, n 921. Data are from the National Health and Nutrition Examination Survey (NHANES) 2013–2014. The baseline scenario is the current nutrient intake; for the zero-fortification scenario, we modelled removing all fortification of the nutrients listed in this figure. In the optimized fortification scenario, we modelled fortification levels of 10 % of the Daily Value for vitamins A, C and D, riboflavin, niacin and calcium, and 20 % of the Daily Value for thiamin, vitamins B6 and B12, folic acid, iron and zinc. Values are percentages with their standard errors indicated by vertical bars
We found that men who consumed RTE cereal had a higher percentage above the UL for Ca (women, 0·1 %; men, 0·9 %; P = 0·01) and niacin (women, 10·9 %; men, 22·4 %; P = 0·02) compared with women. Decreases in the percentage above the UL in the zero fortification and optimized fortification scenarios for RTE cereal eaters appeared similar for both women and men except for niacin, with males potentially having a greater decrease from baseline to the optimized scenario than women (men, −20·9 pp; women, −10·3 pp; online supplementary material, Supplemental Table S6).
Discussion
‘Fortification’ is an umbrella term used to describe both mandatory enrichment and voluntary addition of nutrients to foods. ‘Enrichment’ is the addition of nutrients either to replace nutrients lost in processing (e.g. thiamin, riboflavin, niacin and Fe added to grains) or for a demonstrated public health need(Reference Dwyer, Wiemer and Dary36). Despite the role of discretionary fortification (also referred to as ‘voluntary fortification’) to reduce the risk of nutrient inadequacy for the total population and across different race/ethnic groups and socio-economic status(Reference Fulgoni, Keast and Bailey3,Reference Malek, Newman and Hunt37) , some critics have argued that voluntary fortification practices have the potential to unduly expose the public to higher than recommended levels of nutrients(Reference Sacco, Dodd and Kirkpatrick38–Reference Sacco and Tarasuk40), especially when taken within the context of high supplement use(Reference Bailey, Fulgoni and Keast16,Reference Bailey41–Reference Bailey, Fulgoni and Keast43) .
Thus, policy makers and food manufacturers have weighed the benefits of preventing nutrient inadequacies with the risk of intakes above the UL(Reference Bruins, Mugambi and Verkaik-Kloosterman44). Indeed, in the current American dietary landscape frank micronutrient deficiencies are rare, but many nutrients of concern and ‘shortfall’ nutrients have been identified in the American diet(6). Thus, encouraging more nutrient-balanced eating patterns should be a public health and food industry priority. This concept is closely aligned with the FDA fortification policy that outlines the major tenants that should guide fortification practices. First, contemporary intakes should be demonstrated to be below desirable levels. Second, enough people in the population should consume the food or beverage selected for fortification. Finally, the amount of a nutrient added to foods should provide reasonable assurance against excessive or toxic intakes(45).
RTE cereal is a good candidate for voluntary fortification because of its foundational place at the centre of the breakfast meal, its ability to provide fibre and whole grains, its affordability, its popularity and its well-established associations with healthier overall diets(Reference Priebe and McMonagle10). While some RTE cereals are pre-sweetened, observational data have shown positive associations between RTE cereal and diet quality and inverse associations with chronic disease outcomes(Reference Xu, Huang and Lee46). Therefore, fortification of RTE cereal should be encouraged and the fortification profile of RTE cereal should be based on current nutrition science, current patterns of food intake, consumer preference and government policy.
RTE cereal fortification requires particular consideration because it is consumed by a wide range of age groups from young children to older adults and contributes differently to overall nutrient intakes in these groups. From our results in the NHANES data, among toddlers and children, RTE cereal is consumed by a larger proportion of the population (40 and 46 % on a given day, respectively) but at a lower total amount (21 and 31 g/d, respectively) than by adolescents and adults, where less of the population consumes RTE cereal (20 and 27 % on a given day, respectively) but in higher quantities (~45 g/d). Below we describe how the optimization scenario presented within the present study impacted the micronutrient status for the overall population and within these specific age groups.
Vitamin D and Ca are nutrients of public health concern among all age groups in the USA and vitamin C is an under-consumed nutrient(6,Reference Bailey, Dodd and Goldman47) . The DV for all three of these nutrients increased under NLR: for vitamin D from 10 to 20 μg (400 to 800 IU); for Ca from 1000 to 1300 mg; and for vitamin C from 60 to 90 mg. RTE cereal is the third highest dietary contributor to vitamin D intake in children and adolescents, contributing 8–10 % of daily vitamin D intake(Reference Berner, Keast and Bailey4), and among older adults, contributing 7 %(Reference Papanikolaou and Fulgoni48). There are very few food sources of vitamin D and the 2015–2020 Dietary Guidelines for Americans recommends consuming foods fortified with vitamin D, including RTE cereal, as a strategy to achieve higher levels of vitamin D intake. Thus, it is important that RTE cereal continues to be an important source of these nutrients. In our optimized scenario, the %DV remained the same for vitamin D, Ca and vitamin C, although the amount per 100 g did change due to the changing DV and RACC: the amount of vitamin D and vitamin C increased by 50 and 13 %, respectively, and the amount of Ca in RTE cereal remained similar (decreased by 2 % compared with the baseline amount). Indeed, under the optimized scenario, no changes in the prevalence of intakes below the EAR were observed for toddlers, and a slight (1–2 pp) increase for both Ca and vitamin D among child, adolescent and adult RTE cereal consumers. However, it is important to note that a large percentage of the population is still under-consuming these nutrients although RTE cereal consumers are more likely to consume adequate levels(Reference Fulgoni and Buckley8).
Fe is considered a shortfall nutrient among adolescent girls and women(6). Fe was also identified as a priority nutrient in the 2017 Food and Nutrition Board report for the diets of infants and children participating in the Special Supplemental Nutrition Program for Women, Infants, and Children (WIC). WIC provides supplemental foods, including RTE cereal, to low-income pregnant, breast-feeding and postpartum women and to infants and children up to 5 years of age who are found to be at nutritional risk(29). Because RTE cereal is the primary source of added Fe in the diets of US children(Reference Berner, Keast and Bailey4), the optimized scenario sought to determine the amount of Fe that continued to help children and women meet needs, without potential excess in some other population groups, such as adult men.
Despite modelling a change in Fe content for the entire category of RTE cereal, it is important to consider that certain RTE cereals provide a higher amount of Fe (28 mg/100 g RTE cereal v. 9 mg/100 g RTE cereal in the optimized scenario) and these amounts are unlikely to change in a ‘real-world’ setting due to WIC programme specifications. Fe intake of WIC participants is higher and the percentage below the EAR is lower compared with income-eligible and income-ineligible non-participants, suggesting the important impact and reach of Fe-fortified cereals among infants and young toddlers (6–24 months)(Reference Jun, Catellier and Eldridge18).
The optimized scenario represents a proposed reduction in Fe of 40 % in RTE cereal. When we modelled removing Fe fortification from RTE cereal, the percentage below the EAR increased from 3·5 % at baseline for the total population aged ≥1 year to 6·1 %. Among RTE cereal eaters, this increase was from 0 % below the EAR to 7·4 %. The optimized scenario attenuated this increase in percentage below the EAR for Fe to 4·4 % for the total population and 0·5 % for RTE cereal eaters. Our scenarios did not include the use of supplemental Fe, which increases the likelihood of intakes above the UL for Fe, especially in children(Reference Bailey, Fulgoni and Keast16). Therefore, the optimized scenario represents a conservative approach to fortification that limits the impact on the percentage of the population below the EAR.
Previous reports have identified intakes above the UL for vitamin A, niacin, folic acid and Zn as potentially of concern, especially in some US age and sex groups(Reference Bailey, Fulgoni and Keast16,Reference Bailey, Catellier and Jun17,Reference Bailey, Fulgoni and Keast42,Reference Bailey, Fulgoni and Keast43,Reference Bailey, Dodd and Gahche49,Reference Bailey, McDowell and Dodd50) . Because RTE cereal is a key contributor of all four of these nutrients in children, the optimized scenario sought to balance adequate intakes among all age groups while lowering the percentage of the population above the UL.
Retinol is the form of preformed vitamin A that the UL is based upon. RTE cereal fortification provides approximately 35 and 17 % of vitamin A to the diets of child (2–18 years) and adult (≥19 years) consumers, respectively(Reference Fulgoni and Buckley8). While few adults exceed the UL for vitamin A from foods alone(Reference Bailey, Fulgoni and Keast42,Reference Blumberg, Balz and Fulgoni51) , many young children do (19 % of all toddlers in the current study), which could be more of a concern among supplement users. Other sources of preformed vitamin A include liver, fish oils, dairy products and eggs. While the %DV for vitamin A remained the same in the optimized scenario as at baseline, a 55 % decrease in the vitamin A content of RTE cereal would occur due to the changing DV and RTE cereal RACC. This decrease in vitamin A content translated to a 60 % reduction in the prevalence of RTE cereal consumers exceeding the UL among toddlers in the optimized scenario compared with baseline (33 % baseline to 13 % in optimized). However, at the same time, we found that there was a large percentage of the total population below the EAR for vitamin A particularly among adolescents and adults (10 % for children and approximately 48 % for adolescents and adults). Our optimized scenario minimized the increase in the percentage below the EAR when compared with complete removal of vitamin A fortification, highlighting the importance of retaining vitamin A fortification in RTE cereal.
Niacin content in RTE cereal was decreased by 76 % from baseline to the optimal fortification level due to a combination of reducing the %DV, a decrease in the DV and an increase in the RACC of RTE cereal. Typical American diets, with or without fortified foods, tend to provide niacin at levels congruent with the DRI(Reference Fulgoni, Keast and Bailey3) since niacin is present in a wide variety of foods including beef, poultry and fish. While the primary safety concern of high doses of niacin is flushing, which is largely benign, it is still relevant to consider lowering the niacin content given that 16 % of the US population consuming RTE cereal is achieving intakes above the UL. The large reduction of niacin per 100 g of RTE cereal slightly shifted the percentage below the EAR at the population level (~0·5 pp) and among RTE cereal consumers (~1 pp), but the reduction in intakes above the UL was more substantial, particularly among RTE cereal eaters (i.e. from 16 % above UL at baseline to 1 % in the optimized scenario).
Folic acid is the synthetic form of the vitamin folate that is used in fortification and dietary supplements and is the only form of folate that is considered for the UL. The role of folic acid has been established for the prevention of neural tube defects and fortification programmes are mandated in over seventy countries worldwide(Reference Bailey, Stover and McNulty52). Fortification programmes have increased dietary intakes of folic acid(Reference Dietrich, Brown and Block53) and blood folate concentrations in the USA(Reference Pfeiffer, Johnson and Jain54) and reduced the incidence of neural tube birth defects dramatically. We noted only a very small percentage of the total population aged ≥1 year above the UL for folic acid (0·3 %); even among RTE cereal eaters, only 4 % of the population ≥1 year of age was above the UL although toddlers (28·9 % above the UL) and children (7·6 % above the UL) who eat RTE cereal were more likely to exceed the UL. The optimized framework delineated in this project, which modelled an 82 % decrease in folate/folic acid in RTE cereal from baseline, represents a balance between reducing the percentage of the population exceeding the UL (particularly for toddlers) while minimizing the impact on the percentage of the population below the EAR. For example, there was still a substantial percentage of the population, particularly for adolescents (30 %) and adult (20 %) women in the total population, who were below the EAR. The optimized scenario reduces the percentage above the UL for toddlers who eat RTE cereal (to <1 % above the UL) while minimizing the impact on the total population of adolescent and adult women below the EAR.
We found that very few adolescents and no adults exceeded the UL for Zn from food, although the percentage of toddlers (60 %) and children (4 %) was higher. However, the percentage below the EAR for Zn was notable in the total population for adolescents (26 %) and adults (19 %). In the optimized scenario, a 56 % decrease in the amount of Zn added to RTE cereal was proposed, substantially lowering the prevalence of intakes above the UL for toddlers (to 45 %) and children (to 1·4 %) with minimal changes in intakes below the EAR. Among RTE cereal eaters specifically, high Zn intake remained a concern for toddlers (57 % above the UL); however, it should be pointed out that when we modelled removing all fortification of RTE cereal, 30 % of toddlers who eat RTE cereal would have intakes above the UL. Without Zn fortification some 36 % of adolescents and 25 % of adults who eat RTE cereal would not meet the EAR, thus it is important to maintain fortification of Zn in RTE cereal. Other food sources of Zn include meat and poultry.
In addition to folic acid and niacin, the remaining B-vitamin contents (i.e. thiamin, riboflavin, B6 and B12) of RTE cereal were also reduced in the optimized scenario; this is salient as RTE cereal is the primary contributor to added amounts of these nutrients in the diets of children and adolescents(Reference Berner, Keast and Bailey4). Other sources include meat, poultry and fish (thiamin, riboflavin, vitamin B6, vitamin B12), enriched grains (thiamin, riboflavin), potatoes (vitamin B6) and dairy products (riboflavin and vitamin B12). No toddlers or children, and a small fraction of adults, who consume RTE cereal had intakes for these nutrients in the baseline scenario below the EAR, and only a small proportion (2–5 %) of adolescents and adults had intakes below the EAR with the optimized scenario. Thiamin, riboflavin, and vitamin B12 do not have UL established and the percentage above the UL for vitamin B6 was 0 % for all age groups.
The majority of the available DRI were set between 1997 and 2005, while Ca and vitamin D were updated in 2011(28). The UL for children have been criticized as having been established with too few available data and are considered to be too low for many nutrients(Reference Zlotkin55). Indeed, for Zn, approximately 40 % of US infants and children exceed the UL from diet alone. While total vitamin A intakes exceeded the UL in a large proportion of infants and toddlers, it should also be noted that substantial numbers exceeded the UL for vitamin A from foods alone. Thus, the UL for vitamin A and Zn should be considered for re-evaluation, since so many children exceed them and there is little evidence of clinically significant health consequences. Across all ages, the UL for niacin has similarly been called into question(Reference Minto, Vecchio and Lamprecht56). The range of intakes between the EAR and the UL is much narrower in children than in adults, making it challenging to achieve adequate intakes in the population without exceeding the UL. Furthermore, many of the DRI values in children were extrapolated from studies and data in adults. While the current DRI guidelines represent the best-known data on this subject and therefore are the best information we have for setting public health policies related to nutrient intakes in these age groups, evaluation of the appropriateness of these cut-offs should be pursued in future research. Ongoing efforts to improve the DRI process with a focus on disease prevention are currently being explored(Reference Yetley, MacFarlane and Greene-Finestone57).
A number of strengths and limitations exist within the current analysis. First, we propose a proactive scientific approach to fortification to ensure public health adequacy balanced with potential concerns of intakes above the UL. The use of nationally representative survey data permits estimates of changes in fortification practices that are national in scope and we estimated usual or habitual dietary intakes of Americans to reduce within-person variation in nutrient intakes. Nevertheless, self-reported dietary data are known to contain systematic bias including energy under-reporting(Reference Subar, Freedman and Tooze58,Reference Subar, Kipnis and Troiano59) and our models assume that reported consumption of RTE cereal is unbiased, which may result in classification bias. The optimized scenario jointly modelled the upcoming changes to the serving sizes (i.e. the RACC) and the DV under NLR, representing the most ‘real life’ and informed scenario possible in interpreting our findings(Reference Murphy, Spungen and Barraj60). However, the proposed framework for optimizing RTE cereals made some assumptions that should be considered in interpreting these data. First, the model assumes all RTE cereals would be changed to match the proposed scenario, which is speculative but also reasonable to assume. None of models represent intakes of nutrients from dietary supplements purposefully to understand the unique contribution of RTE cereal, but in doing so overestimates the population proportion for intakes below the EAR and underestimates the proportion with intakes above the UL(Reference Bailey, Fulgoni and Keast16,Reference Bailey, Fulgoni and Keast42,Reference Bailey, Fulgoni and Keast43) for those who use nutrient-containing dietary supplements(Reference Bailey, Fulgoni and Keast16,Reference Bailey, Fulgoni and Keast42) . Because the models only influence RTE consumers, we present results both for RTE cereal eaters only and for the total population, the results of which would represent the overall public health impact of changing RTE cereal fortification and considers the prevalence of RTE cereal consumption.
In summary, the present work represents an attempt to optimize the amounts of vitamins and minerals that are provided in RTE cereal given the important role that RTE cereal plays helping Americans meet their dietary needs, either directly or through its frequent consumption with milk. The most notable feature of the optimized scenario presented is balancing the decrease in the amounts of those nutrients that may contribute to intakes above the UL in some population subgroups, such as toddlers, while continuing to provide key under-consumed nutrients to the general population, of which RTE cereal is an important contributor. Moving forward, we hope that this framework may inform decisions about fortification practices in this and across other food categories, to ensure that food manufacturers are providing products that meet the contemporary needs of various population subgroups and are using an evidence-based approach to informing fortification practices(Reference Dwyer, Wiemer and Dary36,Reference Dwyer, Woteki and Bailey61) .
Acknowledgements
Acknowledgements: The authors would like to acknowledge the contribution of Nort Holschuh, employee of General Mills, Inc., for providing statistical expertise. Financial support: Funding of this project was provided by the Bell Institute of Health and Nutrition, General Mills, Inc. J.D.S. and N.J. are employed by General Mills, Inc. and they contributed to the study design, the analysis of the data, the interpretation of findings and the preparation of the manuscript. Conflict of interest: J.D.S. and N.J. are employees of General Mills, Inc. R.L.B. is a scientific consultant to the Bell Institute of Health and Nutrition. Authorship: J.D.S. contributed to the study design and statistical analysis plan, carried out the study, guided the data analyses and contributed to the writing of the manuscript. N.J. conducted the statistical analysis and contributed to the writing of the manuscript. R.L.B. provided expertise and guidance on the study design and statistical analysis plan and wrote the manuscript. Ethics of human subject participation: The NHANES survey protocol and procedures are approved by the US Centers for Disease Control and Prevention’s National Center for Health Statistics. This paper is a secondary data analysis of NHANES and no personally identifiable information about individuals was available to the researchers.
Supplementary material
To view supplementary material for this article, please visit https://doi.org/10.1017/S1368980019003690


