


Implications
Development of scientifically robust and easy-to-measure metrics for agricultural sustainability will assist agricultural producers around the world by providing them with a practical means to manage soils, water, pasture and livestock in an economically and environmentally sustainable manner. Within the context of pasture-based ruminant production systems, this paper discusses a novel approach to select the most informative metrics compiled from primary data collected on intensively instrumented farm platforms.
Introduction
Global agriculture is at a critical juncture where competing requirements for maximal production and minimal pollution impose various patterns of economic-environmental trade-offs. Livestock production is central to this debate (Eshel et al., Reference Eshel, Shepon, Makov and Milo2014), as it is estimated to generate 7.1 Gt CO2-e of greenhouse gases (GHGs) each year, or 14.5% of human-induced GHG emissions across the world (Gerber et al., Reference Gerber, Steinfeld, Henderson, Mottet, Opio, Dijkman, Falcucci and Tempio2013). The sector occupies ~30% of the Earth’s surface, of which one-fifth is subject to land degradation due to inappropriate management and overproduction (Steinfeld et al., Reference Steinfeld, Gerber, Wassenaar, Castel, Rosales and de Haan2006). Livestock, and in particular grazing cattle, have also been associated with diminished water quality (Agouridis et al., Reference Agouridis, Workman, Warner and Jennings2005); in Europe, for example, 23% to 47% of the nitrogen river load and 17% to 26% of the phosphorus river load are attributable to farm animals (Leip et al., Reference Leip, Billen, Garnier, Grizzetti, Lassaletta, Reis, Simpson, Sutton, de Vries, Weiss and Westhoek2015). These statistics, together with the notion that cereals and pulses currently being fed to livestock could potentially be consumed by humans to alleviate hunger, have frequently led to a criticism that livestock farming is an unethical industry (Lymbery, Reference Lymbery2014) that should be subject to production tax (Springmann et al., Reference Springmann, Mason-D’Croz, Robinson, Wiebe, Godfray, Rayner and Scarborough2017).
Livestock, on the other hand, may also be able to make important contributions to global food security. In particular, ruminants can utilise land unsuitable for arable crop production and convert fibre and low-quality nitrogen sources to nutritionally valuable protein for human consumption (Wilkinson, Reference Wilkinson2011; Wilkinson and Lee, Reference Wilkinson and Lee2017). These forms of protein are generally of higher quality in terms of both composition (amino acid profile) and bioavailability than those originating from plants, and also are directly associated with vital micronutrients (e.g. iron, zinc, iodine, selenium and Vitamin B12), providing a case for the role of animal products as part of a balanced diet (Smil, Reference Smil2013). When appropriately managed, grazing animals have also been shown to be net providers of a range of ecosystem services and, depending on the natural conditions, capable of not only maintaining but also regenerating soil fertility by facilitating nutrient cycling (Broom et al., Reference Broom, Galindo and Murgueitio2013). Given these conflicting views, there is a clear and urgent need to evaluate the pros and cons of different livestock production systems and appropriately define their role in society (Eisler et al., Reference Eisler, Lee, Tarlton, Martin, Beddington, Dungait, Greathead, Liu, Mathew, Miller, Misselbrook, Murray, Vinod, Van Saun and Winter2014).
A holistic evaluation of livestock production systems, however, is a challenging exercise. Agricultural activities undertaken by humans interfere with the already complex physical, chemical and biological interactions between crops, pastures, animals and the intrinsic environment (soil, water and atmosphere), yet neither can these interactions be completely observed nor can their consequences on the long-term productivity be accurately foreseen. Thus, to form a robust evidence base for policymaking and at the same time support producers’ decision-making, society needs quantified measures of sustainability that are solely composed of parameters that are observable presently and cost-effectively. As the United Nations’ Sustainable Development Solutions Network (UN-SDSN) states, ‘without clear metrics and a well-designed research and institutional approach to make the metrics operational, reaching the targets for sustainable development will remain an amorphous goal’ (Dobermann and Nelson, Reference Dobermann and Nelson2013: 46).
Traditionally, these so-called agricultural sustainability metrics (Smith et al., Reference Smith, Snapp, Chikowo, Thorne, Bekunda and Glover2017) have been discussed under the concept of economic-environmental trade-offs (Antle et al., Reference Antle, Stoorvogel and Valdivia2014; Klapwijk et al., Reference Klapwijk, van Wijk, Rosenstock, van Asten, Thornton and Giller2014). Field-scale randomised controlled trials around the world provide ample evidence that the sole pursuit of higher-volume production per a given land area is accompanied by disproportionally negative environmental consequences (Tscharntke et al., Reference Tscharntke, Clough, Wanger, Jackson, Motzke, Perfecto, Vandermeer and Whitbread2012). As an archetypal example, a study by Zhang et al. (Reference Zhang, Huang, Badgery, Kemp, Chen, Wang and Liu2015) demonstrated that even moderately high stocking densities, commonplace in grasslands across many parts of the world, can lead to a gradual reduction in pasture production capacity, loss of desirable species in pasture compositions and, ultimately, suboptimal animal liveweight growth accompanied by large negative externalities.
At the same time, recent research carried out using commercial data indicates that these trade-offs are not nearly as clear-cut in the real world as these trials would suggest (McAuliffe et al., Reference McAuliffe, Takahashi, Mogensen, Hermansen, Sage, Chapman and Lee2017). Distribution of environmental performances across farming operations demonstrates a level of variability far beyond what can be explained by the geographical and biophysical conditions they operate in and, crucially, these performances are often positively and strongly correlated with their economic profitability (Jones et al, Reference Jones, Jones and Cross2014; Ryan, et al., Reference Ryan, Hennessy, Buckley, Dillon, Donnellan, Hanrahan and Moran2016). While reasons behind the discrepancy between findings from field-scale and farm-scale research have not been completely elucidated in the literature, it is likely caused, at least partially, by a significantly more stringent set of practical constraints imposed by the commercial environment. For example, animals used for field-scale trials can be transferred to holding areas set outside the system boundary before and after each season. Feed given to these animals while being housed can simply be purchased, or grown elsewhere, without needing to balance the land requirements between grazing and crop/forage production. In other words, the simple and flexible nature of ‘farm management’ conducted for field-scale trials makes it comparatively easier to achieve a high level of resource allocation efficiency, under which it is theoretically more likely that trade-offs are observed (Farrell, Reference Farrell1957). Agricultural sustainability metrics, therefore, must be developed and defined for the whole-farm level, at the scale that reflects the unit of decision-making by commercial producers (McGonigle et al., Reference McGonigle, Burke, Collins, Gartner, Haft, Harris, Haygarth, Hedges, Hiscock and Lovett2014); nevertheless, previous efforts to apply the concept of sustainability metrics to commercial farms have largely been unsuccessful, due to, amongst other reasons, the scepticism amongst producers about the relevance of such metrics to sustainability of their own enterprises (de Olde et al., Reference Daley, Abbott, Doyle, Nader and Larson2016).
The objective of the present paper is to introduce a novel approach employed by the North Wyke Farm Platform (NWFP: Orr et al., Reference Orr, Murray, Eyles, Blackwell, Cardenas, Collins, Dungait, Goulding, Griffith, Gurr, Harris, Hawkins, Misselbrook, Rawlings, Shepherd, Sint, Takahashi, Tozer, Whitmore, Wu and Lee2016), an intensively instrumented farm-scale research facility located in Devon, United Kingdom, to carry out comprehensive assessments of economic-environmental trade-offs inherent within pasture-based cattle and sheep production systems. Based on high-resolution primary data collected across three replicate farms on site, relationships between economic, environmental and ecological performance indicators acquired on-farm as well as the value of the final product to human nutrition are explored through a data-mining exercise. We contend that a combination of farming system-scale trials and state-of-the-art environmental instrumentation provides an ideal setting for enrolling scientifically sound, biologically informative and socially relevant metrics, through which agricultural producers could obtain guidance to manage soils, water, pasture and livestock in an economically and environmentally sustainable manner.
Material and methods
Study site
The NWFP (50°46'10"N, 3°54'05"W) was established in 2010 as a UK national capability for research, training and knowledge exchange in agri-environmental sciences. Adopting pasture-based beef and lamb production systems commonly observed in lowland temperate grasslands, the entire platform comprises three hydrologically independent small-scale farms locally known as ‘farmlets’. Each farmlet (identified as ‘green’, ‘blue’ and ‘red’) has ~22 ha of grassland divided into five subcatchments and, together with its own infrastructure consisting of a silage clamp, a manure midden and a housing facility for cattle, and is managed separately as a virtual commercial entity. The five subcatchments are themselves also hydrologically isolated and, together with the entire runoff water leaving them channelled through a network of French drains to instrumented flumes that became operational in October 2012. Each subcatchment consists of either one, two or three fields for grazing and silage cut (Figure 1).
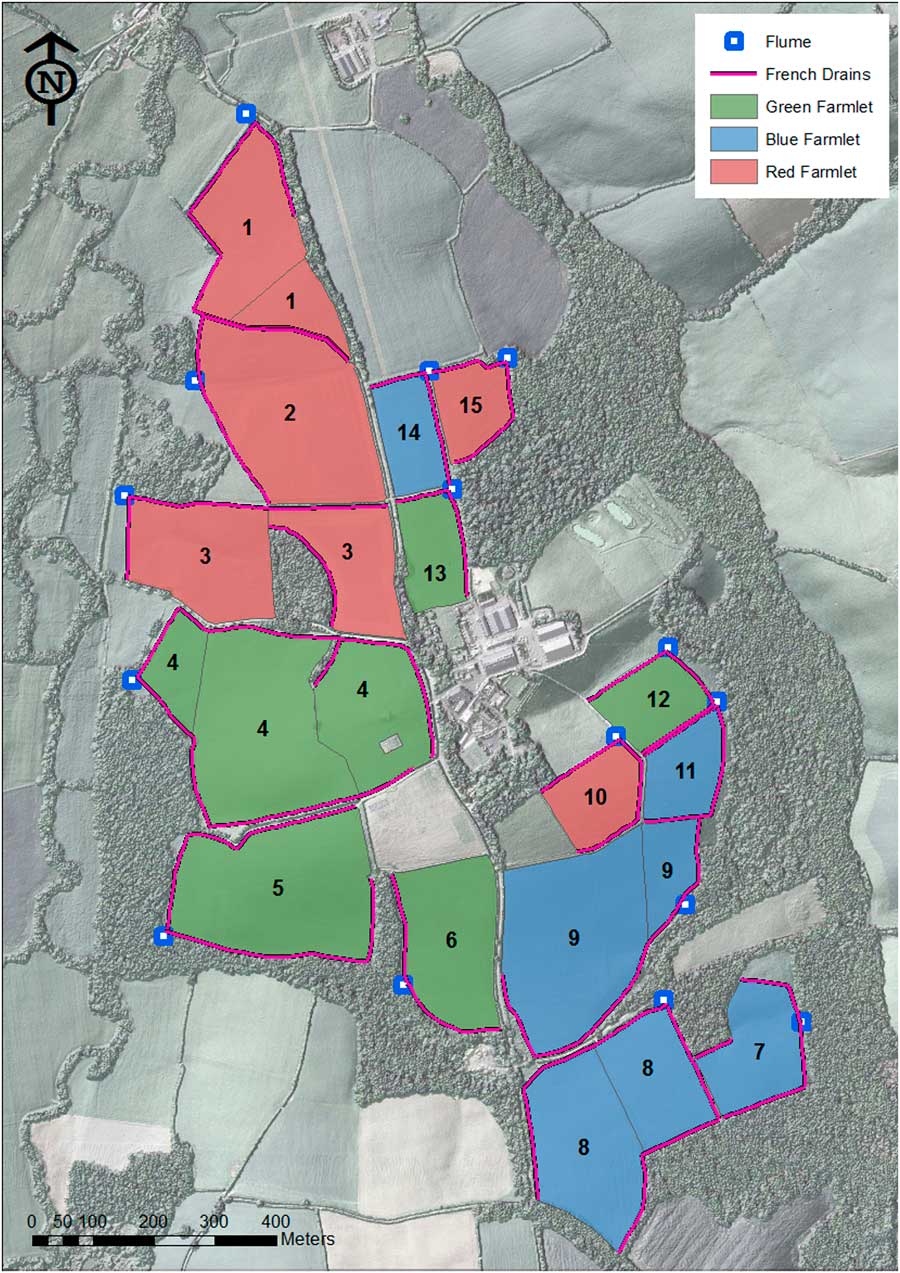
Figure 1 Design of the North Wyke Farm Platform. Numerals within the map correspond to subcatchment numbers: Green farmlet=subcatchments 4, 5, 6, 12 and 13; Blue farmlet=subcatchments 7, 8, 9, 11 and 14; Red farmlet=subcatchments 1, 2, 3, 10 and 15.
At the time of its construction, no fields on the NWFP had been reseeded for at least 20 years. All fields were reasonably homogenous and dominated (>60%) by perennial ryegrass (Lolium perenne), with a smaller biomass of creeping bent (Agrostis stolonifera), Yorkshire fog (Holcus lanatus) and marsh foxtail (Alopecurus geniculatus) also contributing to the sward; legumes, on the other hand, comprised <1% of the overall composition. While two of the three catchments were subsequently reseeded with modern cultivars as described below, this article only considers data obtained between the construction of the NWFP and 2013, the period when all subcatchments were permanent pasture and received identical rates of inorganic fertilisers (nitrogen, phosphorus, potassium and sulphur) and farmyard manure. As such, there was no treatment effect attributable to farm management that might interact with the observed patterns of economic-environmental trade-offs.
Every autumn, 30 Charolais×Hereford-Friesian calves enter each farmlet at the point of weaning. At this time, cattle are blocked between sexes and then randomly allocated to the three farmlets from an adjacent but separate cow-calf enterprise. After the entry to the NWFP, they are typically housed from October to April to avoid degradation of soil structure during the winter season, then moved and kept outdoors on their respective pastures until they reach target weights of around 555 kg for heifers and 620 kg for steers, and estimated meat quality scores (RPA, 2011) of ‘R’ (conformation) and ‘4L’ (fat). Throughout housing periods, cattle are fed silage made from their own allocated farmlet. As the NWFP’s general principle is to finish cattle solely off pasture and silage, the stocking density (for both cattle and sheep) was backcasted so that the production and consumption of silage would be in balance for most years. However, a small amount of strategic supplementary feed may also be used if the quantity and quality of silage are insufficient to meet target growth rates in any particular year. Farmyard manure produced during the housing period is stored in the midden until pastures are ready for fertilisation in the following spring.
Unlike cattle, sheep on the NWFP are left grazing on pasture for almost the entire season. Each spring, 50 Suffolk×Mule ewes and their lambs sired by Charollais rams enter each farmlet after a pool of ewes are blocked by the number of offspring (i.e. singles or twins) and then randomly allocated across the three groups. With a typical lambing rate of 1.8, this results in a flock size of around 140 sheep until mid-autumn, when lambs reaching the target weight of 43.0 kg and the estimated meat quality score of ‘3L’ (fat) are gradually taken off for slaughtering. Breeding ewes spend the following winter on the same farmlet (unless they are replaced; the typical replacement rate is 25%) and then are pooled again for the next round of random allocation. In order to maintain a consistent breed structure, lambs born on the NWFP are not used as replacements. Some fields are used by both cattle and sheep within a single season, although never together at the same time.
Over three summers between 2013 and 2015, fields on the blue and red farmlets were progressively ploughed and reseeded with different types of pastures, namely a mixture of white clover (Trifolium repens cv. AberHerald) and high sugar perennial ryegrass (cv. AberMagic) for the blue farmlet and a monoculture of high sugar perennial ryegrass for the red farmlet. Following this conversion, a farm-scale trial to investigate the effect of different pasture management strategies commenced in autumn 2015 (Orr et al., Reference Orr, Murray, Eyles, Blackwell, Cardenas, Collins, Dungait, Goulding, Griffith, Gurr, Harris, Hawkins, Misselbrook, Rawlings, Shepherd, Sint, Takahashi, Tozer, Whitmore, Wu and Lee2016). Consequently, the data period covered by the present analysis (discussed above) is the longest available from the NWFP’s replicated farm-scale trial exclusively carried out on permanent pasture, a globally unique endeavour to allow inter-comparisons of farm-level parameters under identical management strategies.
Data collected at the subcatchment scale
In the present analysis, trade-offs between economic and environmental performances were evaluated at the subcatchment level (n=15). This decision was taken to achieve an appropriate balance between two factors, namely utilising the internationally unique capability of the NWFP to quantify and analyse runoff water at the hydrological outlets of all subcatchments while at the same time maintaining a reasonable sample size to carry out statistical analysis. As is common with any pasture-based livestock production system, animals on the NWFP are rotated between grazing fields (within each farmlet), and therefore soil and botanical compositions may be best evaluated at the field scale. However, doing so restricts the use of information acquired at the flumes, as the provenance of nutrients passing through them cannot be identified. Conversely, the performance of animals, and in particular indicators related to carcass conformation and meat quality, can only be quantified at the farm scale. As aggregation of other variables to this scale reduces the sample size to the number of farmlets (three), this method was also judged to be counterproductive. Definitions of variables collected at the subcatchment scale are summarised in Table 1, while their values are shown in Supplementary Material Figure S1.
Table 1 Definitions of variables collected at the subcatchment scale

Environmental/ecological indicators
The amount of soil organic carbon (SOC) content of the top soil (10 cm depth) was estimated from the results of a soil survey conducted in June/July 2012. Soil cores were collected on a 50×50 m grid created for each subcatchment, or 263 locations across the NWFP. The total organic carbon concentration of sieved, dried and ground subsamples was determined using dry combustion, and the SOC content and the total stock per area were determined from the bulk density. These values were subsequently aggregated across all sampling points (within each subcatchment) to derive the mean and standard deviation, the latter of which was used as an approximate measure for SOC heterogeneity. Plant biodiversity within each subcatchment was estimated by the means of botanical β-diversity. A 25×25 cm quadrat was set up (a) adjacent to each soil sampling point, and (b) at additional locations identified for smaller subcatchments (on a finer 25×25 m grid) to ensure a minimum sample size. The botanical composition within these quadrats was then surveyed during July/August 2013, scored according to the Domin Scale (Rodwell, Reference Rodwell2006), and converted to the botanical β-diversity index (Jost, Reference Jost2007) at the subcatchment scale. Due to the NWFP’s reseeding programme that commenced in July 2013 (discussed above), four subcatchments were excluded from this survey.
Water discharge from each subcatchment was continuously measured by bubbler flow meters connected to the flume. Total inorganic nitrogen (TIN) discharged from each subcatchment was computed at 15 min intervals based on outputs from two sensors analysing water samples: a UV absorption sensor (for nitrate and nitrite) and an ion selective electrode (for ammonia and ammonium). The amount of suspended sediment, a common measure of net soil loss, was also estimated at 15 min intervals by converting the level of turbidity recorded by an optical sensor through an empirical equation, which has previously been calibrated based on gravimetrically filtered suspended sediment concentration at the flumes (Peukert et al., Reference Peukert, Griffith, Murray, Macleod and Brazier2014). For the present analysis, each of the discharge variables was temporally aggregated over the period between October 2012 (when the flumes became operational) and July 2013 (immediately before four subcatchments were ploughed for reseeding) to cover the longest data period available, and then standardised to account for areal differences across subcatchments.
Managerial decisions
As previously discussed, cattle and sheep on the NWFP are rotated within each farmlet. In order to quantify the level of environmental pressure imposed by animals on each subcatchment, the stocking density (measured in head days/ha) was first derived separately for the two species (Table 2). However, as these values are non-additive and thus unsuitable for subcatchment-level analyses, an additional measure of the stocking density was also computed using the notion of the cumulative BW of animals grazing on the relevant pasture (measured in t days/ha). Body weight data were based on (approximately) fortnightly weighings of all animals carried out at the NWFP, with values on non-weighing days imputed under the assumption of constant daily gain between two weighings. The variable thus created was then temporally aggregated for the period between January 2013 and December 2013, for cattle, sheep and both.
Table 2 Liveweight gain attributable to forages produced on each subcatchment
1 G=green farmlet; B=blue farmlet; R=red farmlet. These farmlets are managed separately (i.e. as replicates) but under identical farming practices.
2 Listed for readers who may wish to replicate the results using the North Wyke Farm Platform open-access data set (https://nwfp.rothamsted.ac.uk).
* Closed for reseeding from July/August 2013.
Economic performance
The subcatchment-level performance of on-farm production was measured by silage production and liveweight gain attributable to each subcatchment. At each silage cut event, dry matter yield over a 15 m2 area randomly selected on the field was sampled and weighed at the spatial frequency of one observation/ha (0.15% sampling rate). These values were subsequently averaged across all samples taken from each subcatchment to estimate the mean yield and overall production. Liveweight gain attained by animals while grazing on a particular subcatchment was obtained using the method analogous to the estimation of the cumulative BW (above). In addition, liveweight gain attained by cattle while being housed was assigned back to the subcatchments that produced the silage fed to animals. As the exact origin of silage fed on a given day was difficult to identify, the entire liveweight gain achieved by each individual animal while kept indoors was apportioned across subcatchments according to their contributions to silage production. Finally, the total liveweight gain for cattle attributable to each subcatchment was derived as the sum of gains from grazing and from silage. All economic performance variables were calculated on a per hectare basis for forage produced during 2013, including liveweight gain by cattle in early 2014 (while they were still eating the 2013 silage) but excluding that in early 2013 (while they were eating the 2012 silage).
Data collected at the farmlet scale
As discussed, the NWFP does not have a capability to measure all sustainability metrics at the subcatchment scale. While variables expressed at the farm-scale cannot be statistically analysed to explore economic-environmental trade-offs (because of their small sample sizes), they may provide useful information to understand the farm structure and, in the long term, prove to be a less costly alternative (with regards to data collection) to some subcatchment-level variables. Under this vision, farmlet-scale variables primarily covering the areas of atmospheric emissions, animal health, nutrient provision for humans, and whole-farm economic performance were also collated for each farmlet, either by direct measurement/computation or through modelling.
Environmental/ecological indicators
Greenhouse gas emissions from soil, manure and enteric fermentation on each farmlet were estimated using the Intergovernmental Panel on Climate Change (IPCC) Tier 2 calculation methods (IPCC, 2006). For computation of expected methanogenic emissions through enteric fermentation, liveweight data (described above) and forage quality data from field and silage samples were adopted into energy balance equations to backcast the dry matter intake by animals. Ammonia emissions from each farmlet were estimated from a similar set of data but using existing models designed to describe the UK ammonia emission inventory (Misselbrook et al., Reference Misselbrook, Sutton and Scholefield2004; Webb and Misselbrook, Reference Webb and Misselbrook2004). For both GHG and ammonia models, nitrogen excretion was partitioned between urine and dung, and separate calculations were carried out for male and female. Together, these estimates provide an extensive account of the environmental impact of the systems, and in particular nutrient losses to the atmosphere and into watercourses.
Animal health indicators
The number of incidences of lameness, a negative measure of animal welfare, together with severe cases of footrot and injuries likely associated with lameness was chronicled throughout the season using a livestock records management system. The cost of veterinary intervention for individual animals, including fees for professional visits and laboratory analyses, was estimated by matching financial records with animal records. Expenses for group applications, such as drenches, footbathing and vaccinations, were apportioned to each farmlet based on advice from the farm manager. In order to avoid double counting with forgone income already reflected in the whole-farm gross margin, opportunity costs attributable to ill health were not accounted for.
Nutrient provision
Information on the kill-out percentages of cattle and sheep were supplied by the commercial slaughterhouses to whom the NWFP animals were sold. Mean energy, protein and fat contents of lean muscle tissue and ground meat, for both beef and lamb, were obtained from Public Health England (2015). It was assumed that 50% of saleable meat from cattle would be consumed as lean beef and the remaining 50% as ground beef, whereas lamb would be consumed in the form of standard cuts such as legs, shanks and chops (Warris, Reference Warris2000). Data on n-3 fatty acid, haem iron and Vitamin B12 contents of meat were adopted from Daley et al. (Reference Dalgaard, Halberg and Porter2010), Pretorius et al. (Reference Pretorius, Schonfeldt and Hall2016), and Heinz and Hautzinger (Reference Heinz and Hautzinger2007), respectively. Nutrient provision from offal and cull ewes was not included in the calculation.
Economic performance
Economic performance of each farmlet was evaluated by the means of gross margin separately arising from its cattle and sheep enterprises. Revenues were based on the actual meat sales to commercial slaughterhouses, and thus the output prices reflected the quality (conformation and fat scores) of cattle and sheep carcasses. For variable costs that were not quantifiable for each farmlet, the average values for pasture-based livestock farms in the South West region of England (Department for Environment, Food and Rural Affairs (Defra), 2017) were utilised for imputation. All values were calculated on a per hectare basis.
Statistical analysis
Statistical analysis was carried out using R 3.4.0 (R Core Team, 2017). Correlations amongst 13 subcatchment-level variables (n=15) were evaluated using Pearson’s correlation coefficient (ρ) and associated t-tests. Furthermore, the degree of inter-farmlet differences in these variables was investigated by the means of the pairwise t-tests and the multi-group F-tests (one-way ANOVA) for each variable separately. The P-values for the former were adjusted through the Bonferroni correction method to account for repeated tests. Farmlet-level variables (n=3) were assessed qualitatively.
Results and discussion
Correlation coefficients between subcatchment-level variables, their P-values and the associated scattered plots are shown in Tables 3 and 4 and Supplementary Material Figure S2, respectively. The summary of farmlet-level variables is provided in Table 5. Whilst it is acknowledged that correlation does not always guarantee the existence of causal relationships, these matrices provide potentially useful information about economic-environmental trade-offs at the farm scale and help identify directions for future research in pasture-based livestock production systems. The main results are discussed below.
Table 3 Correlation matrix between economic, environmental and ecological variables

SOC=soil organic carbon; HET=SOC heterogeneity; BOT=botanical β-diversity; WAT=water discharge; TIN=TIN discharge; SED=sediment discharge; CWC=cumulative weight (cattle); CWS=cumulative weight (sheep); CW=cumulative weight; SIL=silage production; LWC=liveweight gain (cattle); LWS=liveweight gain (sheep); LG=liveweight gain.
Table 4 The P-values for correlations between economic, environmental and ecological variables

SOC=soil organic carbon; HET=SOC heterogeneity; BOT=botanical β-diversity; WAT=water discharge; TIN=TIN discharge; SED=sediment discharge; CWC=cumulative weight (cattle); CWS=cumulative weight (sheep); CW=cumulative weight; SIL=silage production; LWC=liveweight gain (cattle); LWS=liveweight gain (sheep); LG=liveweight gain.
Table 5 Economic, environmental and ecological variables collected at the farm scale
All values are expressed on an annual basis.
Potential effects of environmental/ecological conditions
Given that the soil survey was carried out (in June/July 2012) before all other data were collected, and given that the absolute level of the SOC stock is known to change relatively slowly, any correlation between SOC (or SOC heterogeneity) and other variables is likely to have been caused by the former variable. Amongst such relationships, SOC and water discharge showed a weak negative correlation (the P-value for this correlation was 0.16), possibly due to the property of SOC to enhance water holding capacity (Franzluebbers, Reference Franzluebbers2010). Reduction in water discharge, in turn, was associated with smaller losses of TIN (P=0.05) and suspended sediment (P=0.14), potentially improving the efficiency of nutrient use. A greater level of SOC was also linked to higher liveweight gain (P=0.17), while intra-subcatchment heterogeneity in SOC demonstrated the opposite effect (P=0.08). An auxiliary analysis using the NWFP’s digital terrain data (Orr et al., Reference Orr, Murray, Eyles, Blackwell, Cardenas, Collins, Dungait, Goulding, Griffith, Gurr, Harris, Hawkins, Misselbrook, Rawlings, Shepherd, Sint, Takahashi, Tozer, Whitmore, Wu and Lee2016) suggested that the level of the SOC stock on each subcatchment is strongly affected by its average slope (ρ=0.66, P<0.01). However, given that the direct correlation between the slope and animal liveweight gain was not observed (ρ=–0.10, P=0.72), strategic manipulation of ‘soil health’, for example through grazing, is likely playing a stronger role than topographical conditions for improved animal performance.
Botanical heterogeneity was positively correlated with animal liveweight gains (P=0.07). However, the direction of causality between these two variables could not be immediately identified, as the botanical survey was conducted in the middle of the grazing season (in July/August 2013) during which liveweight data were collected. Water discharge and associated losses of TIN and suspended sediment were not correlated with animal performance.
Potential effects of managerial decisions
As the stocking density (hereby measured by the cumulative BW) is a managerial variable, its value is not influenced by external factors unless the farm management intentionally alters animal rotation strategies based on observed metrics such as SOC, biodiversity and water discharge. With this practice not currently undertaken at the NWFP, any correlation involving this variable is likely to have been caused as a result of the managerial decision, rather than the other way around. In particular, a relatively higher level of botanical diversity was observed amongst subcatchments that were more densely stocked (P=0.05), possibly due to the reduced level of dominance by the most common competitive species (Kemp et al., Reference Kemp, Han, Hou, Michalk, Hou, Wu and Zhang2013). The observed weak positive correlation between cumulative BW and SOC (P=0.07) could potentially be spurious, as the soil samples were taken before the period for which stocking density was defined. However, given the largely consistent nature of the animal grazing patterns at the NWFP farmlets pre-reseeding (Peukert et al., Reference Peukert, Griffith, Murray, Macleod and Brazier2016), the increased SOC content could still have been a result from more intensive grazing and subsequent recycling of manure from previous seasons (Dungait et al., Reference Dungait, Bol and Evershed2005).
For both cattle and sheep, the stocking density levied towards each subcatchment demonstrated a strong positive correlation with liveweight gain attributable to grazing on that particular subcatchment (P<0.01 and P<0.01, respectively). This result suggests that pastures on the three farmlets did not show a sign of diminishing returns, and thus the livestock rotation carried out by the farmlets was likely to be adequate. A similar conclusion can also be drawn from the absence of a correlation between silage production and the liveweight gain arising from the same subcatchment. These tests alone, however, are unable to evaluate the possibility of underutilisation of resources.
Farm-level metrics
Across the three farmlets, the average on-farm emissions of GHGs and ammonia were estimated to be 6.0 t/ha (CO2-e) and 25 kg/ha (ammonia), respectively, with slightly smaller values recorded for the green farmlet due to its larger area (Table 2). These values correspond to the upper-middle range reported by preceding studies carried out on UK commercial farms (Edwards-Jones et al., Reference Edwards-Jones, Plassmann and Harris2009). Nevertheless, the results of such comparison should be interpreted with caution, as conventional analyses based on farm-level aggregate variables – as opposed to more disintegrated information adopted by the present analysis – are known to underestimate the overall emissions (Dalgaard et al., Reference de Olde, Oudshoorn, Sørensen, Bokkers and de Boer2001; McAuliffe et al., Reference McAuliffe, Takahashi, Orr, Harris and Lee2018).
The veterinary costs incurred by each of the three farmlets, including the outlays to treat the likely causes of lameness, were estimated to be £84/ha, a level considerably higher than the average values (£30/ha) for pasture-based livestock farms in the region (Defra, 2017). This discrepancy is thought to be associated with the NWFP’s role as a national demonstration farm of good agricultural practices, whereby animals are kept to high welfare standards to realise improved economic performance and therefore subject to more frequent interventions (e.g. to treat any sign of lameness) than a conventional farm. A comparison of the whole-farm gross margin between the NWFP (£1178/ha across farmlets) and the regional average (£786/ha: Defra, 2017) suggests that this strategy may be financially justified; it should be noted, however, that the definition of gross margin does not encompass expenses related to labour force, and the seemingly satisfactory whole-farm performance may partly be due to extra labour input that are not always available on commercial farms.
Similar to other farm-level variables, the values for nutrient provision from the three farmlets were mostly comparable to each other. To the best of our knowledge, benchmark figures for these metrics are not readily available for pasture-based farming systems. Compared with nutrients available in wholemeal wheat flour (Public Health England, 2015) originating from a hectare of an average UK farmland (where the grain yield is 7.9 t/ha), the reported values were 25 times lower for energy, 4.8 times higher for protein, 28 times higher for fat, and almost comparable (1.2 times lower) for n-3 fatty acids. Amongst them, the result for protein should be interpreted with particular caution, as the protein digestibility corrected amino acid score for typical meat (around 0.9 out of the maximum score of 1.0) is considerably higher than that for wheat (0.5 to 0.7) due to the former’s provision of all essential amino acids (lysine, threonine, methionine, phenylalanine, tryptophan, leucine, isoleucine and valine: Schaafsma, Reference Schaafsma2000). Wheat does not contain either Vitamin B12 or haem iron; its iron content (ca. 38 mg/kg) is less bioavailable than haem iron and also subject to absorption inhibitors (Grimm et al., Reference Grimm, Sullivan, Alasfoor, Parvanta, Suleiman, Kaur, Al-Hatmi and Ruth2012). It is acknowledged that for a full comparison of nutritional provision capacity from the same area of land, wheat yield on the same NWFP soil, which has never been measured, should also be taken into consideration. Notwithstanding, these discussions provide the first step towards ascertaining the true shadow value of land, information vitally required for global food security debates.
The results of the pairwise t-tests and multi-group F-tests both showed that none of the 13 subcatchment-level variables had statistically significant (P<0.05) differences amongst the three farmlets (Supplementary Material Table S1). While non-rejection of the null hypothesis does not immediately confirm the absence of the treatment effect, the highly consistent nature of these results seems to indicate that any difference in value between subcatchments is likely to be a consequence of either physiographic factors (e.g. slope, aspect and soil structures) or farming activities within each subcatchment, rather than animal allocation at the beginning of the season.
Summary and future research
The above exploratory analysis based on farm-scale data presents a case exemplar of how economic-environmental trade-offs within pasture-based livestock production systems can be researched at a scale beyond traditional field trials. Such investigations would not be possible when the system boundary is set at a scale smaller than the whole farm, as nutrient movement accompanying animal rotation – from soils to pasture to animals and then back to soils – and associated losses to atmosphere and watercourses cannot be holistically evaluated. While accumulation of additional data may be required to establish rigorous causal relationships between the environmental, managerial and economic performances, potentially insightful hypotheses are already emerging. In particular, the three-way interaction between ‘soil health’, ecological surroundings and livestock grazing discussed above needs to be explored further under hydrologically isolated conditions (including the NWFP farmlets), in order to produce an evidence base for livestock producers to engage in more efficient, and perhaps more circular, farming systems that will benefit them in the long run.
The metrics covered in the present analysis are, of course, merely examples. In addition to the continuation of the existing trials to extend the temporal horizon of the data set, for example through repeated soil and botanical surveys and multi-season recording of discharge information, we have identified the following four priority areas that we believe will expand the scope of the farm-scale trade-off assessments at the NWFP. All these works are currently ongoing.
The first area is to increase the types of information collected in the form of primary data, and thus reduce the level of uncertainty related to nutrient flows. In particular, atmospheric emissions and phosphorus cycling that have primarily been estimated through process-based modelling will be replaced by, or supplemented with, sensor-based measurements at both subcatchment and individual animal scales. Second, spatial resolutions of information will be enhanced within each subcatchment to link the field-scale implementation of precision agriculture to the trade-off analysis on the whole-farm level. Examples include more detailed spatial analysis of botanical distribution throughout the season and its relationship with animal behaviour and welfare on pasture, with the use of remote sensing technologies to complement on-field work. Third, the system boundary will be further expanded to cover the entire supply chain, including production processes both upstream and downstream of the NWFP farmlets. While the framework of life cycle assessment largely supports this concept, additional primary data will also be collected to examine societal values of meat produced under different farming strategies, including nutritional values for humans, health benefits and disbenefits, consumer preference for organoleptic properties, and shelf life associated with food waste and quality deterioration before consumption. Finally, to ensure relevance of the platform approach to real commercial producers and by extension the wider market, ‘fit-for-purpose’ decision support tools will be developed. This is an important part of our scientific strategy, as the vast majority of farms do not have the capacity to quantify many metrics developed on instrumented farms and, equally importantly, no single platform can completely represent the wide spectrum of farms that differ in weather, topography, soil and management. To overcome these issues, field-scale and farm-scale computer models developed or calibrated with the NWFP data (e.g. Wu et al., Reference Wu, Zhang, Griffith and Misselbrook2016) will be upscaled under national-scale modelling frameworks (e.g. Zhang et al., Reference Zhang, Collins, Jones, Johnes, Inman and Freer2017) to enable systematic estimation of key metrics across the United Kingdom, including those on downstream water quality that cannot be monitored within the NWFP. Concurrently, a ‘customer-friendly’ set of sustainability measures – less costly to obtain but sufficiently correlated with scientifically robust metrics – will also be identified.
Collectively, the work outlined above will allow a truly comprehensive assessment of innovations and farming interventions designed for temperate lowland grasslands based on their system-wide impact and value. Given our experience thus far, there is no doubt that a similar exercise covering the whole spectrum of diverse farming systems around the world (Eisler et al., Reference Eisler, Lee and Martin2017) will significantly contribute to the sustainable future of global livestock production and, ultimately, global food security.
Acknowledgements
This paper is an invited contribution following the First Global Farm Platform conference (12th to 15th January 2016, Bristol, UK). The Global Farm Platform is an international initiative linking research farms around the globe to develop solutions for sustainable ruminant livestock production (http://www.globalfarmplatform.org). Part of the analysis presented here was carried out for Soil to Nutrition, Rothamsted Research’s Institute Strategic Programme supported by the Biotechnology and Biological Sciences Research Council (BBS/E/C/000I0320). The NWFP is a UK National Capability, also supported by the Biotechnology and Biological Sciences Research Council (BBS/E/C/000J0100).
Declaration of interest
The authors declare no potential conflict of interest associated with this research.
Ethics statement
No work carried out for this research was subject to approval of an ethics committee.
Software and data repository resources
Both the statistical software (R Core Team, 2017) and the dataset (https://nwfp.rothamsted.ac.uk) used for this research are publicly available.
Supplementary material
To view supplementary material for this article, please visit https://doi.org/10.1017/S1751731118000502


 Open access