


Introduction
The Extant Life Volumetric Imaging System (ELVIS) is a combined digital holographic microscope (DHM) and fluorescence light-field microscope (FLFM) that uses the same objectives and sample chamber to provide overlapping volumes of view for instantaneous 3D measurement in amplitude, quantitative phase, and fluorescence. The construction and operation of the system is described in the May 2020 issue of Microscopy Today [Reference Kim1].
Materials and Methods
A first field test of the instrument was performed at the Kerckhoff Marine Laboratory, Newport Beach, CA, in July 2019. The instrument was transported to an indoor laboratory near the beach and set up within an hour. In transporting the system, there was no special care taken other than placing the microscope into a foam-filled carrying case to keep it free from vibrations and shock. Once the microscope was set up at the lab, we performed initial tests using microbeads and U.S. Air Force (USAF) targets, as described in our previous article, to confirm that the transport caused no misalignment [Reference Kim1].
The first field sample was obtained directly from the nearby ocean. A sterile container was immersed in seawater ~10 m offshore and ~1 m deep to collect approximately 4 L of sample to be shared among the present instrument and others being tested in parallel. Subsequent sample handling for the combined instrument was performed in a nearly autonomous manner using a custom sample processing unit (SPU). The SPU was designed to route a 100 μL sample to a microfluidic sample chamber mounted in the field of view (FOV) of the combined instrument. Once within the FOV, the cells within the sample were imaged by ELVIS. For each 100 μL sample, we imaged 5 fields of view for 30 seconds each. Following this, the sample was routed to a mixing chamber where one of three possible cellular dyes was applied. These dyes were chosen to target cellular structures likely to be common to all life, including cellular membranes and nucleic acids. In our field test, we selected two dyes. Acridine orange (AO) for nucleic acids (both DNA and RNA) [Reference Francisco2] (Sigma-Aldrich 01640) and FM1-43 for cellular membranes [Reference Fishov and Woldringh3] (ThermoFisher T-3163). In applying the dyes, care was taken to keep both the sample and the stock dyes away from light to minimize photobleaching. The dyes chosen were water-soluble and sold as powders for compatibility with the fluidic system, which was printed from WaterShed XC 11122 (Protolabs, Maple Plain, MN). It is important to note that many commonly used dyes for bacterial enumeration, such as SYTO9/Propidium iodide (“live/dead”) (Boulos, 1999 #443), are often sold in dimethylsulfoxide (DMSO) solution. Lyophilized, water-soluble forms are available and should be used whenever material compatibility of the fluidic channels is a potential concern.
Once the first dye (AO) had been applied, the sample was allowed to react for 20 minutes before being routed back to the sample chamber. Once there, the sample was again imaged by the combined system. Following the imaging, the sample was re-routed to a mixing chamber, and the second dye (FM1-43) was applied.
Finally, in addition to control of sample delivery and staining of the sample, the SPU also allowed the system to be rinsed with water and disinfected with a 70% ethanol solution. The addition of these functions allowed the system to perform in a largely autonomous mode as the system cleaned itself between runs, waited for a sample to operate, and performed staining operations automatically (Figure 1(a)).
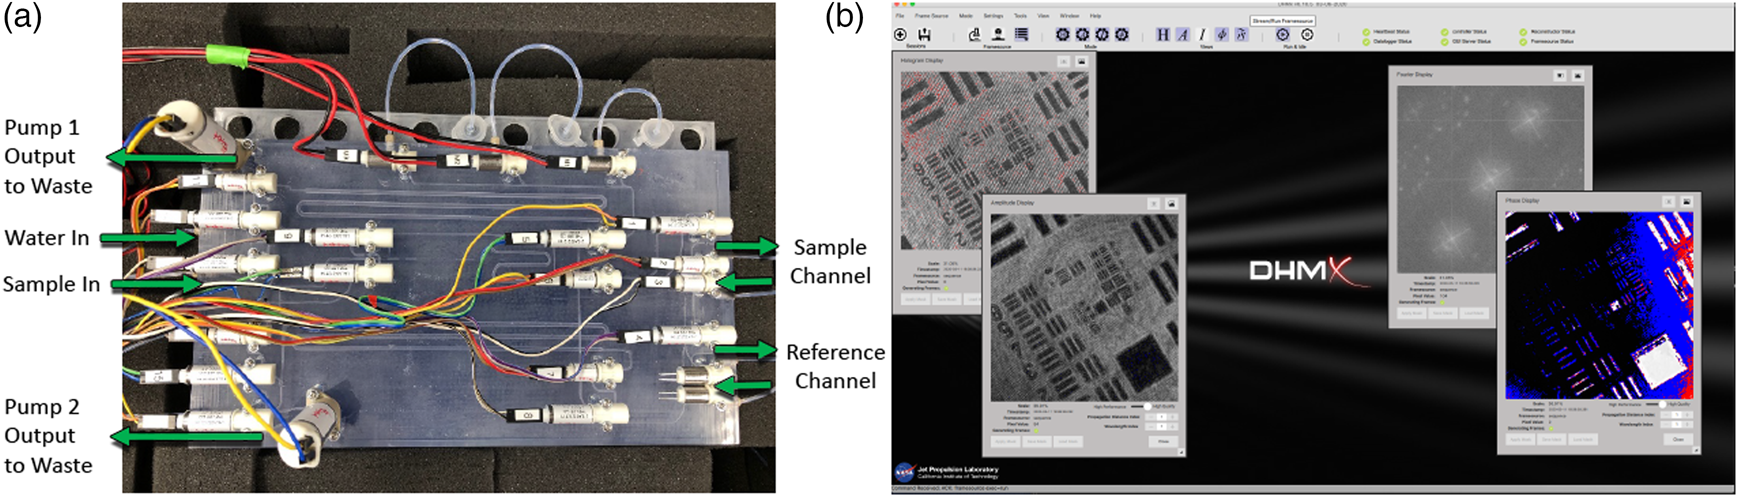
Figure 1: Automation of ELVIS. (a) The fluidic (SPU) with pumps and valves for sample delivery and staining. (b) Software interface.
Image acquisition was also performed in an automated manner. Based on the software development kit (SDK) provided by Allied Vision, we developed custom acquisition software to control each camera's exposure, gain, and capture separately. The acquisition software, called DHMx, includes features for holographic image processing and is available as an open-source package on GitHub (https://github.com/dhm-org/dhm_suite). Two copies of the software were run simultaneously to control the DHM and FLFM cameras. By adding an external trigger system built using Arduino, we were able to synchronize the two cameras within a 0.2 ms delay. Finally, a script controlling the DHMx software as well as the trigger system was developed to allow for simultaneous image capture from the two cameras (Figure 1(b)).
Using the automated sample handing and image capture described above, we examined ocean water collected from Newport Beach. The results are described in detail in the following section.
Results
In the randomly collected sample from the ocean, we successfully detected signs of both eukaryotes and prokaryotes.
Eukaryotes.
A variety of rapidly swimming eukaryotes, 3–50 µm in diameter, were apparent immediately in raw DHM and FLFM images. Many, but not all, of these were autofluorescent due to the presence of chlorophyll. For further analysis, we performed volumetric reconstructions on both DHM and FLFM raw images, followed by minimum z-projection for DHM and maximum z-projection for FLFM. The time-series of projected data was then minimum (DHM) and maximum (FLFM) projected to reveal their tracks. Figures 2(a) and 2(b) show a correlated FOV from both microscopes without a dye applied. It is interesting to note that some organisms were more visible in the FLFM, and others could be seen only under the DHM. This is because of their contrast mechanisms: a fluorescent organism with low absorption at 405 nm appears only under FLFM, while a non-fluorescent one with high absorption at 405 nm appears only under DHM.
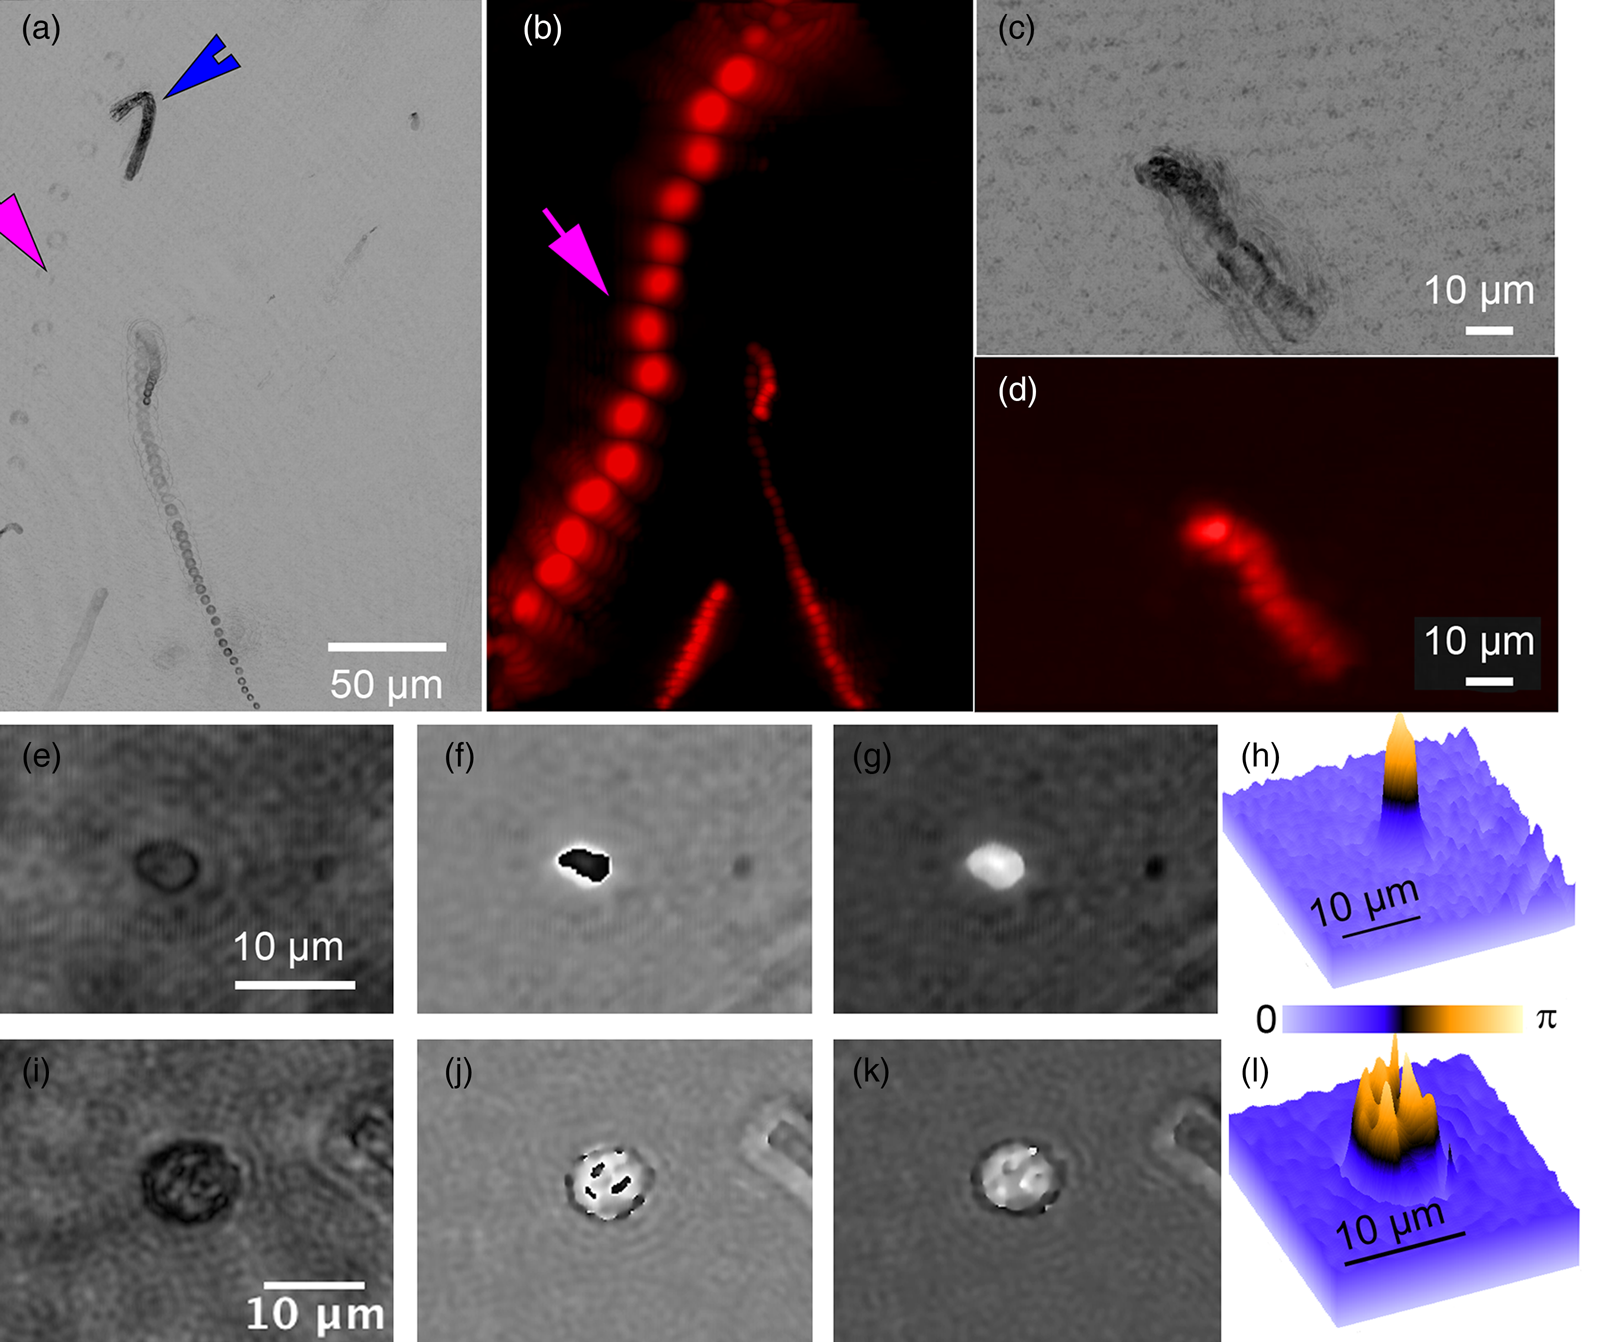
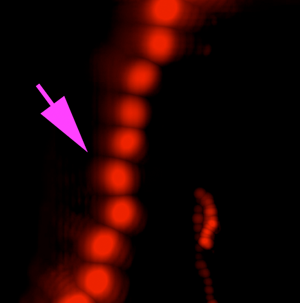
Figure 2: ELVIS field performance. (a) DHM amplitude minimum projection in a single focal plane of a 300-frame (20 s) recording. (b) LFM maximum projection of the same FOV. Note that the organism indicated by the magenta arrow is highly apparent in LFM but almost invisible in the DHM image; the organism indicated by the blue arrowhead only appears in the DHM image. Note that each fluorescent spot represents one frame of the LFM maximum projection to show movement of the organism. (c) DHM minimum amplitude projection of 802 frames (53 s) after AO addition. (d) LFM maximum intensity projection of 802 frames with AO. (e–h) Close-up on a small eukaryote in DHM amplitude (e), phase (f), and unwrapped phase (g). Panel (h) shows the phase shift in radians as a surface plot. (i–l) A more complex eukaryote showing intracellular structures in amplitude (i), phase (j), unwrapped phase (k), and as a phase shift surface plot.
The addition of AO did not seem to reveal additional organisms and caused an almost complete loss of organism motility (Figures 2(c) and 2(d)). The motion shown in Figures 2(c) and 2(d) are due to the slight background flow and Brownian motion.
Cells and subcellular features that appeared dark in amplitude images usually showed high phase contrast and vice versa, but not always. For larger cells detected using ELVIS, we performed DHM reconstructions on the focal planes of the individual cells. The reconstructions revealed subcellular structure in both amplitude and phase. Figures 2(e)–2(h) show a cell that appeared fairly transparent in the center under amplitude, but which had very high phase contrast. This pattern is typical of chlorophyll, which is highly dispersive and absorbs strongly at 405 nm. Figures 2(i)–2(l) show a cell where the subcellular features are apparent in both amplitude and phase. Reconstruction and unwrapping were performed using our custom Fiji plug-ins[Reference Cohoe4] available from https://github.com/sudgy.
Prokaryotes.
The detection of prokaryotic cells was performed mainly with the DHM because of its higher resolution. Marine bacteria could be identified on single-plane reconstructions in amplitude as featureless particles (Figure 3(a)). The volumetric information yielded cell counts and motility patterns. Many marine bacteria show characteristic zig-zag swimming with velocities up to 40 µm/s [Reference Stocker5]. Based on the high-resolution images from DHM, we were able to detect some particles that showed lifelike motility in the sample (Figure 3(b)). Estimates of the refractive index of particles could be calculated as in a previous study [Reference Bedrossian6]. The refractive index of the non-motile, micron-sized particles in the seawater differed from water only by ~0.1, suggestive of cells rather than sand grains or other mineral particles (Figure 3(c)). The total particle count in the seawater was ~103 eukaryotes and 105 prokaryotes/mL, consistent with the value obtained using a ground truth method of AO staining, paraformaldehyde fixation, and cell counting using high-resolution fluorescence microscopy.
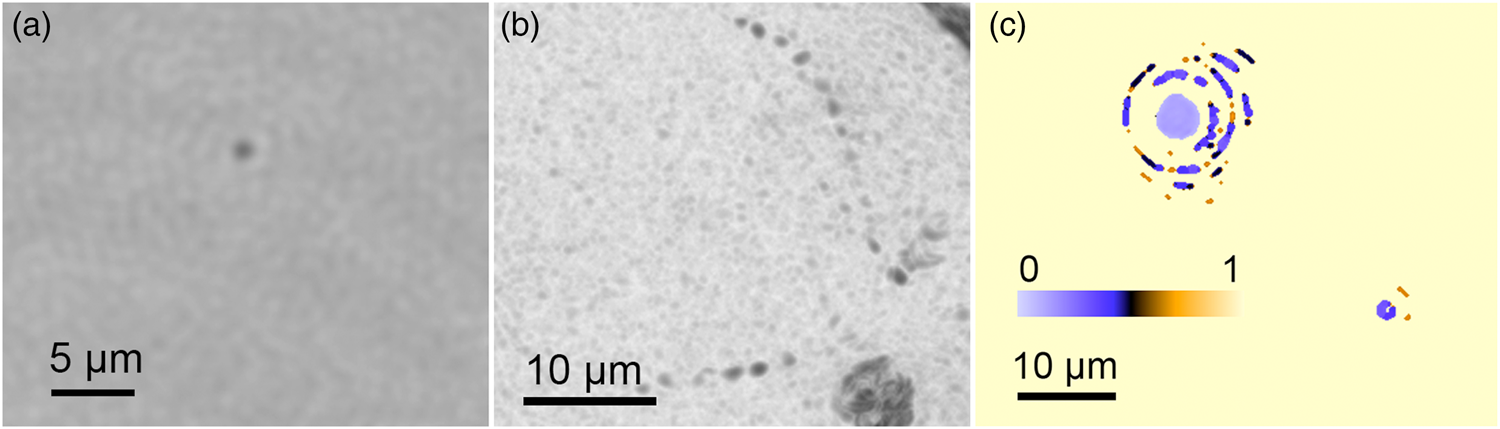
Figure 3: Prokaryotes. (a) Structureless particles seen at the edge of DHM resolution. (b) When the particles were motile, they could be readily identified as prokaryotic organisms. (c) A plot of the estimated index of refraction difference between imaged particles and the surrounding water.
Improvements to Performance: Lab Samples
Following the field test at Newport Beach, we moved the instrument back to the Jet Propulsion Laboratory and analyzed the instrument performance. The major limitations of the instrument identified in the field testing were mainly in the FLFM side of the combined instrument: (a) high background fluorescence; and (b) lack of spectral capability to distinguish dye labeling from chlorophyll autofluorescence.
Simple modifications after the field trip resulted in improved performance. The acrylonitrile butadiene styrene (ABS) (RenShape SL 7820) 3D-printed objective lens holder was found to show significant autofluorescence at 470 nm, so it was replaced by a holder made of anodized aluminum. As a result, the background level of the FLFM was decreased down to 1–2 counts at maximum excitation intensity, when measured without a sample and using the same exposure and gain settings as the field test. With the previous objective lens holder, the background from the plastic autofluorescence saturated the 8-bit image (256 counts) at 20% of the maximum excitation intensity. Another source of background was from the residual fluorescent dyes in the background medium. We performed an optimization study for dye concentration using a bacterial test strain, Escherichia coli, which is approximately 1 µm wide by 2 µm long. By imaging the bacteria stained with various concentrations of the two dyes, we determined that 50 nM SYTO-9 and 10 nM FM1-43 provided the highest signal-to-background ratio (SBR), while maintaining high probability for each cell to be stained. Given the updates made to the system and the dye concentration determined, we were able to successfully image E. coli stained with 50 nM Syto-9 under FLFM. A single FOV of the stained sample was imaged, volume-reconstructed, and maximum-projected over the z-direction. Figure 4(a) shows the result, where the stained bacteria show up clearly over the low background. Figure 4(b) shows the DHM counterpart of the same image, taken simultaneously. The image was volume reconstructed for amplitude and minimum z-projected. These results illustrate that although unresolved, single stained bacteria may be detected using the FLFM.
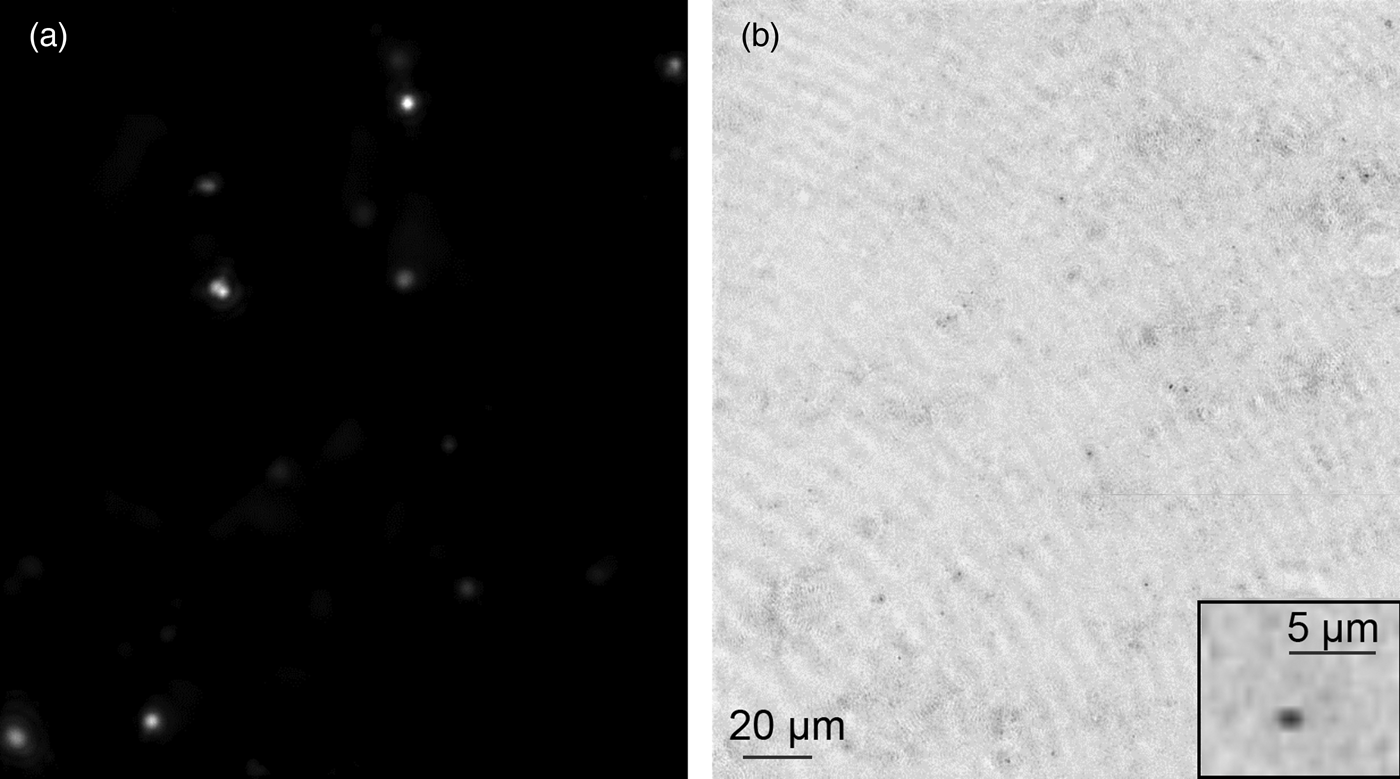
Figure 4: Improved FLFM system sensitivity by removal of fluorescence background. (a) Improved sensitivity proven by single bacteria detected under FLFM. The sample is 50 nM SYTO-9 stained E. coli imaged with FLFM at 60 ms exposure. A single image was captured, volume reconstructed, and then maximum z-projected over 300 µm depth of field. (b) Simultaneously captured DHM image of the same FOV. DHM amplitude was volume reconstructed and minimum z projected. The inset shows a single cell under DHM.
Finally, an RGB camera (Basler, ace ac A4024-88gb) in our FLFM system was also used to distinguish chlorophyll from common dyes. By using a color camera, a single shot provides three images with three different color filters defined by the Bayer filter on the sensor. Therefore, a single shot can image the sample with a wavelength coverage from 500 nm to 750 nm, defined by the dichroic mirror (Thorlabs, DMSP490R) and the camera's spectral range. This advantage of distinguishing color adds extra specificity information without having to add extra spectral filters or having to take multiple images.
To maximize specificity, we also built a stand-alone FLFM system using a multi-band filter set (Chroma, 89402) (Figure 5(a)) and a white-light LED (Thorlabs MNWHL4) so that each of the spectral bands was clearly separated from others. Figures 5(b) and 5(c) show a raw and reconstructed seawater sample stained with FM1-43, where a large cell shows green fluorescence on the membrane from the dye and red from the native chlorophyll. Although we did not have a priori knowledge of the existence of chlorophyll in the sample, the color (red) information provided us with a ground for deducing the existence of chloroplasts in the cell. Figure 5(d) shows a seawater sample stained with AO, illustrating the difference between the emission of AO bound to DNA and nonspecific binding/autofluorescence [Reference Nadeau7].
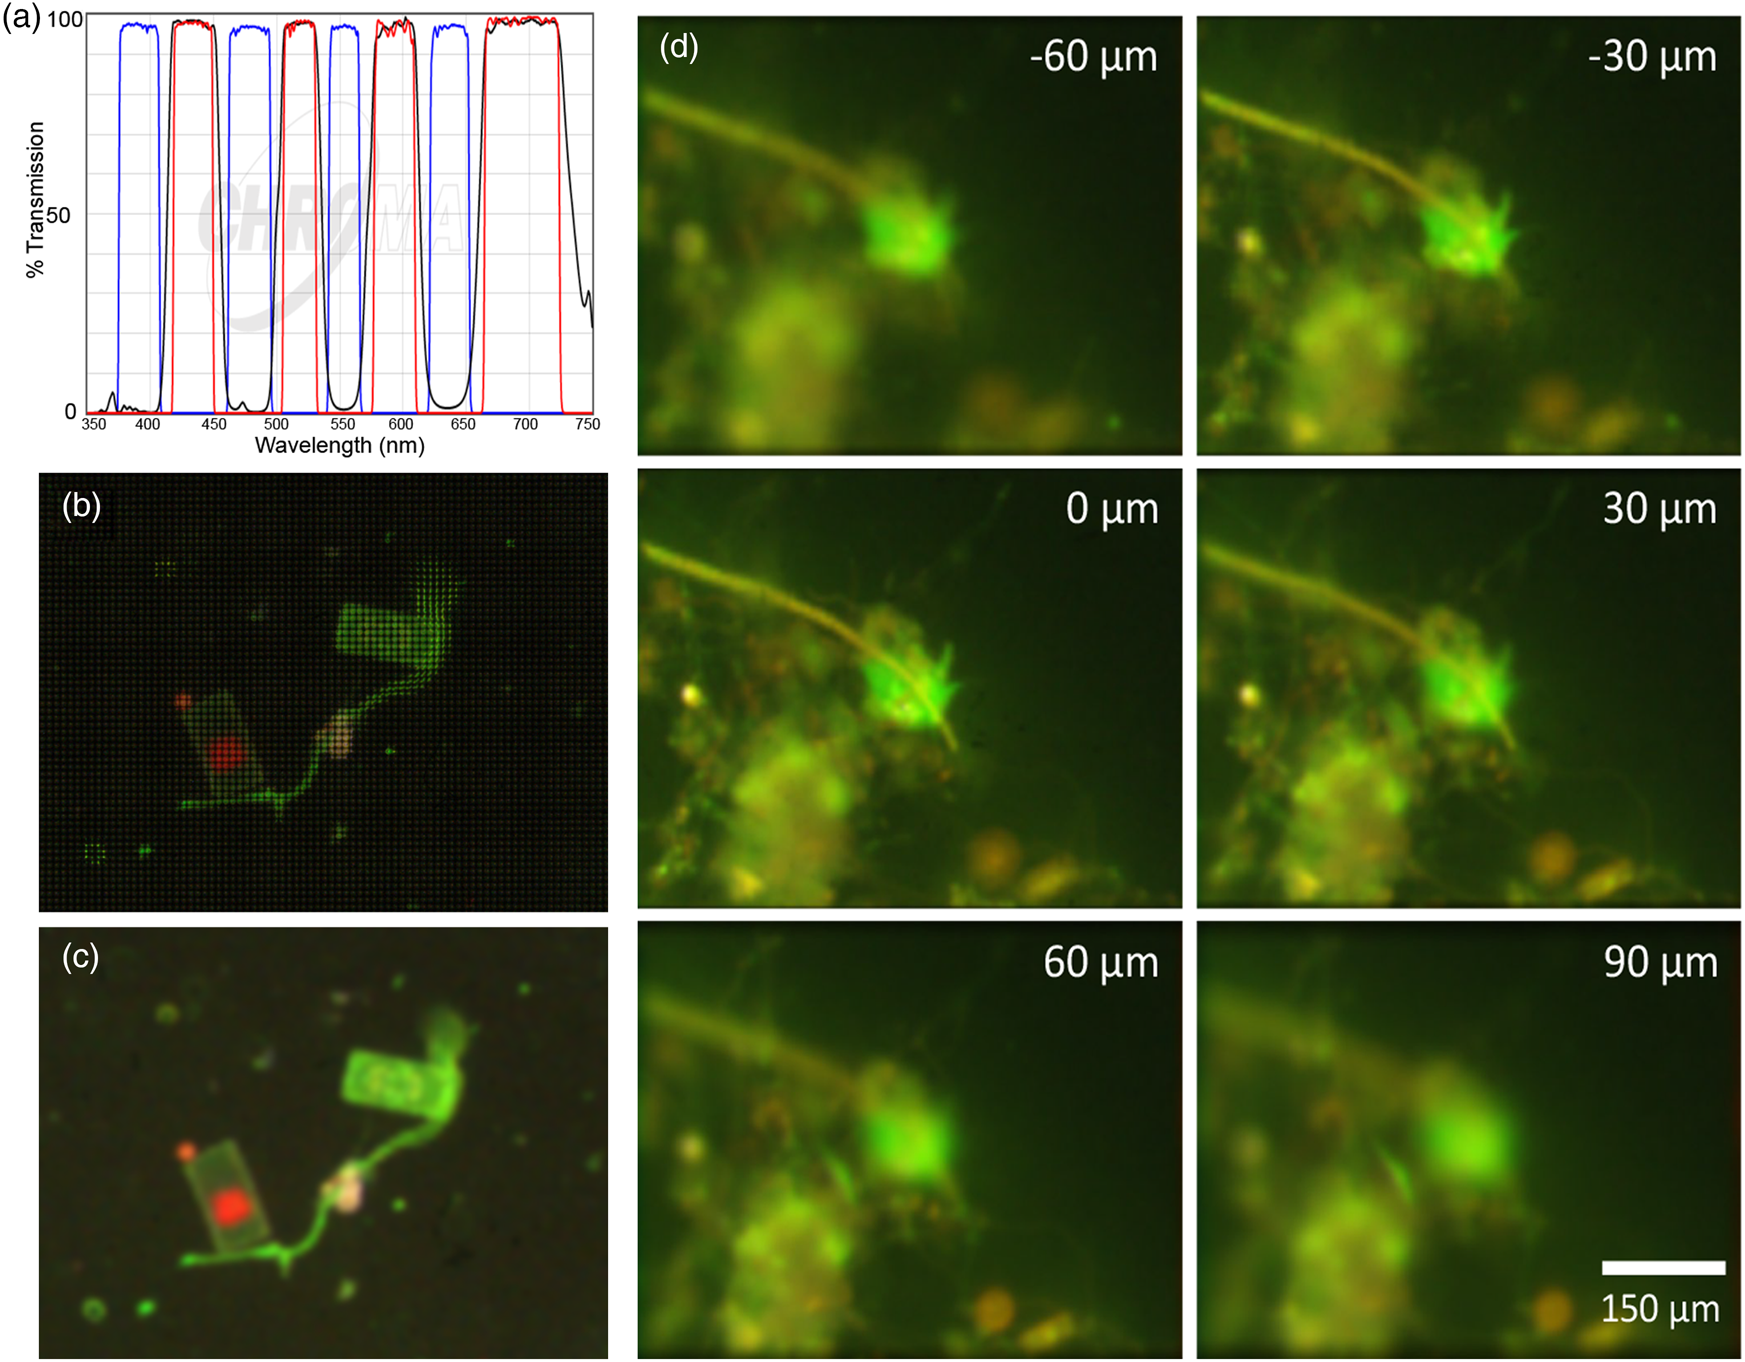
Figure 5: Multispectral FLFM. Scale bar applies to all panels. (a) Multi-bandpass filter designed for simultaneous use of multiple dyes with white-light excitation. (b) Raw FLFM image of an FM1-43 stained seawater sample. The grid pattern results from the individual sub-apertures of the microlens array. (c) Reconstruction on one focal plane showing the distinction between dye staining the membranes (green) and chlorophyll (red). (d) Z-stack through a seawater sample. AO is red when bound to RNA, is green when bound to DNA, and shows general yellowish fluorescence when nonspecifically bound. Having RGB information permits specific binding to be readily identified. The cell nucleus is brighter than the rest of the cell, which is a uniform green; the yellow is nonspecific. The use of lower AO concentrations will reduce nonspecific staining and extranuclear staining in the cells.
Discussion
In our initial field trip with our combined microscope system, we were able to successfully demonstrate several of the capabilities and potential of ELVIS for use in aquatic microbiology applications. The multitude of data yielded simultaneously for each cell, including morphology, motion, and fluorescence, combined with the high throughput of the system provides high confidence for detection and enumeration of cells. The system as originally built is especially well-suited for distinguishing photosynthetic from non-photosynthetic microalgae while providing cell counts for both. This is an application of interest to many marine biologists, especially if it can be measured in real time and at varying depths; a variety of submersible imaging spectrometers that gate on chlorophyll have been developed [Reference Olson and Sosik8,Reference Malkassian9]. For marine biology applications focused on chlorophyll, the original system remains the simplest and is sufficient.
However, for dye labeling with multiple dyes or to distinguish dye labeling from autofluorescence, fluorescence spectral information is needed. This may be obtained by using an RGB camera with either a long-pass or multiple-bandpass filter. Careful selection of filters is required to separate chlorophyll autofluorescence from dye staining and to permit the same acquisition times to capture both simultaneously, since chlorophyll fluorescence may be much brighter than dye emission depending on the wavelength and intensity of excitation; this is a serious problem in plant biology [Reference Kodama10]. The properties of chlorophyll fluorescence are complex but have been well studied in the context of plants as well as microalgae [Reference Kalaji11–Reference Takahashi13].
The system may eventually be interfaced with a liquid crystal tunable filter (LCTF) or other multi-spectral imaging systems for full spectral information [Reference Zimmermann14,Reference Hiraoka15]. Separating the fluorescence excitation and emission from the DHM in a combined system poses some difficulty but can be achieved with narrow-band filters and either white-light or multiple-LED excitation.
Acknowledgements
Portions of this work were performed under a contract from the Jet Propulsion Laboratory, California Institute of Technology, and at the Jet Propulsion Laboratory, California Institute of Technology, under contract with the National Aeronautics and Space Administration. Portions of this work were supported by NSF grant #1828793.


