


Uric acid is a product of the metabolic breakdown of purine nucleotides, and it is a normal component of urine. However, an abnormally high level of uric acid in the blood can cause hyperuricaemia. Hyperuricaemia affects worldwide people, and its prevalence ranges from 2·6 % to 36 % in different populations(Reference Uaratanawong, Suraamornkul and Angkeaw1). Generally, the prevalence of hyperuricaemia in developed countries is higher than that in developing countries, but it has been increasing annually in recent years in developing countries, such as China(Reference Zhu, Pandya and Choi2). With the rapid economic development and the improvement of residents’ living standards, prevalence of hyperuricaemia in mainland China has reached 13·3 % (19·4 % in men and 7·9 % in women) though it was once considered as a rare disease in this country(Reference Liu, Han and Wu3,Reference Fang4) . It was reported that hyperuricaemia was related to gout, the metabolic syndrome, hypertension, diabetes, chronic kidney disease, CVD, preeclampsia and stroke(Reference Johnson, Kang and Feig5–Reference Li, Hou and Zhang9).
To reduce complications of hyperuricaemia, it is necessary to explore the aetiology of hyperuricaemia. Age, sex, race, genes, smoking, drinking, obesity, physical activity and dietary habits were considered to be associated with the development of hyperuricaemia(Reference Han, Zhang and Zhao10–Reference Shiraishi and Une15). Besides, studies suggested that malnutrition was associated with developmental disruption in Notch signalling pathway, an important pathway in nephron formation, which could cause a decline of renal nephron numbers. Less renal nephron numbers indicated renal dysfunction and was related to underexcretion of uric acid, thus leading to hyperuricaemia(Reference Luyckx and Brenner16–Reference Murphy and Shipman18). Therefore, malnutrition may be another factor contributing to hyperuricaemia.
Some experiments have been conducted on the link between short-term undernutrition and later hyperuricaemia(Reference Alderman and Davis19–Reference Lennox21). The ‘fetal origin of adult disease’ hypothesis has proposed that malnutrition at a very early age might be linked to adult chronic diseases(Reference Barker22). Thus, early-life malnutrition might have long-term effect on adult hyperuricaemia. However, up to now, studies in this topic are few and data on the relation between famine exposure in adolescence and adulthood hyperuricaemia are not available(Reference Zhang and Luan23,Reference Wang, Weng and Wan24) . Thus, in the present study, we used the data from ‘Qingdao Diabetes Prevention Program’ study in China in 2006 and 2009 to further analyse the impact of early-life famine exposure on hyperuricaemia in adulthood.
Methods
Subjects and design
Using stratified, random cluster sampling methods, two population-based cross-sectional surveys were conducted in three urban areas (Shinan, Shibei and Sifang) and three rural areas (Huangdao, Jiaonan and Jimo) in Qingdao city, Shandong province, China in 2006 and 2009. Participants who had lived in Qingdao for at least 5 years were recruited. A total of 5335 and 5110 individuals aged 35–74 years participated in the 2006 and 2009 surveys, with response rates of 87·8 % and 67·1 %, respectively. The sampling, protocols, questionnaires, physical examination and laboratory determination methods in 2006 survey were exactly the same as that in 2009 survey, whereas participants of the two surveys were not duplicate.
Because Chinese famine affected almost the entire country, participants could not be categorised into different groups according to exposure areas or non-exposure areas(Reference Liu, Yu and Zhao25). Using birth date to define famine exposure was the most common method in studies about Chinese famine(Reference Lu, Li and Xu26). Precise data on energetic consumption and definite beginning or ending time of Chinese famine are not available(Reference Zimmet and Shi27). Referred to other published studies(Reference van Abeelen, Elias and Bossuyt28,Reference Wang, Wang and Han29) and Bogin’s life cycle theory(Reference Bogin30), we divided subjects into four groups: fetal/infant exposed (born between 1 January 1959 and 31 December 1962), childhood exposed (born between 1 January 1950 and 31 December 1958), adolescence exposed (born between 1 January 1942 and 31 December 1949) and the unexposed (born before 1941 and after 1963). Subjects exposed to famine in the fetal period were likely to experience famine in the infancy period because Chinese famine lasted from 1959 to 1962. Therefore, subjects born between 1 January 1959 and 31 December 1962 were grouped into fetal/infant exposed group in the current study. To minimise misclassification of the famine exposure periods, participants born immediately before (between 1 January 1941 and 31 December 1941) and after (between 1 January 1963 and 31 December 1963), the famine were excluded (n 1390). Finally, 9055 subjects were included in the current study.
Measurements and variables
Participants’ general demographic information including birth date, sex, marital status, education, individual month income, alcohol consumption, smoking habits, family history of hyperuricaemia and residence place was collected by trained doctors or nurses. Height and weight were measured with the participants wearing only light clothes and without shoes. After at least a 15-min rest, three consecutive blood pressure readings from the upper right arm of seated individuals were recorded at least 30 s apart and the mean of the three readings was used in the data analysis. BMI was calculated as weight in kg divided by height in metre squared (kg/m2).
Blood samples were drawn from the antecubital vein into EDTA tubes containing sodium fluoride and centrifuged at the survey site. The blood specimens were placed in ice-cooled containers and transported immediately to Qingdao Hiser Medical Center in 2006 survey and Qingdao Endocrine & Diabetes Hospital in 2009 survey for biochemical tests. Fasting plasma glucose (FPG), 2-h plasma glucose (2hPG), fasting serum uric acid (UA), triglycerides (TAG), total cholesterol (TC), high density lipoprotein cholesterol (HDL)-cholesterol and low density lipoprotein cholesterol (LDL)-cholesterol were tested in laboratories.
Hyperuricaemia was defined as serum uric acid > 420 μmol/l for men and >360 μmol/l for women according to guidelines(Reference Fang and Alderman31). Family history of hyperuricaemia was defined at least one of the first degree relatives had hyperuricaemia. Overweight was defined as BMI ≥ 24·0 kg/m2, and obesity was defined as BMI ≥ 28·0 kg/m2(Reference Chen32). Hypertension was defined as systolic blood pressure (SBP) ≥ 140 mmHg and(or) diastolic blood pressure (DBP) ≥ 90 mmHg. Diabetes was defined as fasting plasma glucose ≥ 7·0 mmol/l and/or 2-h plasma glucose ≥ 11·1 mmol/l(Reference Alberti and Zimmet33). Subjects with at least one of the following criteria were diagnosed with dyslipidaemia: (1) total cholesterol ≥ 5·72 mmol/l; (2) TAG ≥ 1·70 mmol/l; (3) HDL-cholesterol < 0·91 mmol/l and (4) LDL-cholesterol ≥ 3·64 mmol/l(34). According to the statistical bulletin issued by Qingdao, China in 2005, high individual month income was defined as individual month income ≥ RMB 1000 for city citizens and ≥ RMB 600 for urban citizens (2021 average: 1 USD = 6·48 RMB).
Statistical analysis
Group differences were tested using one-way ANOVA complemented by the LSD test for continuous variables with normal distribution and the Mann–Whitney U test or Kruskal–Wallis test for continuous variables with a skewed distribution. The χ 2 test was used to compare differences between groups for categorical variables. We calculated OR with 95 % CI for risk of hyperuricaemia by multivariable logistic regression model. Analyses were adjusted for age, sex, marital status, residence place (urban/rural), individual month income, family history of hyperuricaemia, regular exercise, current smoking, current drinking, BMI, hypertension, dyslipidaemia and diabetes. Interactions between famine exposure, sex, residence place, education, individual monthly income, family history of hyperuricaemia and overweight/obesity on hyperuricaemia were tested by adding multiplicative factors in the multivariable logistic regression model. A two-tailed P < 0·05 was considered as statistically significant. All statistical analyses were performed using SPSS 20.0 (SPSS).
Results
Of the total 9055 participants, 1501 men and 2257 women were exposed to the Chinese Famine in the current study. As shown in Table 1, 67·30 % men and 59·80 % women lived in rural areas and men were more likely to be a smoker or alcohol user than women. The mean values for age, SBP, DBP, uric acid, TAG and fasting plasma glucose were greater in men than those in women, whereas BMI, total cholesterol, HDL-cholesterol and 2-h plasma glucose values were greater in women than that in men.
Table 1. General characteristics of subjects in men and women
(Numbers and percentages; mean values and standard deviations)
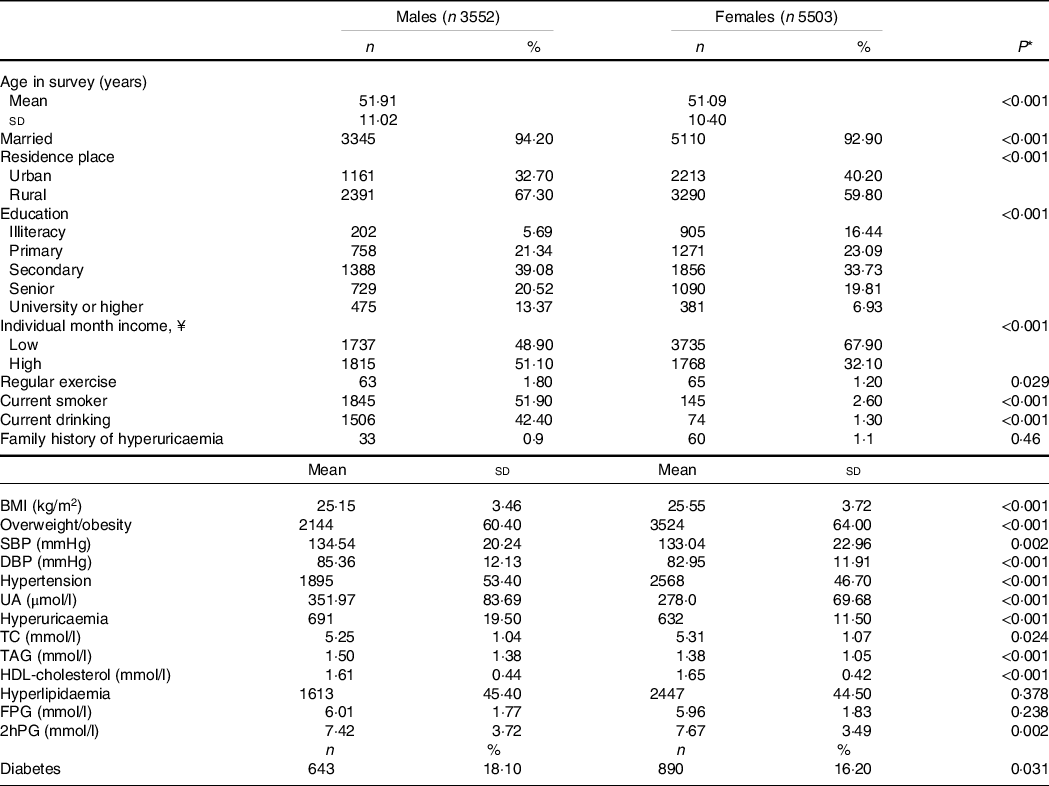
UA, uric acid; TC, total cholesterol; FPG, fasting plasma glucose; 2hPG, 2-h plasma glucose.
* P values in t tests for differences in means or χ 2 tests for differences in proportions between men and women.
Table 2 presents the characteristics of subjects in different Chinese famine-exposed groups. 1012, 2683 and 1602 subjects were exposed to famine during fetal/infant period, childhood and adolescence, respectively. The respective prevalence rates of hyperuricaemia in the unexposed, fetal/infant exposed, childhood exposed and adolescence exposed groups were 14·20 %, 13·10 %, 14·40 % and 16·90 %. Compared with the unexposed group, fetal/infant exposed, childhood exposed and adolescence exposed groups had higher BMI, DBP, total cholesterol, TAG, HDL-cholesterol, fasting plasma glucose and 2-h plasma glucose levels and were more likely to suffer from overweight/obesity, hyperlipidaemia, hypertension and diabetes.
Table 2. Characteristics of subjects according to the Chinese famine exposure
(Numbers and percentages; mean values and standard deviations)
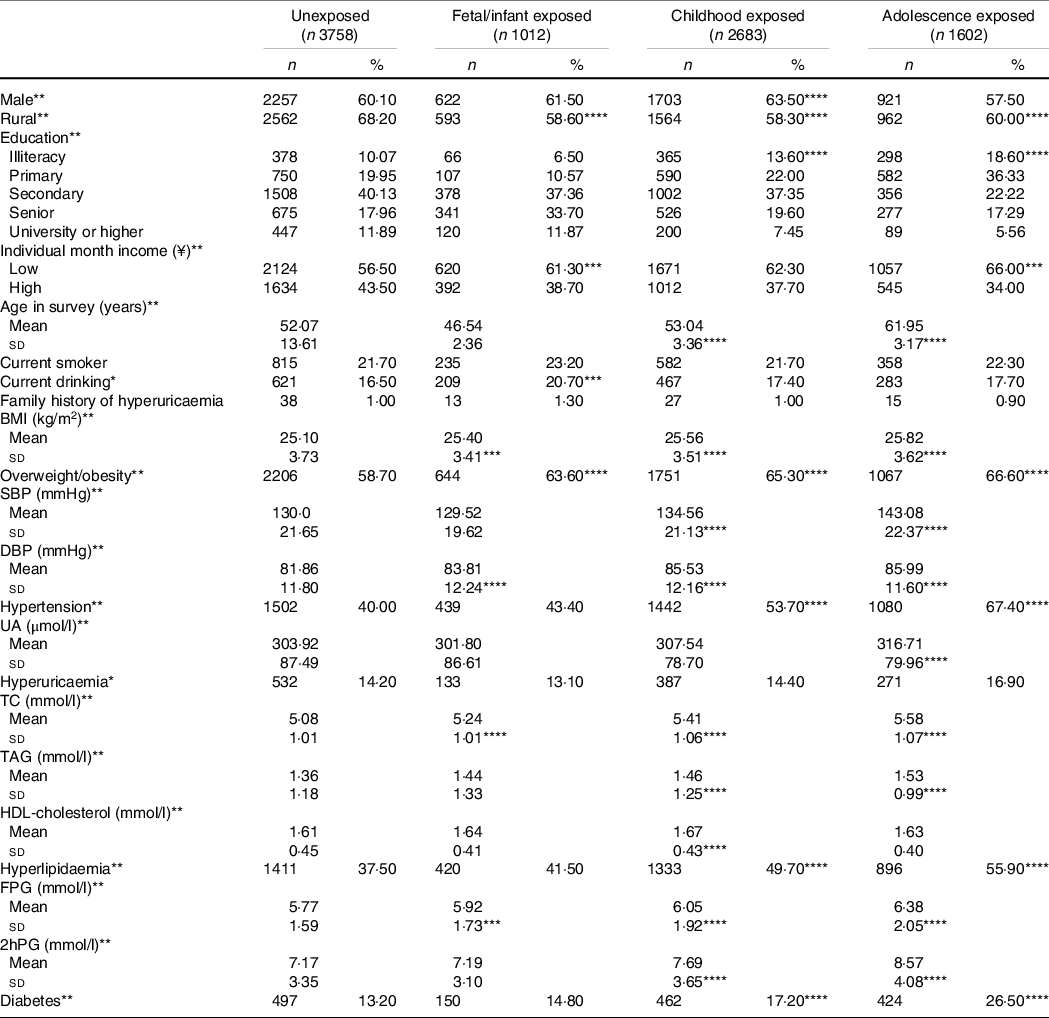
UA, uric acid; TC, total cholesterol.
The four different exposure groups were compared by ANOVA or the χ 2-test, as appropriate. *P < 0·05; **P < 0·01.
Famine-exposed and unexposed groups were compared by ANOVA or the χ 2-test, as appropriate, ***P < 0·05; ****P < 0·01.
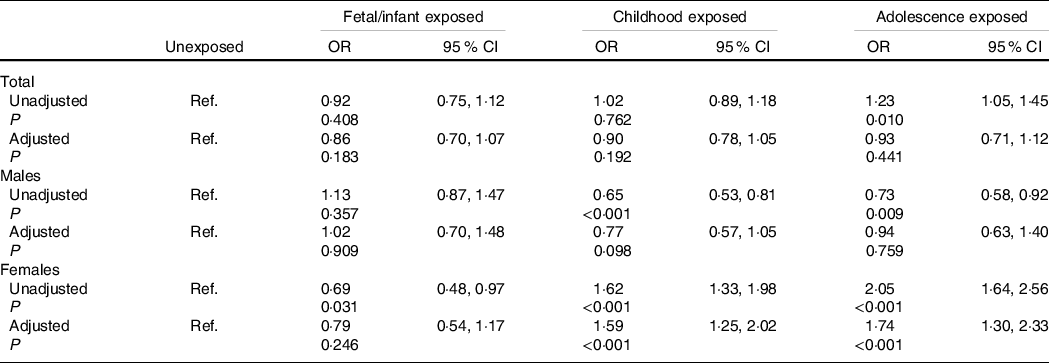
Associations of famine exposure in early life with adulthood hyperuricaemia stratified by sex are shown in Table 3. For all subjects, famine exposure in the fetal/infant period, childhood and adolescence was not associated with adulthood hyperuricaemia after adjustment for age, sex, marital status, residence place, individual month income, family history of hyperuricaemia, regular exercise, current smoking, current drinking, BMI, hypertension, dyslipidaemia and diabetes (all P > 0·05). In females, after adjustment for age, marital status, residence place, individual month income, family history of hyperuricaemia, regular exercise, current smoking, current drinking, BMI, hypertension, dyslipidaemia and diabetes, childhood exposed group (OR = 1·59, 95 % CI 1·25, 2·02) and adolescence exposed group (OR = 1·74, 95 % CI 1·30, 2·33) had higher risks to have hyperuricaemia in adult, but no significant relation was found in the fetal/infant exposed group. This association was not significant for all the three exposed groups in males. Additionally, no significant interactions between sex, residence place, education, individual month income, family history of hyperuricaemia, overweight/obesity and famine exposure on hyperuricaemia were observed for both males and females (all P interaction > 0·05).
Table 3. Associations of famine exposure in early life with hyperuricaemia in adulthood according to sex
(Odds ratio and 95 % confidence intervals)
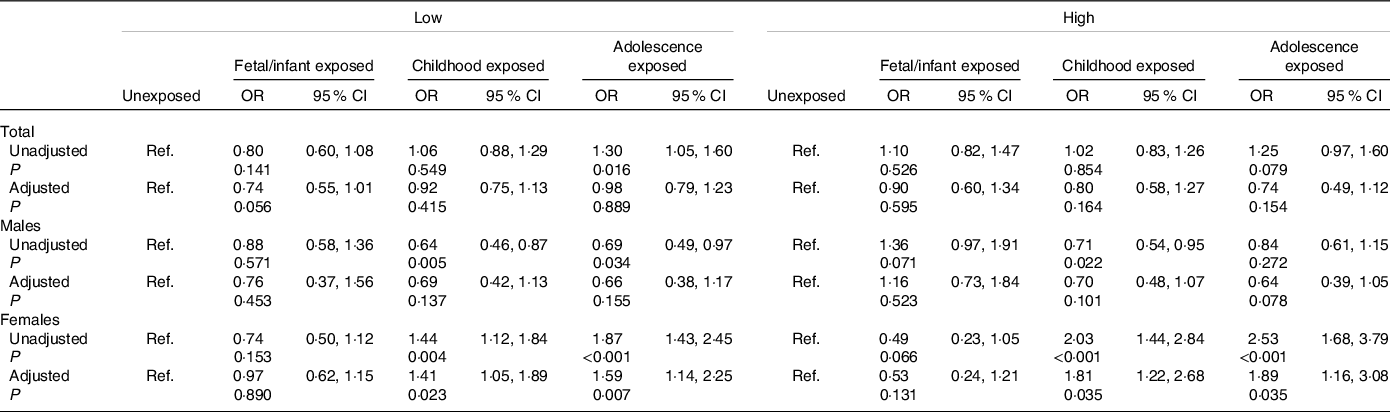
Associations of famine exposure with hyperuricaemia according to individual month income are shown in Table 4. The OR were significantly higher in childhood exposed group (OR = 1·41,95 % CI 1·05, 1·89) and adolescence exposed group (OR = 1·59, 95 % CI 1·14, 2·25) than the unexposed among female subjects with low individual month income after adjustment for age, marital status, residence place, family history of hyperuricaemia, regular exercise, current smoking, current drinking, BMI, hypertension, dyslipidaemia and diabetes, and similar results were also found among subjects with high individual month income (both P < 0·05). However, we did not observe significant association between fetal/infant exposure and later hyperuricaemia in both low and high individual month income groups (both P > 0·05).
Table 4. Association of famine exposure with hyperuricaemia according to individual month income
(Odds ratio and 95 % confidence intervals)
Discussion
Overall, we did not find a link between exposure to famine early in life and the increased risk of hyperuricaemia in adulthood. However, after stratification by sex, we found a significant relationship between childhood and adolescence famine exposure with hyperuricaemia in adult women but this significant difference was not present in fetal/infant exposed group and in men.
To our knowledge, this is the first study to reveal the impact of adolescence famine exposure on hyperuricaemia in adulthood though two studies had reported the relation of fetal famine exposure and childhood famine exposure to later-life hyperuricaemia. One study found that fetal famine exposure was associated with an increased risk of hyperuricaemia in adulthood, but the significant result was not obtained in the early childhood exposed(Reference Zhang and Luan23). Another study reported that in subjects with low economic status, early-life famine exposure was negatively associated with hyperuricaemia, while in subjects with high economic status, the associations were positive(Reference Wang, Weng and Wan24). However, we found that childhood and adolescence famine exposure were positively correlated with hyperuricaemia in adult women both in high and low economic status groups, but there was no relation between fetal/infant famine exposure and hyperuricaemia in adulthood neither in men nor in women. The discrepancy might be due to differences in design, like age differences between control group and exposure groups, the way to define different exposed groups and sampling methods of subjects. Additionally, subjects of Wang’s study were divided into low- or high-income brackets based on the gross domestic product of their enrolment site, while participants were categorised according to their personal income in our study; therefore, the results of our study could reflect real economic status(Reference Wang, Weng and Wan24).
Studies that stratified samples by sex mostly found more pronounced impacts of famine on women than on men. In the current study, we also found significant associations only in women. This sex difference has two possible reasons. First, the son preference might interpret better health outcomes for adult males. In Chinese traditional cultures, sons were preferred and valued much more than daughters, which could cause unequal distribution of food. Under this circumstance, males were sufficiently nourished when exposed to famine, while females were more likely to suffer from food shortage(Reference Coale and Banister35). Second, survivor bias was another possible reason leading to sex disparity. Male mortality was greater than female mortality during famine; thus, the survived males might be healthier than females. Furthermore, because of biological differences between males and females, such as differences in coping with stressful life events or differences in social protection, females are experiencing more stress during life and their health appears to be more influenced by early-life conditions than male health(Reference Koistinen, Koivisto and Karonen36–Reference Hamil-Luker and O’Rand39).
The significant associations were only observed in childhood and adolescence exposed groups in females but not in the fetal/infant exposed group. This may be because of different sensitiveness on stress of famine. Individuals exposed to famine during childhood and adolescence are more sensitive to stress conditions than those exposed to famine in fetal/infant period; therefore, they are more likely to suffering from hyperuricaemia in later life(Reference Portrait, Teeuwiszen and Deeg40).
Our findings of higher prevalence of overweight/obesity in the exposed groups and in females seem to imply accelerated growth may be a pathway between early-life malnutrition and later hyperuricaemia. Nevertheless, the relation of famine exposure during childhood and adolescence to hyperuricaemia in adulthood in females remained unchanged after adjustment for BMI and other confounding factors, suggesting that overweight/obesity might not be a mediator for the link(Reference Zhang and Luan23).
The mechanism of hyperuricaemia in adulthood caused by malnutrition in early life is not clear. The ‘fetal origin of adult disease’ hypothesis proposed that stress during the critical growth stages promoted adaptations in body structure and function, such as establishing a thrifty phenotype(Reference Sallout and Walker41). Malnutrition, as a kind of stressor, affects the development of less critical organs (e.g. pancreas, liver, kidney) to protect more critical organs such as the brain. Individuals who experienced malnutrition might have impaired kidney function with a decline of uric acid excretion in later life(Reference Wang, Weng and Wan24). Another probable mechanism might be attributed to early-life programming of the hypothalamic–pituitary–adrenal axis(Reference Reynolds42). Malnutrition actives the hypothalamic–pituitary–adrenal axis, following an increase of glucocorticoids(Reference Breton43,Reference Kongsted, Husted and Thygesen44) . Glucocorticoids could promote p38 mitogen-activated protein kinases phosphorylation in adipose tissue, and then phosphorylated p38 mitogen-activated protein kinases activates the transcriptional activity of CCAAT/enhancer binding protein beta. Activated CCAAT/enhancer binding protein beta combines with xanthine oxidoreductase promoter to promote xanthine oxidoreductase expression, resulting in an increase of xanthine oxidase. Increased xanthine oxidase could catalyse hypoxanthine to xanthine, which in turn generates excess uric acid(Reference Ma45). Furthermore, famine exposure in early life may be related to impaired nephrogenesis(Reference Luyckx and Brenner16,Reference Huang, Guo and Nichols46) . Early-life malnutrition is associated with developmental disruption in Notch signalling pathway, an important pathway in nephron formation, which will cause a decrease of renal nephron numbers(Reference Hughson, Farris and Douglas-Denton17). The alteration of renal structure and function could result in underexcretion of uric acid, thus leading to the development of later-life hyperuricaemia(Reference Murphy and Shipman18,Reference Lennox and O’Connor47) . Animal studies have proved less number of nephrons were linked to renal dysfunction in later life(Reference Stelloh, Allen and Mattson48,Reference Luyckx and Brenner49) .
Strengths and limitations
Our study has several strengths. First, we analysed the relation of adolescence famine exposure to hyperuricaemia that previous studies ignored. Second, we used a stratified and random cluster sampling method to recruit a representative sample from the general population. Third, all interviews were conducted face to face by trained doctors or nurses, and blood samples were sent to the laboratory immediately after being centrifuged on site, which ensured rigorous quality control for the survey. Additionally, we combined individuals born before and after famine as the unexposed subjects in order to eliminate the influence of age on hyperuricaemia. However, some limitations should be noticed. First, the cross-sectional study design could not allow causal relation between early-life famine exposure and adulthood hyperuricaemia risk. Second, as one of the most disastrous catastrophes in human history, the Chinese famine almost affected the entire country(Reference Huang, Guo and Nichols46,Reference Justin Yifu and Yang50) , thus, subjects in the current study had to be divided into different groups according to age at exposure. Last, because definite dates of beginning and ending of Chinese famine are not available, there may be misclassification in our study.
Conclusion
We found that exposure to the Chinese famine in childhood and adolescence was associated with higher risks of hyperuricaemia in adult females. This study indicated that nutrition status of childhood and adolescence has a long-term effect on later life. Females who have experienced undernutrition in childhood and adolescence need to be considered as high-risk members of adulthood hyperuricaemia. Measures should be taken to prevent undernutrition during childhood and adolescence to prevent later hyperuricaemia, especially for females.
Acknowledgements
We thank all the participants and team members who took part in the surveys. We sincerely thank the financial supports from the World Diabetes Foundation. We are grateful to the Qingdao Municipal Health Bureau, Qingdao Endocrine and Diabetes Hospital and Qingdao Centers for Disease Control and Prevention, Qingdao, China for their contribution to the field survey. Dr. Liu also received grants supported by Qingdao Outstanding Health Professional Development Fund, Qingdao Health Science and Technology Plan Project.
This work was supported by grants from the World Diabetes Foundation (WDF05-108&07-308), Qingdao Outstanding Health Professional Development Fund, Qingdao Health Science and Technology Plan Project (2019-WJZD157).
Y. S., L. L. and X. L. contributed to the manuscript composition, quality assessment and records review. Y. S., L. L., X. L. and X. H. designed the paper and analysed the data. Y. S. and X. H. were responsible for the integrity of this work and contributed to final study selection and manuscript review. J. S. coordinated the data acquisition and standardisation. All authors reviewed and approved the final manuscript.
The authors declared no conflicts of interest.
Supplementary material
For supplementary material referred to in this article, please visit https://doi.org/10.1017/S0007114521002749


