


Overweight and obesity can be understood as ‘a disorder of energy balance, arising from consuming calories in excess to the energy expended to maintain life and perform physical work’(Reference Hall and Guo1). Findings from the Health Survey for England revealed that 64 % of adults were classified as overweight or obese, respectively, an increase of 11 % in less than three decades(2).
Paradoxically, this increasing prevalence of obesity coincides with a rise in weight-loss attempts(Reference Montani, Schutz and Dulloo3). Findings from the 2003–2008 National Health and Nutrition Examination Survey (NHANES) revealed that 57 and 40 % of US women and men, respectively, were actively dieting, 10–15 % higher than the 1990s(Reference Yaemsiri, Slining and Agarwal4). A systematic review, including over one million adults worldwide, estimated the prevalence of personal weight control attempts and revealed that 42 % of the general adult population attempted to lose weight in the preceding 5 years(Reference Santos, Sniehotta and Marques5). As anticipated, the highest prevalence was observed in overweight and obese populations, particularly in women, with improved wellbeing, enhanced self-esteem, improved appearance and social pressures identified as common motives. While weight-loss was predominantly achieved through energy restriction or physical activity, others sought to improve diet quality or restrict dietary intake. A small proportion of individuals reported the use of weight-loss aids such as laxatives and diuretics or extreme strategies such as fasting or purging(Reference Santos, Sniehotta and Marques5).
Very low-energy diets and low-energy diets are clinically approved weight-loss interventions that induce weight-loss through prescribed intakes of approximately 3347⋅2 kJ (800 kcal) and 5020⋅8 kJ (1200 kcal), respectively. The larger energy deficit induced by very low-energy diets results in significantly greater weight-loss than low-energy diets(Reference Seimon, Wild-Taylor and Keating6–Reference Tsai and Wadden8), with additional benefits in the treatment of diabetes(Reference Lean, Leslie and Barnes9). Another popular mode of energy restriction is through ‘fad diets’. The British Dietetics Association(10) defines a fad diet as a very restrictive diet involving few foods or an unusual combination of foods for a short period of time, often losing weight very quickly. Such diets often restrict energy consumption through exclusion of food types, macronutrients or feeding times, with claims of drastic weight-loss and health benefits(Reference Bryngelsson and Asp11). A recent review of popular fad diets suggested that juicing diets, the paleo diet and intermittent fasting were among those most popular(Reference Obert, Pearlman and Obert12). However, when compared to isoenergetic interventions, fad diets produce comparable results, suggesting that weight-loss is determined predominantly by energy deficit rather than diet composition or meal timings, etc.
The simultaneous rise in weight-loss attempts and obesity prevalence is indicative of the observation that dieting does not necessarily induce long-term sustainable weight-loss. With large interindividual variability in observed weight-loss outcomes, an individual's physiological response to energy restriction must be considered in order to determine the success of a weight-loss intervention.
A basic understanding of energy balance
Energy, measured in joules (J) is defined as the capacity to do work(Reference Lutz, Mazur and Litch13). The concept of energy balance is based on the first law of thermodynamics, stating that energy can be neither created nor destroyed, but only converted from one form to another(Reference Buchholz and Schoeller14). To maintain equilibrium and optimum physiological function, the human body continually expends energy by oxidative metabolism where the chemical energy of food is converted to heat, a process referred to as thermogenesis(Reference Schutz, Allen and Prentice15,Reference Ho16) . The body is in a state of energy balance when energy intake (EI) is equal to energy expenditure (EE). Moreover, at energy balance, the total amount of energy contained in the body as glycogen, fat and protein remains unaltered(Reference Schutz, Allen and Prentice15) and an individual maintains a stable weight(Reference Lutz, Mazur and Litch13). In a state of negative energy balance, where EE exceeds EI, the body utilises its energy stores (fat, glycogen and protein) resulting in weight-loss. Conversely, in a state of positive energy balance, where EI exceeds EE, the body increases its energy stores (glycogen acutely, but primarily as fat) resulting in weight-gain(Reference Schutz, Allen and Prentice15). Originally viewed as a static concept, it was assumed that one side of the energy balance equation does not change or influence the other side of the equation, i.e. no coupling of EI and EE.
Energy intake
The macronutrients, i.e. carbohydrate, protein and fat in addition to alcohol, yield energy. The energy content of food was traditionally measured using a bomb calorimeter by calculating total heat liberated under combustion. The result of which is referred to as gross energy value, a value that varies among the macronutrients(Reference Schutz, Allen and Prentice15). However, not all ingested food is completely absorbed, with approximately 5–10 % of gross energy lost as faecal matter and through urinary excretion. The remaining ‘metabolisable energy’ (ME), expressed per gram of dietary substrate, is available for use by the body(Reference Schutz, Allen and Prentice15). The metabolisable energy of carbohydrate, protein, fat and alcohol is 17 kJ/g (4 kcal/g), 17 kJ/g (4 kcal/g), 37 kJ/g (9 kcal/g) and 29 kJ/g (7 kcal/g), respectively(Reference Atwater and Woods17), with an additional energy factor of 8⋅0 kJ/g (2 kcal/g) for dietary fibre(18).
Energy expenditure
Total energy expenditure (TEE) can be split into three conventional components;
1. Resting energy expenditure (REE)
2. Diet-induced thermogenesis (DIT)
3. Physical activity energy expenditure (PAEE) – of which there are two subcategories
a) Exercise activity thermogenesis (EAT)
b) Non-exercise activity thermogenesis (NEAT)
REE refers to the energy required by the body in a resting condition(Reference McMurray, Soares and Caspersen19), i.e. the ‘metabolic cost of processes such as the maintenance of transmembrane ion gradients and resting cardiopulmonary activity’ (Reference Leibel, Rosenbaum and Hirsch20). It is measured under standardised conditions, when the individual is awake, at rest, lying in a supine position and in a thermo-neutral environment(Reference Schutz, Allen and Prentice15). While REE and BMR are often used interchangeably, REE is more routinely used in research and practice. It is measured exclusively in a post-absorptive state, typically 10–12 h after the last meal and at normal room temperature(Reference Schutz, Allen and Prentice15). REE represents the largest component of TEE, contributing approximately 60–70 % of TEE(Reference Ho16,Reference Leibel, Rosenbaum and Hirsch20) .
DIT refers to the energy required by the body in the post-prandial period, representing the energy cost of digestion, absorption, transport and storage of dietary nutrients(Reference Ho16,Reference Westerterp21) . It is calculated by dividing the increase in EE above basal fasting level by the energy content of the food ingested(Reference Westerterp21). Although DIT is a product of EI, it belongs as a component of TEE, equivalent to approximately 5–15 % of total energy consumption, assuming an individual is at or near energy balance(Reference Ho16,Reference Westerterp21) .
Finally, PAEE refers to the additional energy required by the body for movements produced by the skeletal muscle(Reference Westerterp22). It is subdivided into EAT and NEAT, with EAT representing energy expended through intentional moderate-vigorous exercise, and NEAT representing energy expended as a consequence of daily living and vocation, including low-intensity daily activities above rest (e.g. sitting, standing and walking) and more subtle spontaneous physical activities such as fidgeting(Reference Chung, Park and Kim23). There is no gold standard for measuring PAEE, with estimates often derived from TEE and REE, or expressed as a factor of BMR or REE, e.g. using physical activity level index(Reference Hills, Mokhtar and Byrne24). Nevertheless, PAEE is by far the most variable component of TEE, both within and between individuals(Reference Chung, Park and Kim23) typically contributing between 15 and 40 % of TEE(Reference Schutz, Allen and Prentice15,Reference Butte, Ekelund and Westerterp25,Reference Westerterp26) .
Refining our understanding of energy balance
Factors determining obligatory energy expenditure
Body composition is the primary determinant of REE, explaining 60–90 % of the inter-individual variability(Reference Hall and Guo1,Reference Nielsen, Hensrud and Romanski27,Reference Illner, Brinkmann and Heller28) . Elia(Reference Elia, Kinney and Tucker29) measured the specific REE of different body tissues, referred to as Ki values (expressed as kcal/kg daily). Fat-free mass (FFM) has a significantly higher metabolic rate than fat mass (FM). While metabolic organs and skeletal muscle have Ki values of 200–400 and 13, respectively, adipose tissue has a Ki value of 4⋅5(Reference Wang, Ying and Bosy-Westphal30). Therefore, an individual with a greater proportion of FFM (comprising muscle and organs) will have a higher REE than height- and weight-matched individuals with a greater proportion of FM. Accordingly, REE is also determined by body size, with a larger body size indicating more metabolically active tissue and higher energy requirements than a smaller body size, despite the same proportional body composition(Reference Hills, Mokhtar and Byrne24).
Sex differences in REE are mainly attributed to differences in body composition. Females generally have approximately 10–15 % higher body fat(Reference Elia, Kinney and Tucker29,Reference Schorr, Dichtel and Gerweck31–Reference Jackson, Stanforth and Gagnon33) and 5–10 % lower REE than BMI-matched males(Reference Hills, Mokhtar and Byrne24). Such differences in body composition are suggested to be influenced by sex hormones with oestrogen reducing lipid oxidation and promoting fat deposition in females(Reference Brown and Clegg34–Reference O'Sullivan, Crampton and Freund36) and testosterone promoting muscle protein synthesis in males(Reference Griggs, Kingston and Jozefowicz37,Reference Sheffield-Moore38) .
Nevertheless, in both males and females REE has been reported to decrease by 1–2 % per decade(Reference Elia, Ritz and Stubbs39,Reference Molnar and Schutz40) , due to age-related decreases in FFM(Reference Geisler, Braun and Pourhassan41) and increases in overall adiposity(Reference Jura and Kozak42,Reference Karastergiou, Smith and Greenberg43) . Short et al.(Reference Short, Vittone and Bigelow44) reported that skeletal muscle contributes only 25 % of total weight in 75–80-year-old adults as opposed to 50 % in young adults. This decline in FFM, however, is determined by changes in sex hormones. Males reach peak FFM at 31–40 years, followed by a rapid decrease due to significant declines in testosterone(Reference Bredella and Mauvais-Jarvis45). In contrast, females start losing FFM 10 years later than males, and to a lesser degree, possibly due to protective anti-inflammatory effects of oestrogen that do not attenuate until the onset of menopause(Reference Hills, Mokhtar and Byrne24).
While body composition accounts for the most observed variation in REE, research suggests that residual variability may be explained by differences in the amount and distribution of organ tissue, which range in metabolic activity (836⋅8 kJ/kg (200 kcal/kg) daily for liver, 1004⋅16 kJ/kg (240 kcal/kg) daily for brain and 1840⋅96 kJ/kg (440 kcal/kg) daily for heart and kidneys)(Reference Elia, Kinney and Tucker29,Reference Gallagher, Belmonte and Deurenberg46,Reference Garby and Lammert47) . Despite accounting for <6 % of total weight(Reference Elia, Kinney and Tucker29), metabolic organs contribute 60–80 % of REE(Reference Heymsfield, Gallagher and Kotler48,Reference Gallagher, Visser and Wang49) , meaning even small variations among individuals may influence REE.
Whilst energy content of food is the primary determinant of the obligatory energy cost of DIT, values are specific to each macronutrient due to differing ATP requirements for the initial steps of metabolism and storage(Reference Westerterp21). As a consequence, macronutrient composition also determines DIT. Fat has the lowest DIT value estimated between 0 and 3 % of ingested intake, followed by carbohydrate with a value of 5–10 %. Protein has the highest DIT value estimated between 20 and 30 %, in addition to alcohol with a value of 10–30 %(Reference Westerterp21). In healthy-weight individuals, in energy balance and consuming a mixed diet, DIT accounts for approximately 10 % of energy ingested over 24 h(Reference Westerterp21).
There is currently limited evidence suggesting an association between obesity and DIT. Early research by Wang et al.(Reference Wang, Strouse and Saunders50) identified lower DIT in obese subjects compared to lean subjects. This is consistent with findings from a critical review by De Jonge and Bray(Reference De Jonge and Bray51) where 22/29 studies reported a significantly reduced DIT in obese subjects, associated with insulin resistance and reduced postprandial sympathetic response(Reference De Jonge and Bray51,Reference Weststrate52) .
Some studies report that DIT normalises in weight-reduced subjects(Reference Schwartz, Halter and Bierman53,Reference Thorne, Naslund and Wahren54) , suggesting reduced postprandial response is a consequence rather than a cause of obesity. However, others report that DIT remained suppressed in weight-reduced subjects, suggesting that reduced postprandial response contributes to the development of obesity(Reference Bessard, Schutz and Jéquier55–Reference Schutz, Golay and Felber57). However, several studies report no association between obesity and DIT(Reference Granata and Brandon58). Such association is further confounded by variation in methodology, energy and macronutrient content of test foods, duration of the postprandial periods and inaccuracy calculating DIT from REE and PAEE(Reference Westerterp21,Reference Granata and Brandon58) . Currently, while reduced postprandial response in obesity seems plausible, further standardisation and validation of experimental protocol is needed to reach a consensus.
For PAEE, both EAT and NEAT are determined by the metabolic cost and the frequency of body movement, both of which are largely influenced by bodyweight. In turn, larger individuals have a higher energy cost of movement compared to smaller individuals, however they can also be behaviourally less active(Reference Westerterp22,Reference Westerterp59,Reference Schoeller and Jefford60) . Other suggested determinants of PAEE include age, exercise training, genetics, EI and disease(Reference Westerterp22).
Assumption of current weight-loss strategies
Clinical weight-loss prescriptions assume that 14644 kJ (3500 kcal) is equivalent to 1 pound of fat (or about 32⋅5 MJ is equivalent to 1 kg)(Reference Thomas, Gonzalez and Pereira61) translating into advice that a 2092 kJ (500 kcal) deficit daily will result in 1 pound (lb) weight-loss per week. The ‘3500 kcal (14644 kJ) rule’ is based on the findings of researcher Max Wishnofsky who reported that 1 lb of fat stores approximately 3500 kcal (14⋅6 MJ) of energy(Reference Wishnofsky62). This observation rests on the assumption that weight-loss is composed of 25 % FFM and 75 % FM(Reference Burckhardt, Dawson-Hughes and Weaver63), a concept based on observations from the Minnesota starvation experiment(Reference Keys, Brozek and Henschel64). Further simplified assumptions assume FFM consists of about 75 % water (0 kJ/g (0 kcal/g)) and about 25 % protein (16⋅74 kJ/g (4 kcal/g)), meaning 1 g of FFM stores 4⋅184 kJ (1 kcal) of energy, while FM consists of 100 % fat (37⋅66 kJ/g (9 kcal/g)), meaning 1 g of FM stores 37⋅66 kJ (9 kcal) of energy(Reference Atwater and Bryant65). Based on this assumption, 1 g of total weight-loss is equivalent to 29⋅29 kJ (7 kcal), hence 1 kg is equivalent to 29288 kJ (7000 kcal) and 0⋅5 kg is equivalent to 14644 kJ (3500 kcal).
However, this approach assumes the composition of weight lost as FM and FFM is fixed and remains constant throughout the period of dynamic weight loss. Additionally, it disregards dynamic changes in EE observed when the body is in a negative energy balance, resulting in the significant overprediction of weight-loss(Reference Thomas, Gonzalez and Pereira61). Despite recognised as over-simplistic, the 3500 kcal (14644 kJ) rule continues to appear in scientific literature and has been cited in over 35 000 educational weight-loss websites(Reference Thomas, Martin and Lettieri66). It is observed in recommendations by the National Health Services(67), British Dietetics Association(68), National Institutes of Health(69) and American Dietetic Association(Reference Seagle, Strain and Makris70). By way of illustration, Lin et al.(Reference Lin, Smith and Lee71) demonstrated the bias of the 3500 kcal (14644 kJ) rule in the development of population obesity intervention strategies, where static modelling overestimated weight-loss associated with the sugar-sweetened beverages tax by 63, 346 and 764 % at year one, five and ten, respectively.
Popular models of weight-loss
Influence of behaviour
Traditionally, weight-loss is viewed simply as a product of energy deficit, i.e. the discrepancy between energy in and energy out, where EI and EE are independent variables driven purely by behaviour. This model considers EE to be a fixed value, where a sustained energy deficit (through simply ‘eating less’ and/or ‘moving more’) will produce weight-loss at a constant rate resulting in infinite weight-loss, which we know to be physiologically impossible. This view has been referred to as a static model of weight-loss (Reference Hall and Guo1), which disregards changes in EE observed in response to underfeeding. Such a model provides an overly simplistic view of energy balance and a significant over-estimation of weight-loss(Reference Thomas, Martin and Lettieri66,Reference Hall, Sacks and Chandramohan72) .
Influence of body composition
While weight-loss is a product of energy deficit, there is some recognition that EE is not constant, but rather a product of body composition. This model considers the loss of metabolically active tissue as a consequence of weight-loss, resulting in an obligatory decrease in EE, albeit EI remaining an independent variable. This view has been referred to as a settling point model of weight-loss (Reference Hall and Guo1,Reference Speakman, Levitsky and Allison73) , where an individual in energy deficit will reach a natural equilibrium at a lower weight despite a sustained energy deficit, at a point where a new energy balance is determined by the reduced EE.
Influence of biology
In more recent years, the influence of homeostatic control has been recognised, where the body employs physiological mechanisms that manipulate energy balance to maintain weight at a genetically and environmentally determined set-point. This model considers weight-loss to be regulated by adaptive changes in both EI and EE, which are functionally interdependent.
This view has been referred to as a set point model of weight-loss, based on the principle of the set-point theory, which assumes that the human body has a genetically pre-determined body fat content for optimal function that is protected by biological mechanisms within the brain stem and hypothalamus(Reference Muller, Geisler and Heymsfield74). Accordingly, weight will decrease exponentially and reach an equilibrium despite a sustained energy deficit. First suggested by Kennedy in 1953(Reference Kennedy75), the model has been widely adopted, and strengthened particularly after the discovery of leptin in the 1990s(Reference Hall and Guo1,Reference Speakman, Levitsky and Allison73,Reference Camps and Verhoef76) .
Response to weight-loss and drivers of weight maintenance
Weight-loss is induced by an imbalance between EI and EE. However, the components of energy balance do not function independently, but rather dynamically interact with each other to preserve energy homeostasis. Hence, several obligatory changes and metabolic adaptations are observed during periods of energy imbalance, resisting weight change (Table 1). This supports the notion that unsuccessful weight-loss or regain can be caused by more than behaviourally driven sloth or gluttony.
Table 1. Summary of obligatory and adaptive changes in energy expenditure

DIT, diet-induced thermogenesis; EAT, exercise activity thermogenesis; NEAT, non-exercise activity thermogenesis; REE, resting energy expenditure.
Obligatory changes in energy expenditure
Foremost, the weight-loss-induced decline in REE is primarily due to loss of metabolically active tissue, i.e. skeletal muscle(Reference Muller, Enderle and Bosy-Westphal77), which expends approximately 54⋅4 kJ/kg (13 kcal/kg) daily(Reference Wang, Ying and Bosy-Westphal30). This obligatory decrease in EE represents that considered in a settling point model of weight-loss, by which energy deficit decreases as weight decreases, resulting in a new energy balance at a lower bodyweight.
The widely cited quarter FFM rule(Reference Heymsfield, Cristina Gonzalez and Shen78) states that FFM, i.e. glycogen, protein and water accounts for 25 % of total weight-loss while FM accounts for the remaining 75 %. Despite having ‘limited mechanistic basis’(Reference Heymsfield, Cristina Gonzalez and Shen78), the quarter FFM rule is considered the best approximation of body composition changes in response to underfeeding. However, this rule still incorrectly assumes that the proportion of weight lost as FM and FFM is constant between individuals and during weight-loss.
Early findings from Grande and Henschel(Reference Grande and Henschel79) revealed that the composition of weight-loss differs in the early and late stages of energy restriction, with early weight-loss composed of predominantly water (70 %), some fat (25 %) and little protein (5 %), and later weight-loss composed of predominantly fat (85 %), some protein (15 %) and no water (0 %). The Minnesota starvation experiment(Reference Keys, Brozek and Henschel64) reported similar findings, where weight-loss was composed of about 40 % FM in weeks 1–12, increasing to about 70 % in weeks 12–24.
The rapid rate of early weight-loss is largely attributed to water and glycogen(Reference Heymsfield, Thomas and Nguyen80). Liver and skeletal muscle glycogen stores are mobilised into circulation by glycogenolysis to provide short-term energy when external energy sources, i.e. food, cannot meet demands(Reference Heymsfield, Thomas and Nguyen80–Reference Rui83). Glycogen is stored in a hydrated form, with each gram stored with 3–4 g of water(Reference Kreitzman, Coxon and Szaz84). Once mobilised, the associated water is excreted in urine(Reference Murray and Rosenbloom85). However, glycogen stores are largely depleted within a week of even moderate energy restriction(Reference Heymsfield, Thomas and Nguyen80).
Before complete depletion of body glycogen stores, there is a shift from glucose oxidation to fatty acid oxidation. Ketone bodies are used as a glucose substitute through conversion from a surplus of fatty acid-derived acetyl CoA in the liver via ketogenesis(Reference Rui83). Amino acids are also used as a glucose source for the brain and peripheral tissues through hydrolysis of skeletal muscle and conversion to glucose in the liver, via gluconeogenesis(Reference Heymsfield, Thomas and Nguyen80,Reference Rui83,Reference Kerndt, Naughton and Driscoll86,Reference Berg, Tymoczko and Stryer87) . However, increasing availability of ketone bodies during prolonged and significant underfeeding lessens the demand for amino acids, therefore the proportion of weight lost as metabolically active tissue often assumes this lower stable level for the duration of dieting period(Reference Heymsfield, Cristina Gonzalez and Shen78,Reference Forbes and Drenick88) . The composition of weight lost as FM and FFM can be influenced further by the degree of energy restriction, protein intake, magnitude of weight-loss, baseline adiposity and physical activity level(Reference Heymsfield, Thomas and Nguyen80).
Alongside obligatory changes in REE due to loss of FFM, obligatory decreases in DIT are observed in response to underfeeding due to reduced EI, as less energy is required in the ingestion, digestion, absorption, metabolism, transport and storage of food and nutrients(Reference Trexler, Smith-Ryan and Norton89). Assuming a healthy mixed diet, a 2092 kJ (500 kcal) energy deficit would reduce TEE by about 104⋅6–313⋅8 kJ/d (25–75 kcal/d).
Finally, an obligatory decrease in PAEE is also observed in response to underfeeding, in both EAT and NEAT compartments, which is proportional to overall weight-loss(Reference Trexler, Smith-Ryan and Norton89). This is due to a reduced metabolic cost of movement (i.e. a reduction in ‘ballast’), where 5 % weight-loss has been associated with a 393⋅3 kJ (94 kcal) daily reduction in PAEE(Reference Muller, Enderle and Pourhassan90).
Adaptive changes in energy expenditure
Energy restriction has been associated with a decline in REE, exceeding that explained by changes in body composition alone(Reference Jaime, Balich and Acevedo91). Weight-loss studies have shown that the magnitude of fat stores in the body is protected by mechanisms mediated by the central nervous system, which adjust EI and EE through signals from adipose tissue, the gastrointestinal tract and endocrine tissue to maintain homeostasis and resist weight change(Reference Rosenbaum and Leibel92). The body's protective metabolic mechanism that attempts to preserve energy stores whilst in energy crisis is known as adaptive thermogenesis (AT). AT is defined as the underfeeding-associated fall in REE independent of changes in FFM and FM(Reference Muller, Enderle and Pourhassan90,Reference Dulloo and Jacquet93) . This definition is based on findings from the Minnesota starvation experiment(Reference Keys, Brozek and Henschel64), where a 50 % energy restriction was associated with a 39 % or about 2510⋅4 kJ/d (600 kcal/d) decline in REE, 35 % (or about 836⋅8 kJ/d (200 kcal)) of which was independent of obligatory FFM loss(Reference Muller, Enderle and Pourhassan90). AT can be estimated by calculating the decrease in mass-adjusted REE in response to underfeeding, i.e. the difference between measured REE and predicted REE post-intervention(Reference Dulloo, Jacquet and Montani94). However, some studies have extended this definition to include DIT in response to both underfeeding(Reference Dulloo95,Reference Lowell and Spiegelman96) and overfeeding(Reference Lowell and Spiegelman96,Reference Tseng, Cypess and Kahn97) and cold-induced thermogenesis in response to changes in environmental temperature(Reference Lowell and Spiegelman96,Reference Tseng, Cypess and Kahn97) . The inconsistent definition of AT makes the quantification of metabolic adaptation challenging.
Research to date suggests that AT can explain half of the unsatisfactory weight-loss cases, where weight-loss was significantly less than that predicted by loss of FFM alone(Reference Goele, Bosy-Westphal and Rumcker98,Reference Byrne, Wood and Schutz99) . For example, a 10 % weight reduction has been associated with a 20–25 % reduction in TEE, 10–15 % beyond that predicted by changes in body composition(Reference Rosenbaum and Leibel92).
Cross-sectional studies have investigated AT by comparing formerly-obese subjects who had lost weight, with BMI-matched subjects who were never obese. A meta-analysis by Astrup et al.(Reference Astrup, Gøtzsche and van de Werken100) reported a 3–5 % lower REE in formerly-obese subjects compared to never-obese controls. However, several cross-sectional studies failed to detect AT(Reference Wyatt, Grunwald and Seagle101,Reference Weinsier, Hunter and Zuckerman102) , likely due to large inter-subject variability in body composition and REE(Reference Martins, Roekenes and Salamati103).
Longitudinal weight-loss studies have provided a more accurate method of investigating metabolic adaptation, where AT of clinical significance has been detected in both lean(Reference Keys, Brozek and Henschel64,Reference Muller, Enderle and Pourhassan90,Reference Weyer, Walford and Harper104) and overweight/obese subjects(Reference Leibel, Rosenbaum and Hirsch20,Reference Heilbronn, de Jonge and Frisard105,Reference Bosy-Westphal, Kossel and Goele106) . In most cases, 10–20 % weight-loss is associated with AT equivalent to 418⋅4–1255⋅2 kJ/d (100–300 kcal/d)(Reference Leibel, Rosenbaum and Hirsch20,Reference Keys, Brozek and Henschel64,Reference Muller and Bosy-Westphal107,Reference Doucet, St-Pierre and Alméras108) . Based on such evidence, a formerly-obese individual will theoretically require 418⋅4–1255⋅2 kJ (100–300 kcal) fewer daily for weight maintenance compared to never-obese individual of the same weight and body composition.
However, reductions as much as 2092 kJ/d (500 kcal/d) have been detected, suggesting large inter-individual variability. Such a case was observed in a weight-loss study at Laval University(Reference Tremblay, Major and Doucet109) where a woman adhering to a 2092 kJ/d (500 kcal/d) energy deficit for 15 weeks had a resultant weight gain of 2⋅1 kg, despite strict compliance and close nutritional support. This clinical paradox can be largely explained by indirect calorimetry measurements, which revealed a 552 kcal daily decrease in REE at the end of the weight-loss phase.
Nevertheless, there is inconsistent evidence regarding the onset of metabolic adaptation. Heinitz et al.(Reference Heinitz, Hollstein and Ando110) detected AT within a week of energy restriction, associated with the rapid declines in insulin secretion, depletion of glycogen stores and loss of intra- and extracellular fluid. This aligns to resultant alterations in glycolytic and oxidative activity reported to induce metabolic slowing, with the primary aim of ensuring the brain's energy needs are met(Reference Muller, Enderle and Bosy-Westphal77). Muller et al.(Reference Muller, Enderle and Pourhassan90) reported similar findings with metabolic adaptation detected after 3 d of energy restriction. The magnitude of the observed AT closely correlated with reductions in insulin secretion, changes in glucose oxidation, fluid balance and free water clearance rate(Reference Muller, Enderle and Pourhassan90).
In contrast, substantial evidence suggests that underfeeding-associated AT takes weeks to develop(Reference Dulloo, Seydoux and Jaquet111,Reference Cannon and Nedergaard112) and is associated with lower sympathetic nervous system activity, triiodothyronine and leptin(Reference Rosenbaum and Leibel92,Reference Muller and Bosy-Westphal107,Reference Rosenbaum, Goldsmith and Bloomfield113) . This delayed onset of metabolic adaptation is reported to be triggered by signals from depleted adipocytes with the primary aim of preserving TAG stores and preventing loss of basic biological function, e.g. reproduction(Reference Muller, Enderle and Bosy-Westphal77). Such findings support the possible existence of two components of AT, an immediate metabolic adaptation associated with decreased insulin and carbohydrate availability, and a delayed adaptation associated with decreased leptin secretion from depleted adipose tissue stores.
There is, however, conflicting evidence regarding the persistence of metabolic adaptation. While some research suggests that underfeeding-associated AT can be reversed within 2 weeks of refeeding or 4 weeks of weight stability at energy balance(Reference Leibel, Rosenbaum and Hirsch20,Reference Martins, Roekenes and Salamati103) , others report that the effects of AT are long-term, being still detectable 6 months to 1-year post-surgical(Reference Butte, Brandt and Wong114–Reference van Gemert, Westerterp and van Acker116) and diet-induced weight-loss(Reference Keys, Brozek and Henschel64,Reference Rosenbaum, Hirsch and Gallagher117) and even up to 6 years post weight-loss(Reference Fothergill, Guo and Howard118).
Mechanisms of adaptive thermogenesis
Skeletal muscle and brown adipose tissue have been identified as important sites of thermogenesis regulation(Reference Dulloo and Samec119) using uncoupling proteins, proton leakage and substrate cycling(Reference Norwack, Giroud and Arnold120) to alter EE in response to changes in the external environment.
Such mechanisms increase the body's capacity to dissipate energy, with an established role of brown adipose tissue and skeletal muscle in non-shivering(Reference Busiello, Savarese and Lombardi121,Reference Roesler and Kazak122) and shivering thermogenesis(Reference Roesler and Kazak122,Reference Haman and Blondin123) under conditions of chronic cold exposure.
Animal studies have also supported a role of brown adipose tissue thermoregulation as a means of energy dissipation in response to chronic overfeeding(Reference Rothwell and Stock124–Reference Feldmann, Golozoubova and Cannon126). However, these animal observations are not consistent with findings from short-term(Reference Schlogl, Piaggi and Thiyyagura127–Reference Vosselman, Brans and van der Lans129) or long-term human studies(Reference Peterson, Orooji and Johnson130), where no change in brown adipose tissue activity was observed after overfeeding, despite a greater-than-predicted increase in REE.
In human subjects, it has been proposed that underfeeding-associated AT is predominantly mediated by thrifty mechanisms specific to skeletal muscle which downregulate thermogenesis, particularly in response to signals from adipose tissue (Fig. 1)(Reference Dulloo, Jacquet and Seydoux131).
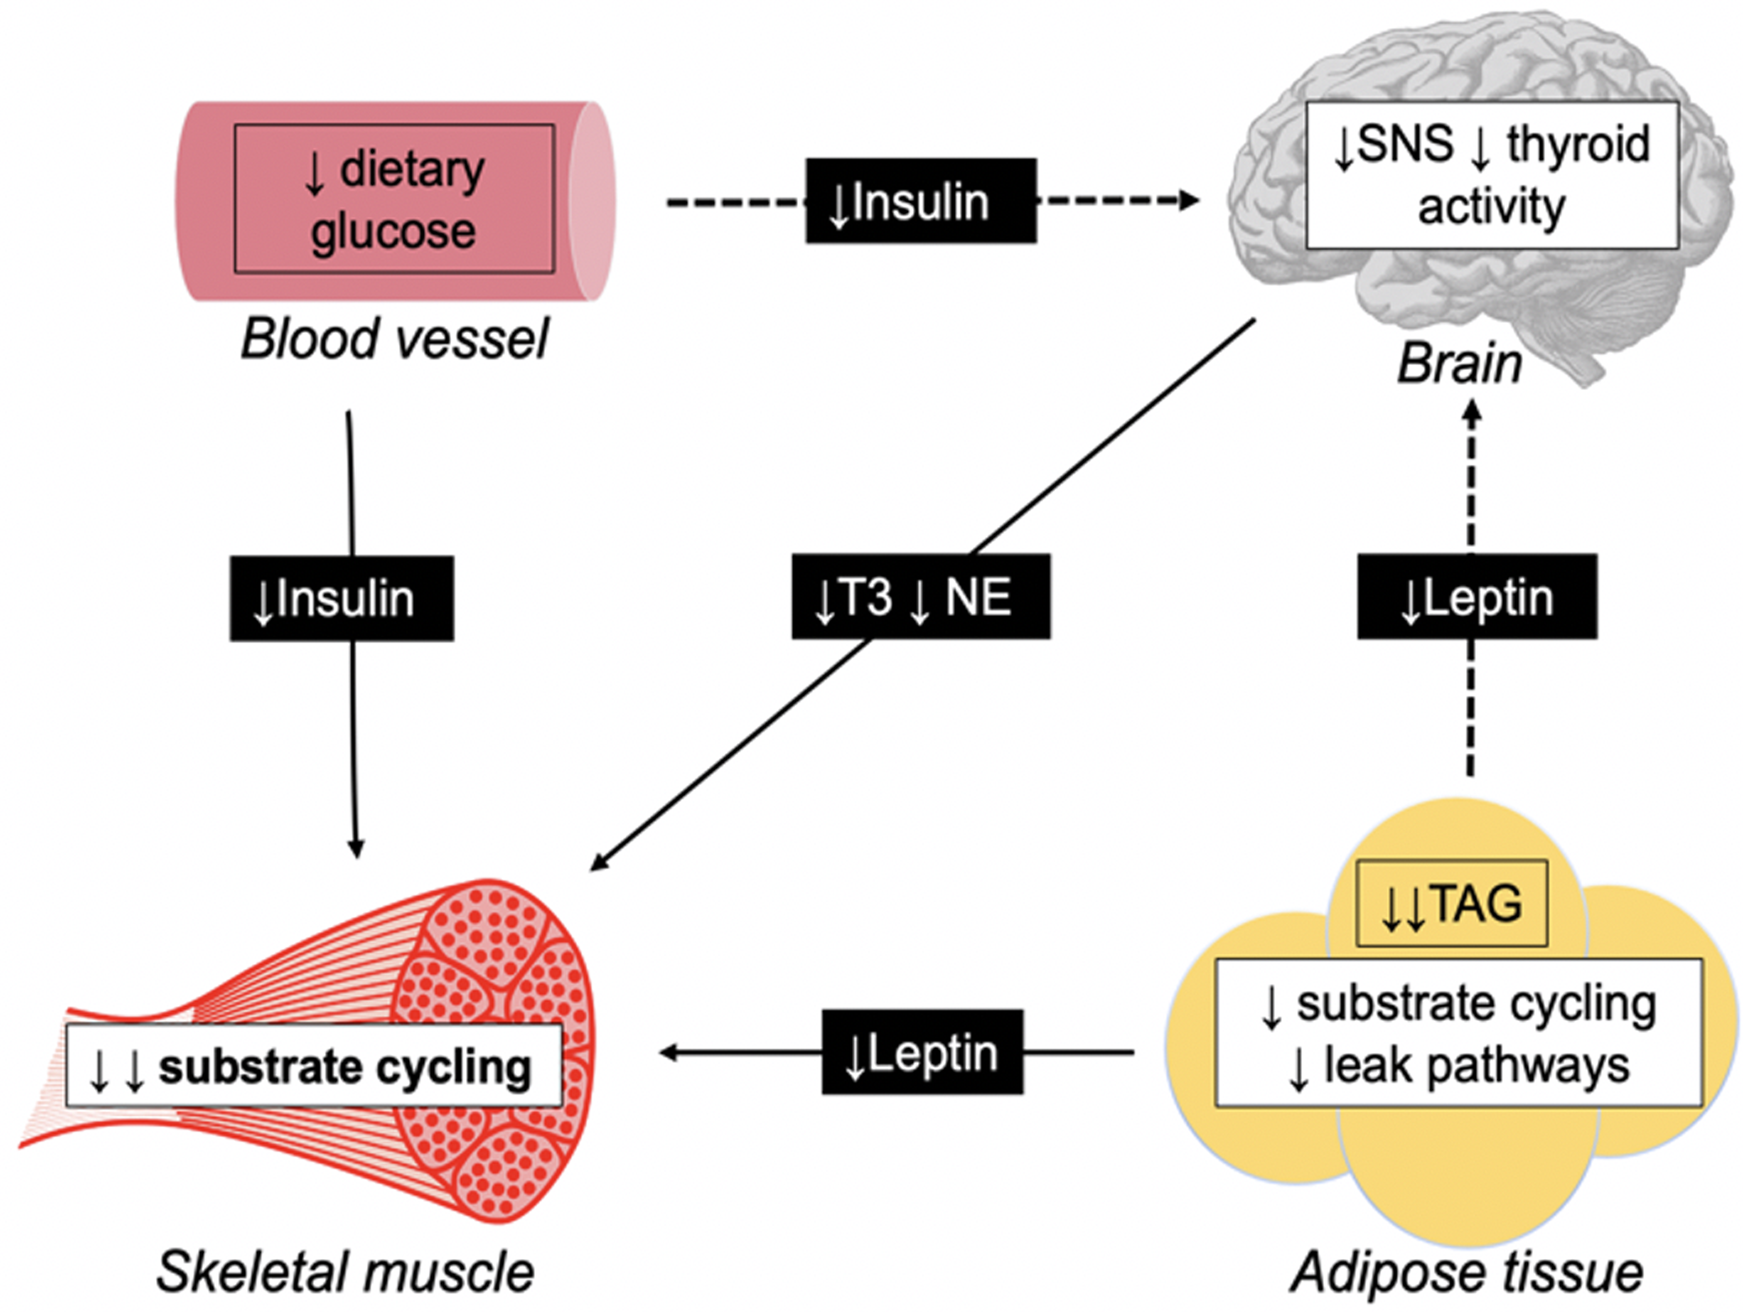
Fig. 1. Schematic diagram illustrating direct (—) and indirect (− −) pathways for adaptive thermogenesis, triggering thrifty mechanisms specific to the skeletal muscle. During periods of energy restriction, leptin secretion in the adipose tissue decreases due to reduced TAG stores. Also, a reduction in plasma insulin is observed secondary to restricted dietary intake. Such hormones directly downregulate substrate cycling in the skeletal muscle. Additionally, both leptin and insulin indirectly reduces skeletal muscle thermogenesis through suppression of the sympathetic nervous system (SNS) and thyroid gland, and subsequent triiodothyronine (T3), and norepinephrine (NE) production.
The skeletal muscle is the primary site of a thermogenic effector system(Reference Dulloo, Jacquet and Seydoux131). This system is orchestrated by substrate cycling between lipid oxidation and lipogenesis, and regulated by hormones including insulin, leptin, triiodothyronine and norepinephrine(Reference Dulloo, Jacquet and Seydoux131).
Leptin is secreted by adipocytes in adipose tissue in proportion to existing FM(Reference Rosenbaum, Nicolson and Hirsch132). During periods of energy restriction, depleted TAG stores result in reduced leptin production, which directly downregulates substrate cycling in the skeletal muscle. Additionally, leptin indirectly downregulates skeletal muscle thermogenesis through suppression of the sympathetic-thyroid axis, with reduced norepinephrine and triiodothyronine production having similar regulatory effects on substrate cycling(Reference Dulloo, Jacquet and Seydoux131).
Insulin is secreted by the pancreas in response to elevated blood glucose concentrations, hence during periods of energy restriction, lower dietary carbohydrate intake results in reduced insulin production, which is reported to have similar direct and indirect effects on substrate cycling and thermogenesis in the skeletal muscle(Reference Dulloo, Jacquet and Seydoux131). This suggests that early alterations in glycolytic activity are one explanation for the proposed immediate onset of AT.
However, the skeletal muscle is a major glucose consumer and a primary site for glucose metabolism, meaning suppressed thermogenesis will result in reduced glucose utilisation during periods of refeeding. The resulting hyperinsulinemia will cause spared glucose to be redistributed for lipogenesis (tri-acylglyceride storage) in adipose tissue. This phenomenon, referred to as ‘catch-up fat’, is characterised by a disproportionate rate of FM recovery relative to FFM(Reference Dulloo, Jacquet and Seydoux131). This preferential restoration of FM has been observed in several influential weight-loss studies(Reference Weyer, Walford and Harper104,Reference Debray, Zarakovitch and Ranson133) including the Minnesota starvation experiment(Reference Keys, Brozek and Henschel64), where FM exceeded prestarvation values by over 75 % after refeeding(Reference Dulloo, Jacquet and Girardier134).
Factors determining adaptive thermogenesis
Shifts in energy balance
There is compelling evidence to suggest that metabolic adaptation is determined by shifts in energy balance, with values of AT halved under conditions of weight stability (representing energy balance), when compared to conditions of dynamic weight-loss (representing energy imbalance)(Reference Martins, Roekenes and Salamati103).
Early research by Leibel et al.(Reference Leibel, Rosenbaum and Hirsch20) reported REE was 10–15 % lower immediately after the weight-loss phase, compared to after 14 d of weight stability. As it was assumed that body composition was constant during the weight stability period, the increase in REE was attributed to the lessening effects of AT. The idea that metabolic adaptation is determined by energy balance is supported in recent research by Martins et al.(Reference Martins, Gower and Hill135) who reported AT equivalent to 226 kJ/d (54 kcal/d) immediately after a 5-month 3347⋅2 kJ (800 kcal) daily diet, yet no AT was present at 1- and 2-year follow-up. An additional study by the same group(Reference Martins, Roekenes and Salamati103) reported a 50 % reduction in AT from the end of an 8-week weight-loss programme to the end of a 4-week weight stability period (385 kJ (92 kcal) decreasing to 159 kJ (38 kcal)), with no AT present at 1-year follow-up. Moreover, of those who gained weight during the weight stability period, i.e. were in a positive energy balance, no AT was detected.
The concept that energy balance shifts drive AT would explain the long-term metabolic adaptation reported in studies with longer dynamic weight-loss phases, where subjects were still in negative energy balance at the time AT was measured.
The Biosphere 2 experiment(Reference Weyer, Walford and Harper104) reported metabolic adaptation after 2 years of moderate energy restriction and about 15 % weight-loss. While AT was significant immediately after the weight-loss phase, i.e. at the end of year two, no AT was detected 6 months later, at which point participants had returned to an ad libitum diet and bodyweight had completely recovered. Similarly, the CALERIE study reported metabolic adaptation after 1 year(Reference Ravussin, Redman and Rochon136) of 25 % energy restriction and about 12 % weight-loss. While AT was significant immediately after the weight-loss phase, i.e. at the end of year one, no AT was detected a year later (year two), when participants had regained a proportion of lost weight. In contrast, Butte et al.(Reference Butte, Brandt and Wong114) reported metabolic adaptation was still present 6 and 12 months after bariatric surgery. However, due to the long-term effects of gastric bypass on EI, patients continued to lose weight throughout the 12 months. Hence, measurements of AT were taken while the subjects were most likely still in negative energy balance.
Collectively, current research indicates that metabolic adaption is present only during the dynamic phase of weight-loss, with minimal impact on weight stability and no persistence during periods of weight regain.
Body mass
A follow-up study of 14 Biggest Loser competitors reported significant persistence of metabolic adaptation equivalent to 2092 kJ/d (500 kcal/d)(Reference Fothergill, Guo and Howard118). The magnitude of AT was highest in those with greater weight-loss after the competition and in those most successful at maintaining weight-loss at follow-up(Reference Fothergill, Guo and Howard118). Contrary to most weight-loss research, metabolic adaptation was detected 6 years post-intervention despite subjects regaining two-thirds of lost weight. One explanation for this could be the higher body mass of participants, with a mean baseline bodyweight of 150 kg. Larger body mass indicates a greater proportion of FFM, a significant predictor of REE(Reference Nielsen, Hensrud and Romanski27). Recent research reports that higher TEE at baseline is associated with greater metabolic adaptation during periods of acute fasting(Reference Hollstein, Basolo and Ando137).
Another possible explanation for the observed AT is the overprediction of REE used for comparison, with predictor equations shown to inaccurately estimate REE in morbidity obese populations(Reference Madden, Mulrooney and Shah138), due to variances in hydration status and fat distribution that are not recognised by bio-impedance(Reference Kyle, Bosaeus and De Lorenzo139). The use of linear regression in such equations assumes a proportional increase in REE with bodyweight, which is unlikely in morbidly obese subjects where excess FFM is predominately low-metabolic skeletal muscle, rather than high-metabolic organs(Reference Heymsfield, Thomas and Bosy-Westphal140). This will elude to a much larger metabolic adaption when calculating the difference between measured and predicted REE.
Degree of weight-loss
Several studies suggest that the magnitude of AT is determined by the degree of weight-loss(Reference Camps and Verhoef76,Reference Muller, Enderle and Pourhassan90,Reference Fothergill, Guo and Howard118) . Based on these observations, Rosenbaum and Leibel proposed three different models for AT following different degrees of weight-loss(Reference Rosenbaum and Leibel141). They reported that 10 % weight-loss was associated with declines in REE and PAEE beyond that predicted by changes in body composition, suggesting the existence of metabolic adaptation in both compartments. However, with an additional 10 % weight-loss (20 % in total), REE did not decline any further, suggesting a threshold model, where maximum AT is reached once an individual's threshold for FM is crossed, a point considered to be determined by biological and environmental factors(Reference Rosenbaum and Leibel141). This supports early observations by Leibel et al.(Reference Leibel, Rosenbaum and Hirsch20) where AT persisted up to 10 % weight-loss, at which point maximum adaptation was reached and sustained.
However, an additional 10 % weight-loss was associated with a further decline in PAEE beyond that predicted by changes in body composition, suggesting an adaptive response in PAEE that is proportional to the degree of weight-loss(Reference Rosenbaum and Leibel141). Butte et al.(Reference Butte, Brandt and Wong114) reported a similar finding, where most metabolic adaptation occurred in the first 4–6 weeks, at which point subjects had lost about 10 % bodyweight, despite the bariatric surgery leading to continued weight-loss for up to 1 year. However, PAEE continued to decline for the remainder of the intervention.
Several studies support the existence of AT in non-resting compartments(Reference Dulloo, Jacquet and Montani94), persisting where no further AT in REE is observed. This was explained by increases in skeletal muscle efficiency(Reference Leibel, Rosenbaum and Hirsch20), resulting in reduced metabolic cost of movement and decreases in spontaneous physical activity(Reference Weyer, Walford and Harper104), resulting in reduced frequency of movement.
Genetic phenotypes
The large interindividual variability in AT may be explained by a genetic influence. Recent research suggests AT is an individualised trait under biological control(Reference Muller, Enderle and Bosy-Westphal77), with metabolic phenotype determining the ability to efficiently alter fuel utilisation and manipulate energy balance. A cross-sectional study by Weyer et al.(Reference Weyer, Vozarova and Ravussin142) was among the first to suggest phenotypic differences in EE response, after observing a correlation between increasing EE with overfeeding, and decreasing EE with fasting in 14 male subjects. This observed variation in EE response is reported to be independent of changes in macronutrient composition(Reference Thearle, Pannacciulli and Bonfiglio143), but rather associated with leptin, insulin, sympathetic nervous system activity and thyroid hormones(Reference Butte, Brandt and Wong114).
A proposed thrifty phenotype is characterised by low AT in response to overfeeding, driving weight-gain and high AT in response to energy restriction, limiting weight-loss(Reference Muller, Enderle and Bosy-Westphal77,Reference Reinhardt, Thearle and Ibrahim144) . In contrast, a proposed spendthrift phenotype is characterised by a high AT in response to overfeeding, limiting weight-gain and a low AT in response to energy restriction favouring weight-loss(Reference Muller, Enderle and Bosy-Westphal77,Reference Reinhardt, Thearle and Ibrahim144) .
Metabolic phenotype has been shown to be a significant predictor of weight-loss, independent of age, sex and race. A 6-week weight-loss study(Reference Reinhardt, Thearle and Ibrahim144) revealed that spendthrift phenotypes had a 1 % smaller decrease in TEE and a 518.8 kJ/d (124 kcal/d) larger energy deficit, equating to a 20920 kJ (5000 kcal) greater cumulative energy loss over the 6-week study period.
The existence of metabolic phenotype would also explain the large variability in AT observed among participants on comparable dietary interventions. Muller and Bosy-Westphal(Reference Muller and Bosy-Westphal107) reported significant metabolic adaptation in <50 % of subjects across multiple different weight-loss strategies. Similarly, Martins et al.(Reference Martins, Roekenes and Salamati103,Reference Martins, Gower and Hill135) reported that one in three weight-reduced subjects exhibited greater-than-predicted declines in EE, only half of which experienced metabolic adaptation beyond 167.4 kJ/d (40 kcal/d)(Reference Magkos145).
Mathematical modelling in weight-loss prediction
In recent years, the use of mathematical modelling has greatly advanced our understanding of underfeeding-induced changes in EE. The first simple equation was proposed by Forbes over 30 years ago(Reference Forbes146) describing the proportion of weight lost as FFM as a function of initial body fat. This idea has since been replicated and updated, resulting in the development of several web-based models including The NIH Body Weight Planner (147) and The Pennington Biomedical Research Centre Weight Loss Predictor (148). These models are developed based on the energy balance principle, i.e. the first law of thermodynamics where weight-loss is a product of EI minus EE.
By modelling changes in EE in response to underfeeding, such models may provide a more accurate prediction of weight-loss compared to static modelling, i.e. the 3500 kcal (14644 kJ) rule, which has been reported to predict weight-loss 100 % greater than that predicted by mathematical modelling(Reference Hall, Sacks and Chandramohan72). Additionally, by measuring the greater-than-expected decline in REE in response to underfeeding, i.e. the difference between observed and predicted REE, mathematical modelling can be used to quantify AT (Fig. 2).

Fig. 2. Predicted weight trajectory of a 100 kg female on a low-energy diet (7531⋅2 kJ (1800 kcal/d)) for 6 months modelling static (a), obligatory (b) and adaptive and obligatory (c) changes in energy expenditure.
Models vary in complexity depending on how EE is compartmentalised. While most models subdivide EE into DIT, REE, PAEE(Reference Antonetti149–Reference Hall151), others include an independent function for spontaneous physical activity(Reference Thomas, Martin and Heymsfield152). More simple models describe changes in overall bodyweight rather than body composition, i.e. FM and FFM independently(Reference Antonetti149), whereas more complex models subdivide FFM further into glycogen and protein, describing the influence of macronutrients on body composition and weight change(Reference Flatt150,Reference Hall151) .
Mathematical modelling is primarily used in research, with limited accuracy at an individual level. This is largely due to inaccuracy in estimating baseline energy requirements. Calculating energy deficit requires baseline values for REE, which is associated with an uncertainty of over 5 % in free-living individuals(Reference Hall, Sacks and Chandramohan72). This translates into a larger margin of error in predicted weight-loss. Additionally, accuracy is limited by difficulty ascertaining precise dietary intake in free-living individuals. Findings from Subar et al.(Reference Subar, Kipnis and Troiano153) revealed that obese populations underreport dietary intake by up to 40 % using methods such as 24 h recall, FFQ and diet histories. Therefore, when using experimental weight-loss data to validate mathematical models, it can be difficult to identify whether deviation from an expected weight trajectory is due to an inaccurate input for dietary intake or whether an error exists within the model.
This is illustrated by Hall et al.(Reference Hall, Sacks and Chandramohan72), who compared weight-loss observed in an outpatient intervention to that predicted by mathematical modelling. While weight plateau was generally observed within 6–8 months, mathematical modelling predicted weight plateau to occur significantly later, after several years. Mathematical modelling assumed perfect adherence to the prescribed intervention, therefore relaxed compliance was most likely responsible for the discrepancy between observed and predicted weight-loss. This limitation could be minimised through the use of a tightly controlled dietary intake, e.g. an inpatient intervention group or a total-diet replacement programme.
More recently, a mathematical model of weight-loss(Reference Egan, Rayman and Rayman154) was developed using data from a commercial very low-energy total-diet replacement and behavioural change programme. The model uses simple inputs of weight and EI only to convert energy deficit to weight-loss over time. On comparison to observed weight-loss, while static modelling overestimated weight-loss by about 50 % (12⋅5 (sd 3⋅6) % v. 8⋅5 (sd 4⋅5)%), mathematical modelling predicted a comparable mean weight-loss of 9⋅3 (sd 2⋅2) %, with an overall mean error of −0⋅6 (sd 3⋅45) %(Reference Egan, Rayman and Rayman155). The use of a prescribed total-diet replacement programme reduces errors associated with misreported EI, suggesting that any discrepancy between observed and predicted weight-loss is largely attributed to inaccuracies in modelling EE.
Conclusion
A magnitude of evidence exists demonstrating the obligatory and adaptive changes in EE that occur in response to an energy deficit (e.g. weight loss). It is clear that static modelling significantly overestimates weight-loss by disregarding the changes in EE observed when the body is in a negative energy balance. Despite this, the 3500 kcal (14644 kJ) rule continues to be used in clinical weight management, possibly due to ease of use or lack of a clinically feasible alternative. Nevertheless, by accounting for existing evidence, the present research suggests that mathematical modelling can provide a more accurate method of weight-loss prediction and may prove a valuable tool in setting weight-loss prescriptions and assessing dietary compliance in the treatment of obesity.
Acknowledgements
We would like to acknowledge Dr John Rayman, University of Surrey for his continued assistance in providing mathematical expertise during the course of this research. We thank Dr Kelly Johnston, LighterLife UK Ltd. for her valuable input in the planning and development of the project. Finally, we wish to thank Prof Margaret Rayman, University of Surrey for providing invaluable writing assistance and for reviewing and proofreading the manuscript.
Financial Support
This work was supported by the University of Surrey Doctoral College Studentship Award and LighterLife UK Limited.
Conflict of Interest
None.
Authorship
The authors had sole responsibility for all aspects of preparation of this paper.


 Open access