Dietary carbohydrate intake is the primary dietary component that is responsible for increasing postprandial blood glucose levels and modulating insulin secretion( Reference Wolever and Mehling 1 ). Glycaemic index (GI) is a concept first introduced by Jenkins in 1981( Reference Jenkins, Wolever and Taylor 2 ). It is a method of functionally ranking differences in carbohydrates depending on the responses of actual postprandial blood glucose by comparing with a reference food (either white bread or glucose)( Reference O’Reilly, Wong and Chen 3 ). Glycaemic load (GL) is calculated by multiplying the GI with the mass of carbohydrates (g) and then dividing by 100 %( Reference Folsom, Demissie and Harnack 4 ). Therefore, the concept of GI reflects the quality of dietary carbohydrate, whereas the GL reflects both the quality and quantity of carbohydrate.
Disorders of glucose metabolism and insulin responses may participate in the development of some chronic diseases, including diabetes, CVD and stroke( Reference Greenwood, Threapleton and Evans 5 – Reference Aeberli, Gerber and Hochuli 8 ). Dietary factors are also thought to be involved in the aetiology of cancer( Reference Aune, Chan and Vieira 9 – Reference Choi, Giovannucci and Lee 12 ). In 2015, a meta-analysis( Reference Turati, Galeone and Gandini 11 ) reviewed seventy-two studies and reported a significantly increased risk of colorectal cancer (summary OR=1·16; 95 % CI 1·07, 1·25 for GI) and endometrial cancer (summary OR=1·17, 95 % CI 1·00, 1·37 for GL) for the highest v. the lowest categories of GI and GL intake. No significant association was observed for other digestive-tract cancers and hormone-related cancers( Reference Turati, Galeone and Gandini 11 ). In 2012, a meta-analysis( Reference Choi, Giovannucci and Lee 12 ) summarised the evidence on GI and GL and diabetes-related cancer and suggested positive associations between GI and breast cancer (summary relative risk (RR)=1·06, 95 % CI 1·02, 1·17) for the highest v. the lowest categories. Several meta-analyses focusing on the associations between a single type of cancer and GI or GL have been published (i.e. gastric cancer, breast cancer, prostate cancer, colorectal cancer and pancreatic cancer)( Reference Aune, Chan and Vieira 9 , Reference Ye, Wu and Xu 10 , Reference Aune, Chan and Lau 13 – Reference Wang, Tang and Chen 15 ). Despite the fact, meta-analyses focusing on GI or GL and cancer risk are available on selected cancer sites, most of the results are based on highest v. the lowest categories, resulting in the data missing regarding moderate categories. Moreover, many high-quality case–control studies were published with large samples of cases. Omitting these studies would probably neglect potentially valuable information( Reference Hu, La Vecchia and Augustin 16 – Reference Huang, Fang and Xu 19 ). Since 2015, a number of studies have been published on this issue( Reference Huang, Fang and Xu 19 – Reference Abe, Inoue and Sawada 23 ). It is important, therefore, to conduct an updated and comprehensive dose–response meta-analysis from these cohort and case–control studies.
From ingestion to elimination, the digestive system plays critical roles in the glucose metabolism. All digestive organs are hypothesised as being affected by hyperglycaemia, including the oesophagus, stomach, colorectum, liver and pancreas. Furthermore, to our knowledge, no non-linear dose–response meta-analysis has been performed regarding GI or GL and digestive system cancers, and in particular no meta-analysis has been performed evaluating dietary carbohydrate intake and oesophageal or liver cancer. Therefore, we conducted a comprehensive dose–response meta-analysis and systematic review to update studies on the association between dietary carbohydrate, GI and GL and the risk of digestive system cancers.
Methods
Data sources and search strategies
This meta-analysis was registered on PROSPERO (CRD 42018103580)( Reference Booth, Clarke and Dooley 24 ), and final reporting was compliant with the main Preferred Reporting Items for Systematic Reviews and Meta-Analyses (PRISMA) statement( Reference Moher, Liberati and Tetzlaff 25 ). We searched for articles that described the relationship between dietary carbohydrate, GI and GL and the risk of digestive system cancers from medical and biological databases (Medline, Embase, and Science Citation Index and Web of Science). A comprehensive and broad search strategy was developed. The keywords ‘carbohydrate intake’, ‘glycemic index’, ‘glycemic load’, ‘GI’, ‘GL’ or ‘high glycemic diet’ were used as search terms together with ‘cancer’, ‘carcinoma’, ‘digestive system cancer’, ‘esophageal cancer’, ‘gastric cancer’, ‘duodenal cancer’, ‘intestinal cancer’, ‘colorectal cancer’, ‘liver cancer’, ‘pancreatic cancer’, ‘gall bladder cancer’ and ‘bile duct cancer’. Duplicate records were collapsed into a single, unique entry. In addition, we scanned reference lists of relevant previously published works and review articles. Two independent reviewers (X. C. and X. L.) conducted this work throughout the process. Discrepancies between the two reviewers were resolved through discussion. Final arbitration was performed by X. L. if required.
Inclusion and exclusion criteria
Inclusion criteria are as follows: (1) cohort or case–control study, (2) consideration of dietary carbohydrate intake, GI or GL as baseline exposure, and digestive system cancer events (including oesophageal cancer, gastric cancer, duodenal cancer, intestinal cancer, colorectal cancer, liver cancer, pancreatic cancer, gall bladder cancer and bile duct cancer) as outcomes and (3) English-language original articles published and indexed up to June 2018.
Exclusion criteria are as follows: (1) the original work did not involve exposure–response associations between dietary carbohydrate intake, GI or GL and digestive system cancers, (2) animal studies, reviews, comments and letters, (3) absence of key data for meta-analysis (e.g. RR, OR, or data that could be used to calculate OR) and (4) low-quality articles (we applied the Newcastle-Ottawa scale( Reference Stang 26 ) to assess the quality of articles. On the Newcastle-Ottawa scale, an article was assessed on three broad perspectives: selection, comparability and the ascertainment of either outcome or exposure, with a ‘star system’ awarding a maximum of nine stars. We regarded scores of 0–3 as low quality, 4–6 as moderate quality and 7–9 as high quality( Reference Viale, Allotey and Cheong-See 27 , Reference Cai, Li and Fan 28 )) (as shown in Tables 1 and 2).
Table 1 Characteristics of cohort studies included in meta-analysis on dietary carbohydrate intake, glycaemic index (GI) and glycaemic load (GL) and the risk of digestive system cancers
M, men; F, female; SQ-FFQ, semi-quantitative FFQ; N/A, not available; EPIC, European Prospective Investigation into Cancer and Nutrition. * Star systems.
Table 2 Characteristics of case–control studies included in meta-analysis on dietary carbohydrate intake, glycaemic index (GI) and glycaemic load (GL) and the risk of digestive system cancers
M, men; F, female; SQ-FFQ, semi-quantitative FFQ; N/A, not available. * Star systems.
Data extraction
The data were extracted independently by two reviewers with a standardised data extraction form. The characteristics of the identified articles were recorded as follows: first author’s name, year of publication, area, study design (cohort or case–control), sex, age (mean or range), number of population, number of cases, outcome (oesophageal cancer, gastric cancer, duodenal cancer, intestinal cancer, colorectal cancer, liver cancer, pancreatic cancer, gall bladder cancer or bile duct cancer), type of exposure (GI, GL and carbohydrate), dietary assessment methods, estimates (RR, hazard ratio, or OR, with 95 % CI) and controlled factors.
Statistical analyses
We conducted meta-analysis for prospective cohort studies and case–control studies separately. Heterogeneity between types of cancer was explored using meta-regression. A positive meta-regression coefficient (P≤0·05) was considered as identifying an influencing factor. Pooled RR or OR of carbohydrate intake, GI and GL with 95 % CI for the risk of digestive system cancers were calculated using fixed or random effects models for the highest v. the lowest categories. Heterogeneity among the pooled RR or OR was tested using the Q test( Reference Higgins and Thompson 29 ) and I 2 index( Reference Higgins, Thompson and Deeks 30 ). When the results of the Q-test and I 2 statistics did not show notable heterogeneity (P>0·05 and I 2≤50 %), we used a fixed-effects analysis following the Mantel–Haenszel method( Reference Mantel and Haenszel 31 ). Otherwise, a random-effects analysis was applied using the method of DerSimonian & Laird( Reference DerSimonian and Laird 32 ). We produced forest plots and funnel plots. The sizes of RR or OR in the plots represent the relative weight that each work contributed to the pooled results. Publication bias was assessed by Begg’s test and the weighted Egger test( Reference Begg and Mazumdar 33 , Reference Egger and Smith 34 ). Sensitivity analyses was used to measure whether the combined effects were influenced by an individual study; the meta-analysis was re-conducted after each study was omitted( Reference Aune, Sen and Leitzmann 35 ). The two solid vertical lines in the forest plots in sensitivity analyses represented the estimates before omitting any study.
We used the method described by Greenland & Longnecker( Reference Greenland and Longnecker 36 ) to conduct a study-specific dose–response analysis based on the estimates presented for each category of dietary carbohydrate intake, GI and GL. We used mean or median of exposure for each category if presented, and used midpoint if exposure ranges were presented. If the highest or lowest categories were unbounded, we supposed the category width to be the same as the adjacent one. We also extracted the distribution of cases, the person-years or non-cases for at least three categories of exposure. The results of dose–response analysis were shown for a 50 g increase per d for dietary carbohydrate, a 10-unit increase for GI and a 50-unit increase for GL. We also applied the flexible restricted cubic splines method( Reference Orsini, Li and Wolk 37 ) to examine the possible non-linear relationships, using three fixed knots at 10, 50 and 90 % of the exposure level. If the reference food was white bread, we recalculated GI and GL based on glucose scale with the method described by Foster-Powell et al. ( Reference Foster-Powell, Holt and Brand-Miller 38 ). All analyses were performed using software STATA version 12.0 (StataCorp LP).
Results
Study characteristics
The flow through the selection process was described in a modified PRISMA diagram (Fig. 1). Finally, forty-four high-quality studies (twenty-six cohort studies and eighteen case–control studies) with 161 independent estimates on dietary carbohydrate intake, GI and/or GL and risk of digestive system cancers were identified. Seven studies considered oesophageal cancer as the outcome, fourteen studies considered gastric cancer as the outcome, sixteen studies presented colorectal cancer as the outcome, seven studies considered liver cancer as the outcome and twelve studies considered pancreatic cancer as the outcome. Of these, six studies considered more than one type of cancers( Reference Hu, La Vecchia and Augustin 16 , Reference Sieri, Agnoli and Pala 20 , Reference Li, Petrick and Steck 22 , Reference George, Mayne and Leitzmann 39 – Reference Mayne, Risch and Dubrow 41 ). There were 3 353 720 participants from the USA (eighteen studies), Italy (seven studies), China (four studies), Canada (two studies), the Netherlands (two studies), Sweden (two studies), Australia (one study), France (one study), Greece (one study), Iran (one study), Japan (one study), Poland (one study), Serbia (one study) and Western European (one study), including 33 102 digestive system cancer events. There were no suitable studies regarding duodenal cancer, small intestinal cancer or gall bladder cancer. Among these studies, Sieri et al. ( Reference Sieri, Agnoli and Pala 20 ) study used different FFQ for Italian European Prospective Investigation into Cancer and Nutrition (EPIC) centres (a 188 food items FFQ for North-Central Italy, a 217 food items FFQ for Ragusa and a 140 food items FFQ for Naples).
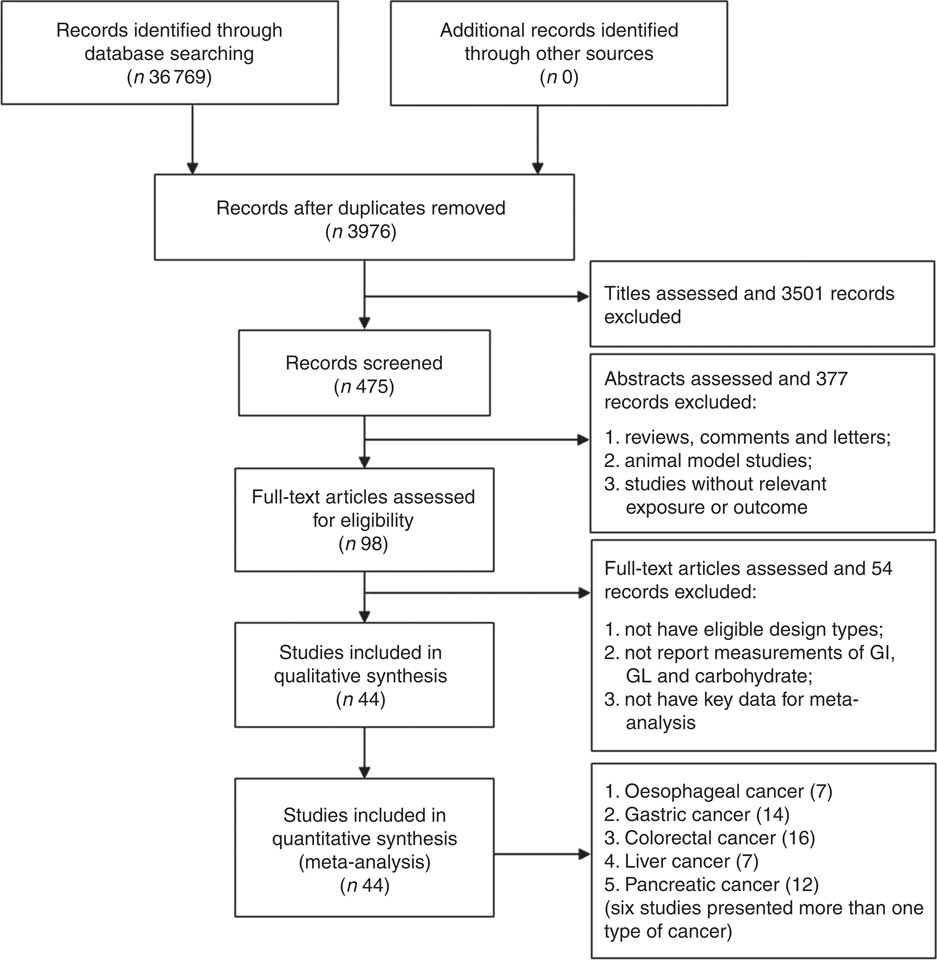
Fig. 1 Flow diagram of the studies search process. GI, glycaemic index; GL, glycaemic load.
Overall, Tables 1 and 2 present the summaries of each study included in the meta-analysis. The multivariate-adjusted RR and OR reported in the original articles with exposure levels of carbohydrate, GI and GL categories were summarised (online Supplementary Tables S1–S3).
Dietary carbohydrate intake
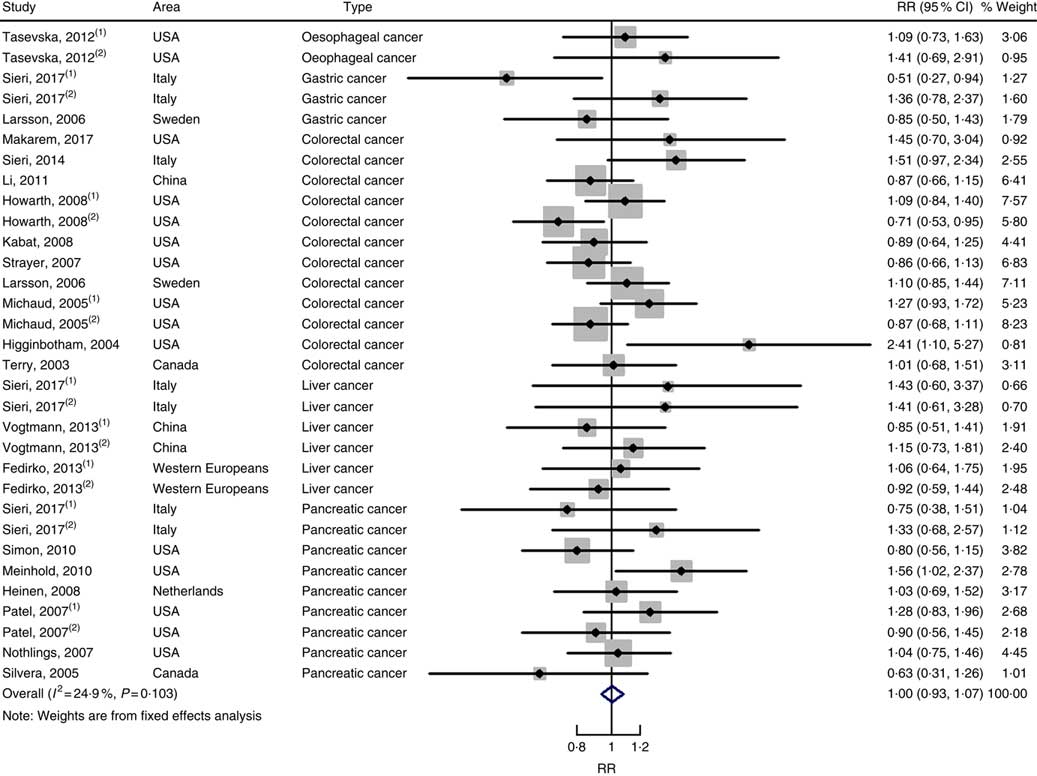
In total, twenty prospective cohort studies and fourteen case–control studies were included in the meta-analysis on dietary carbohydrate intake and risk of digestive system cancers. Meta-regression was performed to detect possible sources of heterogeneity among type of cancers. We found that type of cancers (oesophageal cancer, gastric cancer, colorectal cancer, liver cancer and pancreatic cancer) was not influencing factors (P=0·868 for cohort studies; P=0·573 for case–control studies). Therefore, we brought these estimates into meta-analysis. The results of pooled analysis indicated that there was no evidence of an association between dietary carbohydrate intake and the risk of digestive system cancers at the highest compared with the lowest categories (summary RR=1·00, 95 % CI 0·93, 1·07 for cohort studies; as shown in Fig. 2; summary OR=0·76, 95 % CI 0·58, 1·01 for case–control studies; as shown in Fig. 3). The pooled analysis of prospective cohort studies had no heterogeneity (P=0·103; I 2=24·9), while the results of case–control studies had substantial heterogeneity (P=0·000; I 2=80·9). Publication bias was not found (Begg’s test z c=1·35, P=0·178; Egger’s test t=1·57, P=0·126 for cohort studies; Begg’s test z c=1·36, P=0·174; Egger’s test t=–0·89, P=0·386 for case–control studies). The funnel plot was symmetrical (online Supplementary Fig. S1(A) and (B)). Heterogeneity was primarily driven by design and large amounts of included estimates. Sensitivity analyses showed the results were robust (online Supplementary Figs. S2 and S3).
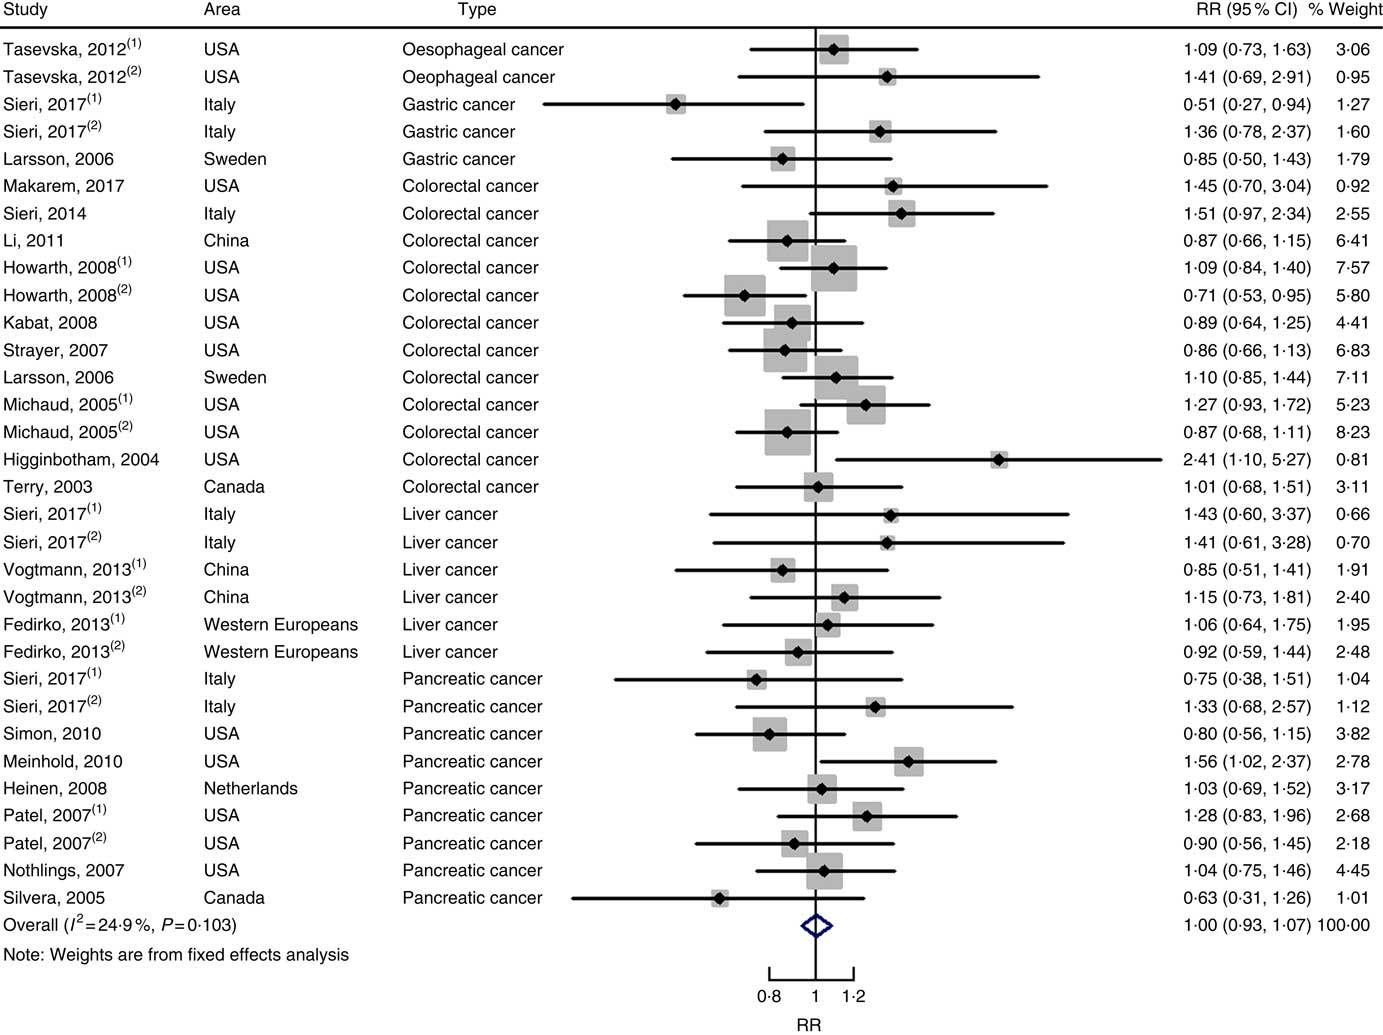
Fig. 2 Forest plots of meta-analysis on dietary carbohydrate intake and digestive system cancers (cohort studies). RR, relative risk.
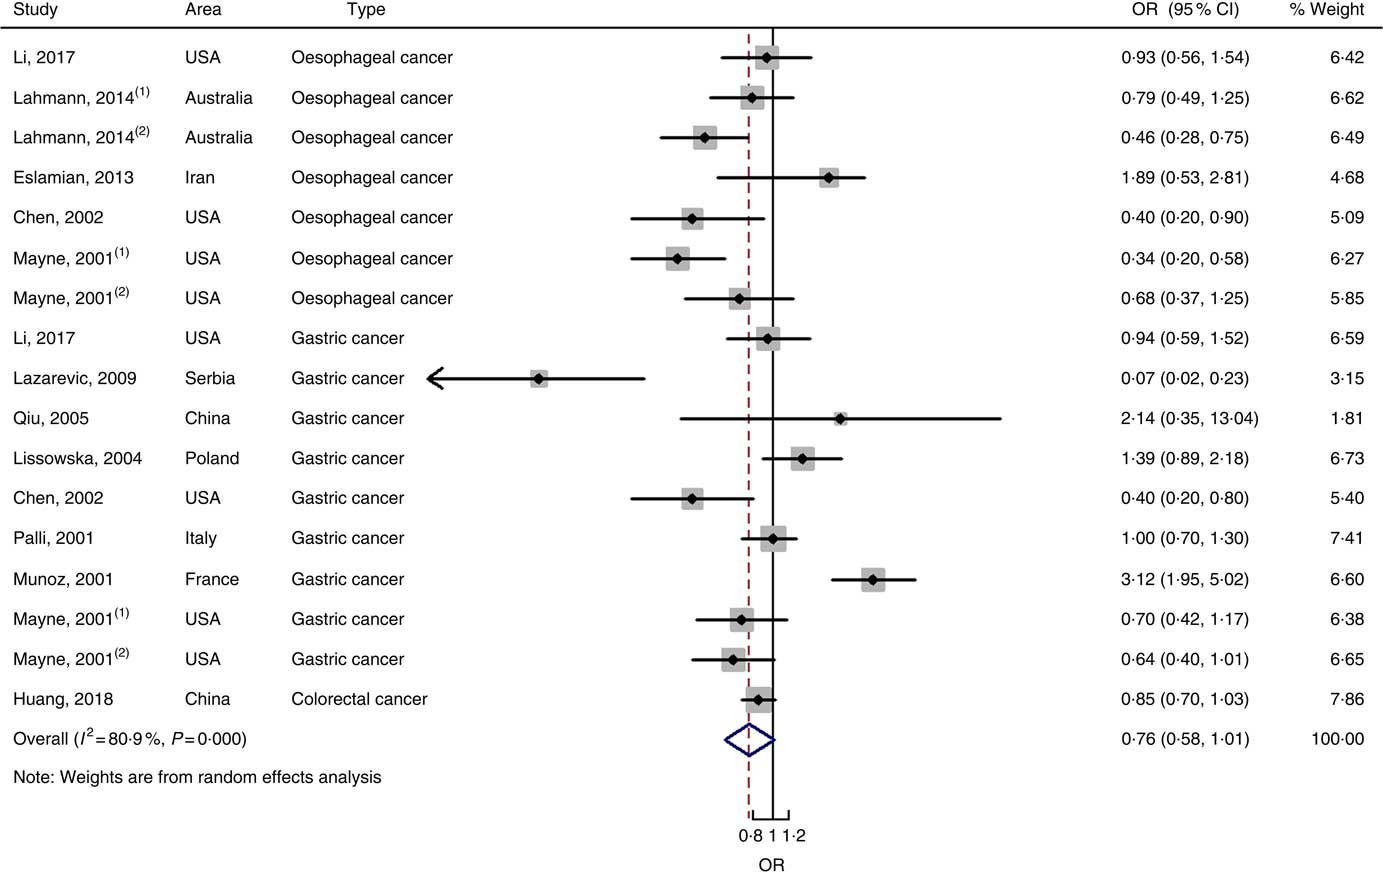
Fig. 3 Forest plots of meta-analysis on dietary carbohydrate intake and digestive system cancers (case–control studies).
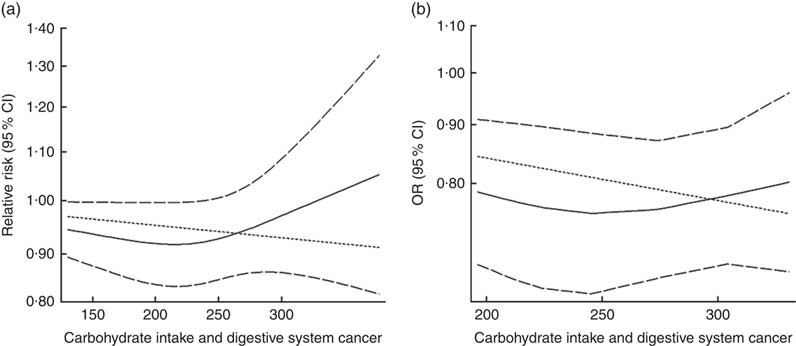
Eighteen groups of data from fourteen studies were incorporated into dose–response analyses on dietary carbohydrate intake and the risk of digestive system cancers( Reference Lahmann, Ibiebele and Webb 17 , Reference Larsson, Bergkvist and Wolk 42 – Reference Silvera, Rohan and Jain 53 ). The summary RR was 0·99 (95 % CI 0·97, 1·00) with 50 g/d increase in carbohydrate intake for cohort studies and the summary OR was 0·95 (95 % CI 0·91, 1·00) for case–control studies. There was no evidence of a non-linear relationship between dietary carbohydrate intake and risk of digestive system cancers (P non-linearity=0·167 for cohort studies, Fig. 4(a); P non-linearity=0·228 for case–control studies, Fig. 4(b)). The curve was flat with increasing intake of carbohydrate. Similar results were found in the non-linear dose–response analysis of colorectal cancer, liver cancer and pancreatic cancer (online Supplementary Fig. S4).

Fig. 4 Summary non-linear dose–response curves on carbohydrate intake and digestive system cancers: (a) cohort studies; (b) case–control studies.
Glycaemic index
Twenty-two cohort studies with thirty-nine independent estimates were eligible for meta-analysis of GI and the risk of digestive system cancers. The results of meta-regression did not indicate a source of heterogeneity from type of cancers (P=0·206). Therefore, we brought these thirty-nine estimates into the meta-analysis. The association between GI and digestive system cancers was statistically significant at the highest compared with the lowest categories (summary RR=1·10, 95 % CI 1·05, 1·15), with no heterogeneity (P=0·150; I 2=19·1) (Fig. 5). The funnel plot was symmetrical (online Supplementary Fig. S1(C)), and there was no evidence of publication bias (Begg’s test z c=0·19, P=0·847; Egger’s test t=–0·59, P=0·561). Sensitivity analyses showed that the results were not overly affected by one publication (online Supplementary Fig. S5).
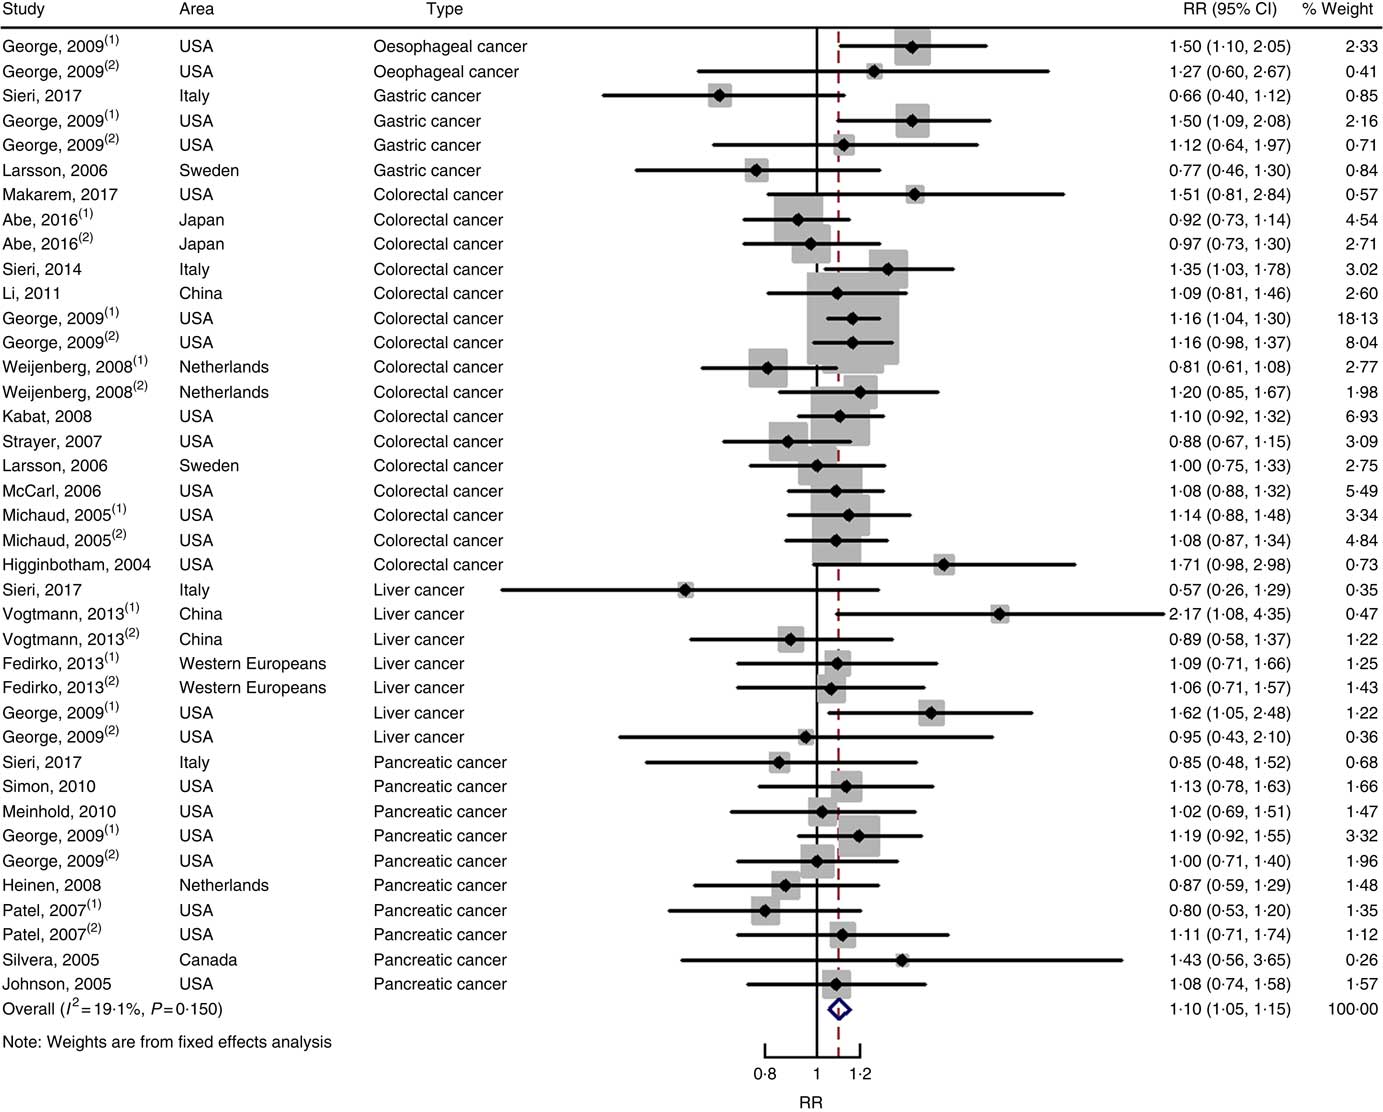
Fig. 5 Forest plots of meta-analysis on glycaemic index and digestive system cancers (cohort studies). RR, relative risk.
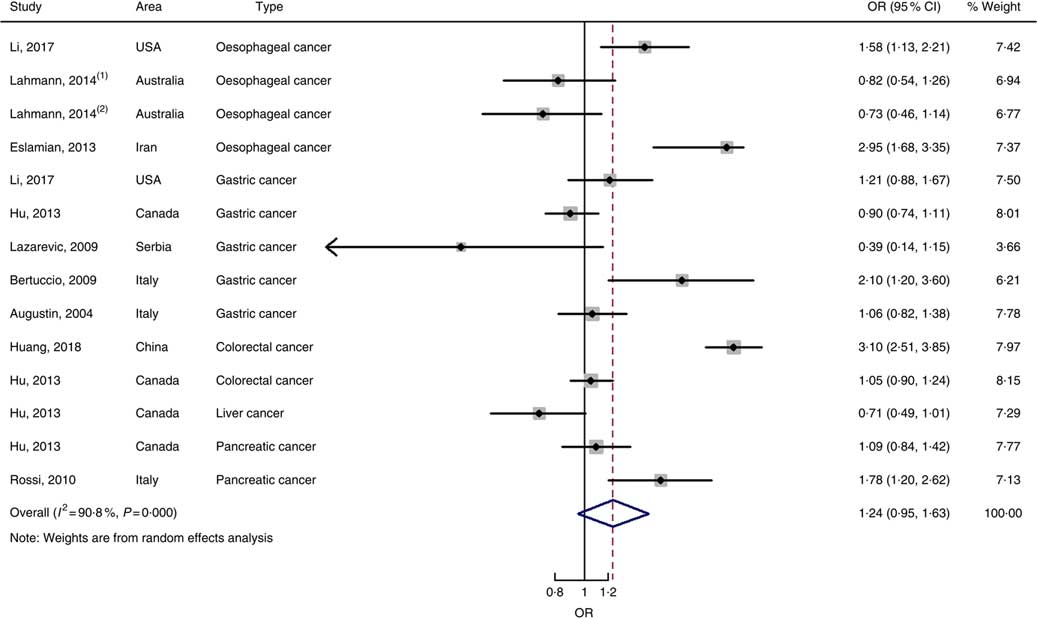
Nine case–control studies with fourteen independent estimates were also brought into the meta-analysis after the procedure of meta-regression (P=0·967 for type of cancers). The summary OR was 1·28 (95 % CI 0·97, 1·69) at the highest compared with the lowest categories with substantial heterogeneity (P=0·000; I 2=91·3) (Fig. 6). There was no evidence of publication bias (Begg’s test z c=0·44, P=0661; Egger’s test t=–0·17, P=0·870), and the funnel plot was symmetrical (online Supplementary Fig. S1(D)). Sensitivity analyses showed that the results were robust (online Supplementary Fig. S6). Heterogeneity was primarily driven by design.
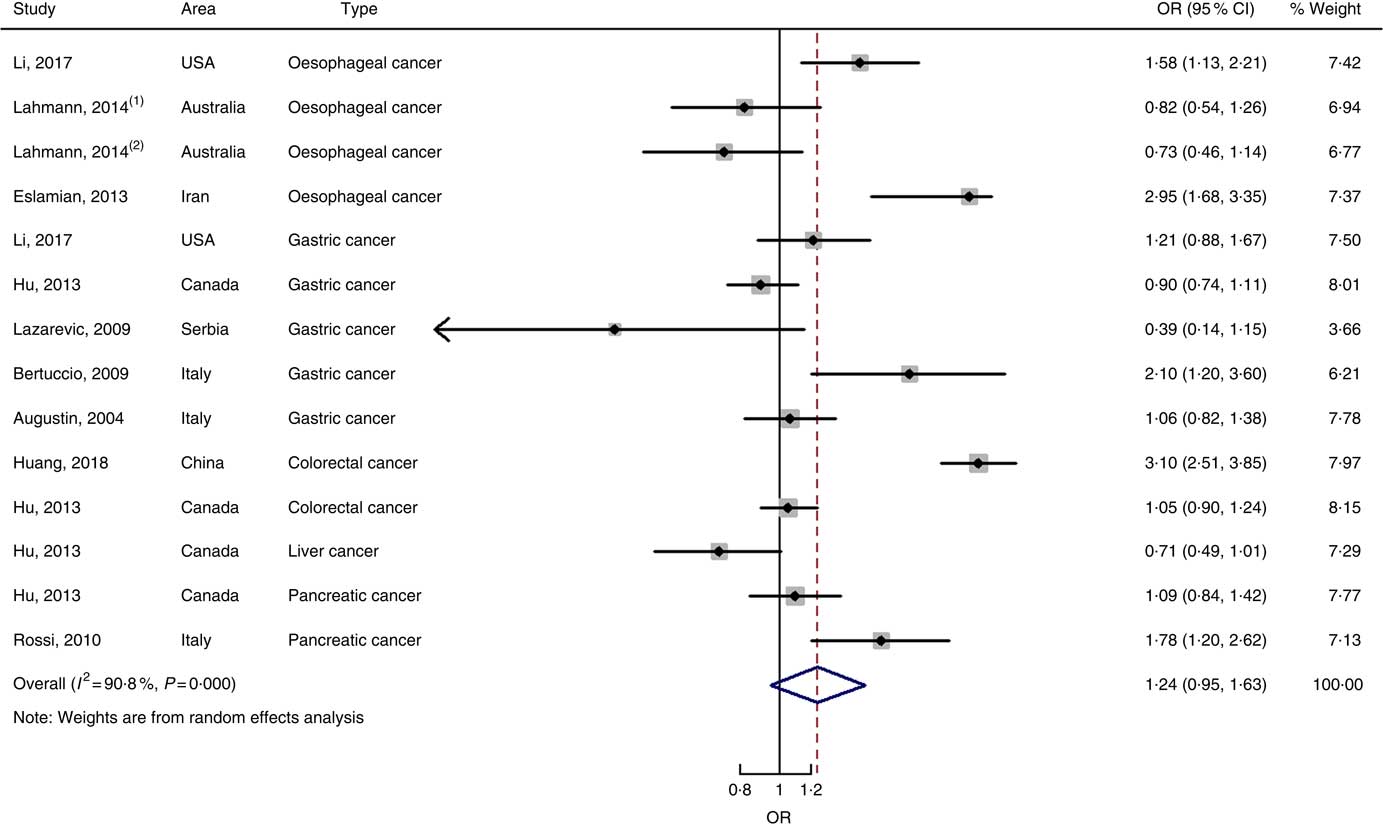
Fig. 6 Forest plots of meta-analysis on glycaemic index and digestive system cancers (case–control studies).
Twenty-three groups of data from seventeen studies were incorporated into dose–response analyses on GI and the risk of digestive system cancers( Reference Lahmann, Ibiebele and Webb 17 , Reference Huang, Fang and Xu 19 , Reference Makarem, Bandera and Lin 21 , Reference Abe, Inoue and Sawada 23 , Reference Sieri, Krogh and Agnoli 43 – Reference Strayer, Jacobs and Schairer 55 ). The summary RR was 1·003 (95 % CI 1·000, 1·012) for every 10-unit increase in GI for cohort studies and the summary OR was 1·09 (95 % CI 1·06, 1·11) for case–control studies. The results of cohort studies did not indicate a non-linear relationship (P non-linearity=0·092, Fig. 7(a)), while the curve of case–control studies showed a substantial increase in digestive system cancer risk, with increasing units of GI (P non-linearity=0·000, Fig. 7(b)). The results of non-linear dose–response analyses of colorectal cancer, liver cancer and pancreatic cancer are shown in online Supplementary Fig. S7.
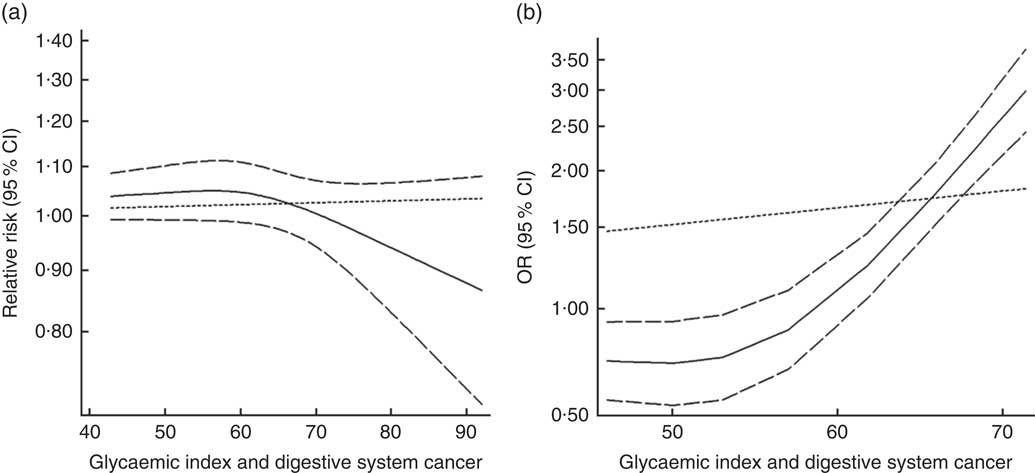
Fig. 7 Summary non-linear dose–response curves on glycaemic index and digestive system cancers: (a) cohort studies; (b) case–control studies.
Glycaemic load
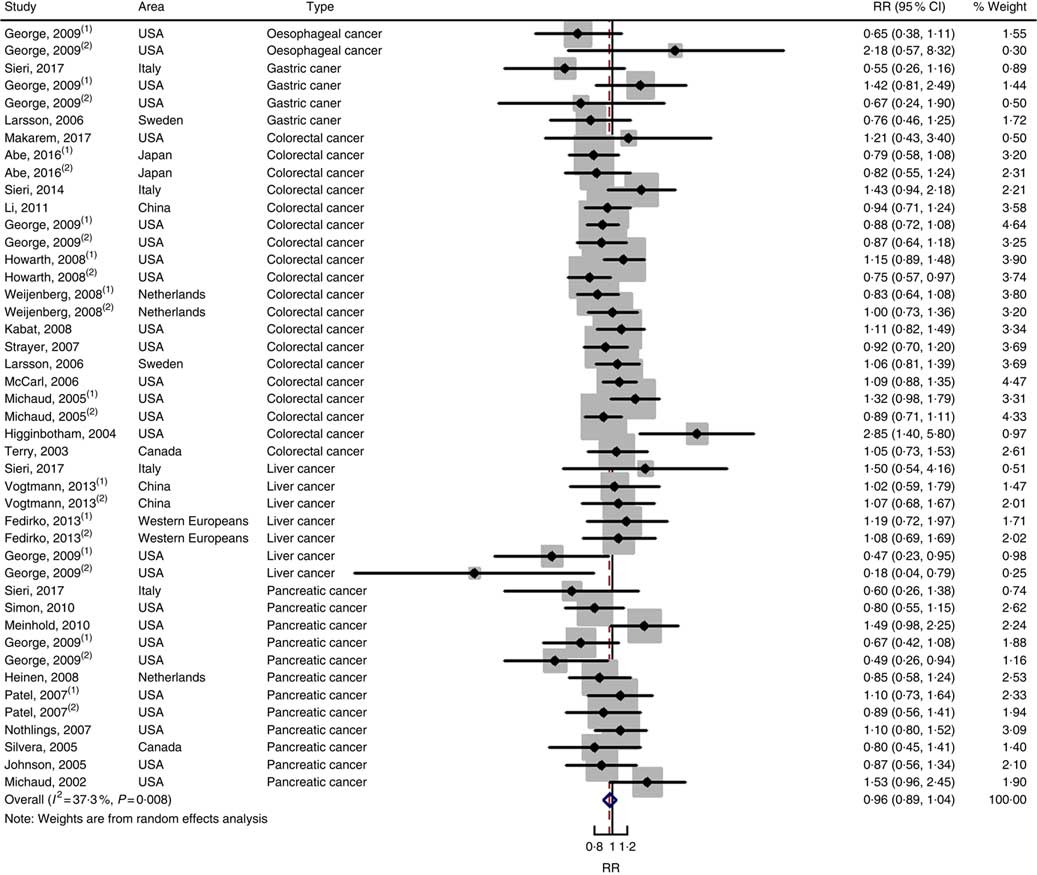
Twenty-five prospective cohort studies and ten case–control studies were included in the meta-analysis. We found that type of cancers was not an influencing factor (P=0·975 for cohort studies; P=0·400 for case–control studies). Therefore, we brought these estimates into the meta-analysis. There was no evidence of statistical association between GL and digestive system cancers at the highest compared with the lowest categories (summary RR=0·96, 95 % CI 0·89, 1·04 for cohort studies; as shown in Fig. 8; summary OR=1·30, 95 % CI 0·97, 1·74 for case–control studies; as shown in Fig. 9) with substantial heterogeneity (P=0·008; I 2=37·3 for cohort studies; P=0·000; I 2=90·5 for case–control studies). There was no evidence of publication bias (Begg’s test z c=0·62, P=0·537; Egger’s test t=–0·43, P=0·672 for cohort studies; Begg’s test z c=0·00, P=1·00; Egger’s test t=2·17, P=0·05 for case–control studies) and the funnel plot was symmetrical (online Supplementary Fig. S1(E) and (F)). Heterogeneity was primarily driven by large amounts of included estimates. Sensitivity analyses showed the results were robust (online Supplementary Figs. S8 and S9).

Fig. 8 Forest plots of meta-analysis on glycaemic load and digestive system cancers (cohort studies). RR, relative risk.
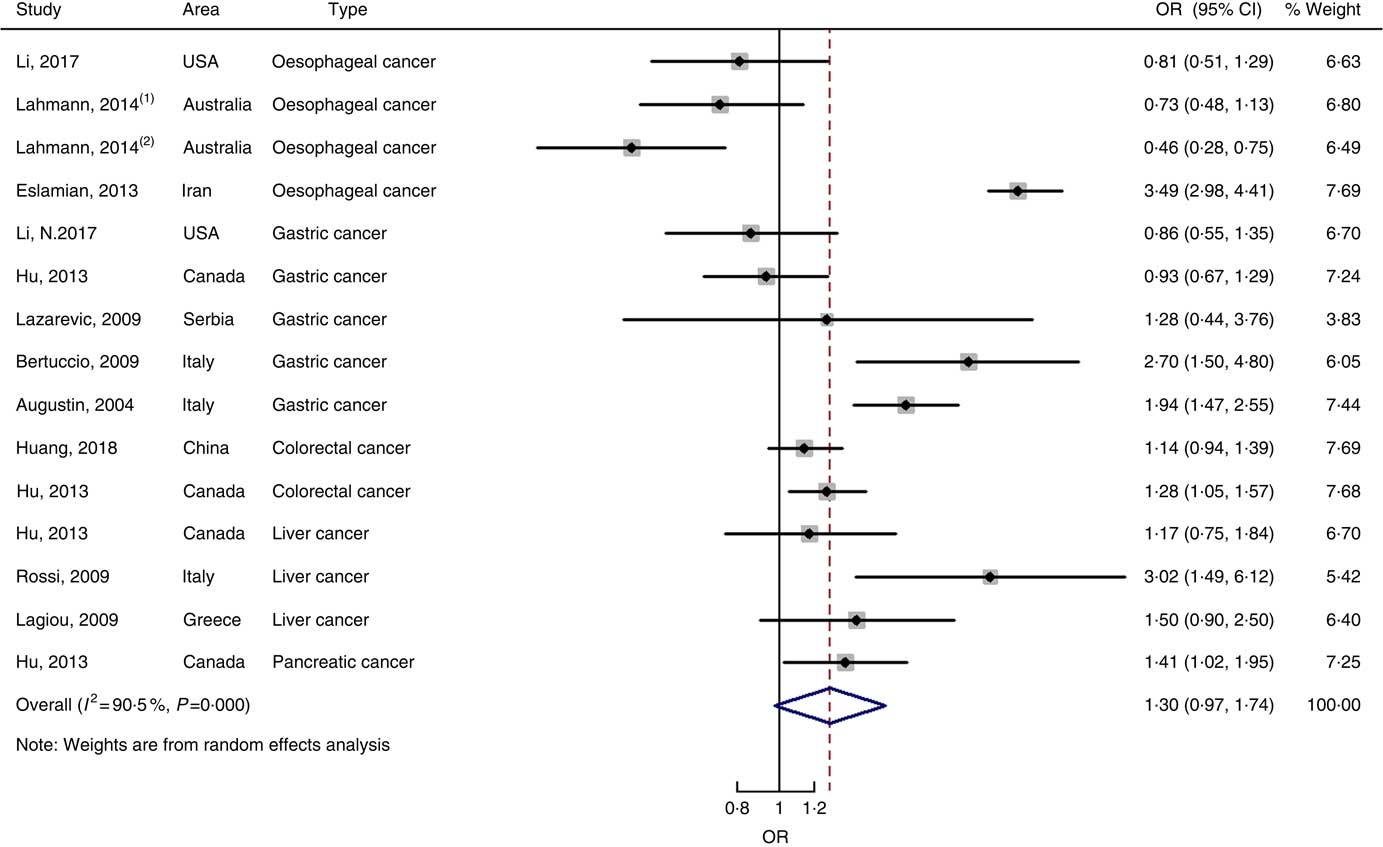
Fig. 9 Forest plots of meta-analysis on glycaemic load and digestive system cancers (case–control studies).
Twenty-seven groups of data from twenty-one studies were incorporated into dose–response analyses on GL and the risk of digestive system cancers( Reference Makarem, Bandera and Lin 21 , Reference Abe, Inoue and Sawada 23 , Reference Larsson, Bergkvist and Wolk 42 – Reference Simon, Shikany and Neuhouser 50 , Reference Weijenberg, Mullie and Brants 54 , Reference Strayer, Jacobs and Schairer 55 ). There was no evidence of statistical relationship between digestive system cancers and every 50-unit increase in GL (summary RR=0·95, 95 % CI 0·96, 1·00 for cohort studies; summary OR=1·00, 95 % CI 0·97, 1·03 for case–control studies). The results of cohort studies did not show a non-linear relationship (P non-linearity=0·620, Fig. 10(a)), while the curve of case–control studies indicated an increase in digestive system cancer risk with increasing units of GL (P non-linearity=0·000, Fig. 10(b)). The results of the non-linear dose–response analysis of colorectal cancer, liver cancer and pancreatic cancer were shown in online Supplementary Fig. S10.
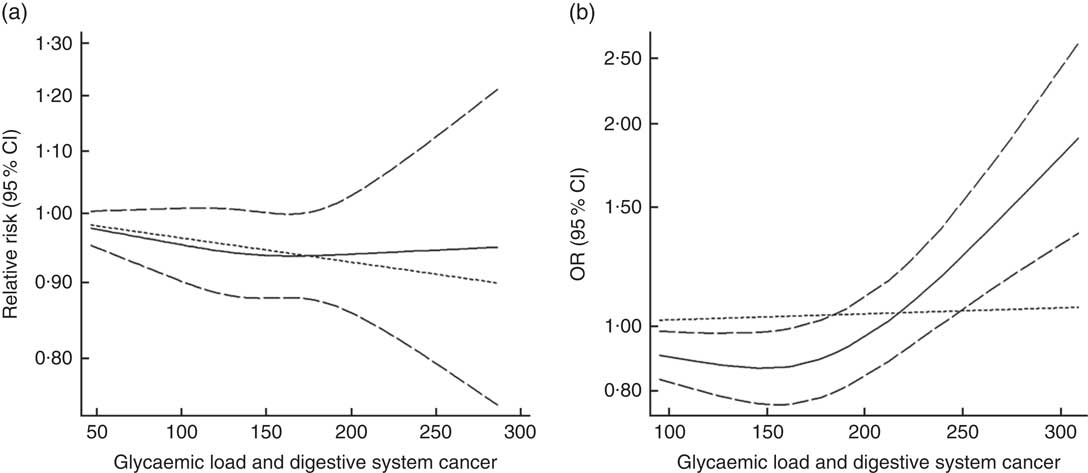
Fig. 10 Summary non-linear dose–response curves on glycaemic load and digestive system cancers: (a) cohort studies; (b) case–control studies.
Subgroup analyses
We also conducted subgroup analyses for prospective cohort studies and case–control studies separately (Table 3). For prospective cohort studies, carbohydrate intake and GL were not associated with different types of digestive system cancer (oesophageal cancer, gastric cancer, colorectal cancer, liver cancer and pancreatic cancer), while GI was associated with oesophageal cancer and colorectal cancer (summary RR=1·46, 95 % CI 1·10, 1·92; summary RR=1·09, 95 % CI 1·03, 1·16). In addition, a significant positive relationship between GI and digestive system cancers was observed among American people (summary RR=1·14, 95 % CI 1·08, 1·21). For case–control studies, GL was associated with colorectal cancer, and a significant positive relationship between GL and digestive system cancers was observed among European people. The results of subgroup analyses indicated that case–control studies revealed larger heterogeneity between studies than cohort studies. The heterogeneity was mainly driven by large amounts of included estimates, area and recall and selection bias from case–control design.
Table 3 Subgroup analyses of carbohydrate intake, glycaemic index and glycaemic load and digestive system cancers (Relative risks (RR)/odds ratios and 95 % confidence intervals)
N/A, not available.* P value for heterogeneity test.
Discussion
The results of cohort studies suggested that high GI was modestly associated with the risk of digestive system cancers with no heterogeneity. In the dose–response analysis, the risk of digestive system cancers increased by 3 ‰ for every 10-unit increase in GI. The association was weak but significant. The results of the case–control studies also indicated a statistically significant association between GI and digestive system cancers on linear dose–response analysis and showed a substantial increasing curve on non-linear dose–response analysis.
The results of cohort studies and case–control studies both indicated that high dietary carbohydrate intake and GL were not related to digestive system cancer risk, according to the results of common meta-analyses and linear dose–response analyses. Nevertheless, the non-linear dose–response analysis of case–control studies revealed an increase in cancer risk with increasing units of GL, indicating potential risks associated with extremely high-GL foods (e.g. above 250 units per d).
Subgroup analyses of cohort studies revealed that GI was particularly associated with oesophageal cancer and colorectal cancer. This finding updated the results of Aune et al. ( Reference Aune, Chan and Lau 13 ). In their study, there were no statistically significant associations between GI or GL and colorectal cancer risk. Other findings were comparable with those of previous meta-analyses( Reference Aune, Chan and Vieira 9 – Reference Choi, Giovannucci and Lee 12 ), though these studies focused on values of the highest compared with the lowest categories only. In addition, we found that individuals from America with high GI had greater risk of digestive system cancer.
We draw several inferences that may be likely explanations for the primary mechanisms of the moderate to weak associations between dietary carbohydrate, GI or GL and the risk of digestive system cancers. Hyperinsulinaemia, insulin-like growth factor (IGF) and insulin resistance are thought to be key mediators associating dietary and lifestyle factors with carcinogenesis, via improper activation of oxidative stress and inflammation( Reference Renehan, Zwahlen and Minder 56 , Reference Montesi, Mazzotti and Moscatiello 57 ). Elevated insulin levels could suppress IGF-binding protein or increase production of insulin receptors, thereby improving the bioavailability of IGF-I sequentially( Reference Gong, Ma and Sinyuk 58 ). Increased activation of the IGF-signalling pathway may mediate the development and progression of many types of cancer by a series of downstream signalling proteins, including insulin receptor substrate, phosphoinositide, Akt and extracellular signal-regulated kinase( Reference Pollak 59 , Reference Gao, Chang and Jallal 60 ). In addition, reduced signalling and down-regulation of IGF-I receptor expression was found to inhibit tumour growth( Reference Yuen and Macaulay 61 ). Hyperinsulinaemia was hypothesised to contribute more to tumour development and progression than was hyperglycaemia( Reference Choi, Giovannucci and Lee 12 ). Insulin index is another approach to quantify the postprandial secretion of plasma insulin( Reference Holt, Miller and Petocz 62 ), a factor that is more efficient for assessing the insulin response than is carbohydrate amount or GL( Reference Bao, de Jong and Atkinson 63 ). GI and GL make relatively moderate contributions to the overall insulin exposure.
Measurement errors in the assessment of carbohydrate intake, GI and GL may bias the effect estimates. We speculated that the bias mainly came from the difference between food intake and actual absorption and between cooked food weighing and raw food weighing. In many cases, the actual intake would be lower than the food intake. Although validated FFQ were used to assess the quantity and frequency of intakes, semi-quantitative questionnaires were widely used and some FFQ were not specifically designed to assess dietary GI and GL. Moreover, several FFQ used in the included studies are based on only a limited number of food items. Self-reported intake measured by FFQ was also likely to bringing in measurement errors. Various methods of segregation of carbohydrate, GI and GL (e.g. quartiles, quintiles, tertiles) were applied in the included studies. All these may reflect different dietary habits among people in different areas, complicating efforts to make corrections of measurement errors. How to reduce the measurement errors needed further study.
High heterogeneity was detected across studies in our meta-analysis. Various types of cancer were assumed to be the most probable sources of heterogeneity. Though cohort design minimises possibility of recall and selection bias when compared to case–control design, some excellent case–control studies could not be ignored. Among them, there was the US Multi-Center study( Reference Li, Petrick and Steck 22 ), with more than 1000 patients with oesophageal cancer and gastric cancer, the National Enhanced Cancer Surveillance study( Reference Hu, La Vecchia and Augustin 16 ), with 20 384 patients with various types of cancer, a study from China, with nearly 2000 patients with colorectal cancer( Reference Huang, Fang and Xu 19 ) and others. Furthermore, the meta-regression and indispensable subgroup analyses were conducted in our meta-analysis to reduce the possible sources of heterogeneity from types of cancers and areas. Random effects models were used to take heterogeneity into account. The possible explanations of high heterogeneity were that a large number of studies worldwide were included in the meta-analysis, with different dietary questionnaires, and recall and selection bias deriving from case–control design. Furthermore, adjustment for potential confounding factors across the included studies was discrepant. This may introduce residual confounding factors.
This meta-analysis had several limitations. First, as described above, measurement error, non-specific FFQ and high heterogeneity across case–control studies are difficult to avoid and correct. Second, the limited number of studies for oesophageal cancer and liver cancer could not allow us to draw conclusive summaries. Furthermore, the dose–response analyses for oesophageal cancer and gastric cancer could not be conducted because of lack of sufficient data. Third, we extracted the combined estimates from the original studies if provided. However, some studies provided independent results according to sex, and we extracted the results separately. Fourth, most of the studies did not provide valuable information with regard to the dietary carbohydrate substitutions (e.g. saturated fat) for the result on total carbohydrate intake. Finally, there were no relevant studies regarding other types of digestive system cancers. Thus, our results should be interpreted with caution.
Our study also has some strength. First, there was a large number of original studies and cases to increase statistical power in the meta-analysis (approximately 3·4 million population, including approximately 33 000 digestive system cancers). Second, to our knowledge, this was the first meta-analysis summarising the evidence on the association of dietary carbohydrate intake and risk of digestive system cancers, as was the first meta-analysis presenting a non-linear dose–response association between carbohydrate intake, GI and GL and risk of digestive system cancers. Third, meta-regression and subgroup analyses were applied to further strengthen the results. Publication bias was unlikely to influence our outcome appreciably according to the results of Begg’s and Egger’s tests. Finally, the included studies are of high quality for analysis, and the sensitivity analyses indicated robust results that were not overly affected by one publication.
We conclude cautiously that high GI could increase the risk of digestive system cancers based on cohort studies, and the results from case–control studies helped support and supplement this conclusion. The government could lead people to form life habits of low-GI diet and suggest food industry to choose low-GI material to reduce the risk of digestive system cancers. Further studies are needed to study other types of digestive system cancer and to provide specific data for dose–response analysis.
Acknowledgements
The authors thank researchers of the included articles for information relevant to the analysis.
This work was supported by the Soft Science Key Project of the Science and Technology Department of Zhejiang Province (grant no. 2019C25009), the Key Project of Social Science Planning in Hangzhou City (grant no. hzjz20180110), the Soft Science Key Project of Hangzhou Municipal Science Committee (grant no. 20160834M03) and Chiatai Qingchunbao Pharmaceutical Co. Ltd (grant no. QCB-YJS-20180052). All the funding had no role in the design, analysis or writing of this article.
X. C., M. T. and Xi. L. conceived and designed the study; X. C. and Xu. L. acquired and analysed the data; X. C. and Xu. L. interpreted the data and drafted the manuscript; C. L., Y. X. and M. Z. prepared figures. Xi. L. and W. Y. reviewed and corrected the manuscript. All authors approved the final version to be published.
The authors declare that there are no conflicts of interest.
Supplementary material
For supplementary material/s referred to in this article, please visit https://doi.org/10.1017/S0007114519000424