


Bangladesh is one of few countries where sex differences in life expectancy and child survival do not reflect women’s biological advantage. These sex differences have been attributed to discrimination against girls and women, and to mothers’ low social status and lack of power within the household(Reference Mathers, Iburg, Salomon, Tandon, Chatterji, Ustün and Murray1–Reference DeRose, Das and Millman3). The present study used a large data set of Bangladeshi children’s heights and weights to explore whether anthropometry, the measurement of the human body, can be used as a tool to examine gender discrimination.
There is substantial evidence that girls receive less food and medical care than boys, and that girls are more likely to die within their first five years of life than boys(Reference Mitra, Rahman and Fuchs4–Reference Rahman and DaVanzo15). Demographic surveillance data from Bangladesh demonstrate that, in the 1980s, girls were 1·8 times more likely to die than boys. The added risk of death was due mainly to severe malnutrition and diarrhoeal diseases(Reference Fauveau, Koenig and Woijtyniak16) and varied by birth order and family composition(Reference Muhuri and Menken17, Reference Muhuri and Preston18). During the 1990s the gender gap in mortality gradually narrowed, with boys retaining only a small advantage, particularly within certain subgroups(Reference Ahmed, Bhuiya, Rana, Hadi, Mahmud, Salam and Chowdhury19, 20). However, despite recent improvements, long-term discrimination against girls has led to skewed population ratios and estimates of several million ‘missing females’ on the sub-continent(Reference Sen11, Reference Klasen and Wink21, Reference Coale22).
Anthropometry has the potential, in theory at least, to measure gender discrimination. This is because differences in the growth between boys and girls, beyond those dictated by biology, are thought to reflect underlying inequalities in diet and health care. Anthropometric data from nutritional surveys in Bangladesh have not, however, reflected the patterns of gender discrimination shown in mortality and demography data. Results from national surveys measuring the height and weight of Bangladeshi children have not revealed any sex differences in growth(Reference Coale22–24). This apparent discrepancy between nutritional data and mortality data is thought to be explained by the growth references used to calculate standardized nutritional indices, such as Z-scores(Reference Moestue, de Pee, Hall, Hye, Sultana, Ishtiaque, Huq and Bloem25).
The recent launch of the new WHO growth standards presents a unique opportunity to examine the performance of anthropometry in capturing gender discrimination, as the standards’ practical application is currently being demonstrated and debated worldwide. The WHO standards describe the optimum growth of children (hence the word ‘standard’ is used instead of ‘reference’) and are replacing the old international National Center for Health Statistics (NCHS) reference(Reference de Onis, Garza, Victora, Bhan and Norum26, Reference Hamill, Drizd, Johnson, Reed, Roche and Moore27). The standards are based on the growth of children from Brazil, Ghana, India, Norway, Oman and the USA, who were purposively selected because they were born into an ‘optimal environment’, including being breast-fed according to official recommendations.
In the present paper, the linear growth of a large sample of Bangladeshi children (>500 000) aged 6–59 months is analysed using the WHO standards and, for comparison, the NCHS and 1990 British growth references (UK90) are also used to calculate Z-scores. The height-for-age Z-score is a measure of chronic malnutrition (‘stunting’) thought to be the most sensitive indicator of longer-term discrimination in health care and feeding. Trends in stunting are examined from 1990 to 1999, a decade during which gender discrimination in Bangladesh is thought to have diminished(Reference Trapp, Williams, Menken and Fisher28). The primary aim of the analysis is not to describe the growth of Bangladeshi children, but to use the data as a ‘test population’ to explore the capacity of anthropometric tools – three growth norms – to detect gender differences in growth. The focus of the analysis is on the group aged 6–23 months, as this is the age at which gender differences in health and nutrition have been shown to emerge due to an increased reliance on non-breast milk and vulnerability to disease(Reference Chen, Huq and D’Souza9, Reference D’Souza and Chen10, Reference Mitra, Rahman and Fuchs29). The ‘plausibility’ of growth curves is determined in the light of existing evidence for gender discrimination in Bangladesh, and the assumption is made that if both boys and girls were cared for equally their anthropometric status should, as a population average, be the same.
Methods
The data were collected in Bangladesh between 1990 and 1999 by the Nutritional Surveillance Project (NSP) of Helen Keller International (HKI) and the Institute of Public Health Nutrition. The NSP collected data every two months on randomly selected samples of children in rural Bangladesh. A detailed description of the sampling methodology is available elsewhere(Reference Moestue, de Pee, Hall, Hye, Sultana, Ishtiaque, Huq and Bloem25, 30).
A household was eligible for study if it had at least one child aged 6–59 months and if the mother was present. If the child was physically disabled or bed-ridden due to illness, the household was excluded. The child’s date of birth reported by the mother was recorded. If the mother did not know the exact date of birth, it was estimated using a Bangla calendar and a list of notable events. The recumbent length of each child aged 6–23 months and the standing height of each child aged 24–59 months were measured using a locally constructed and calibrated length board to a precision of 0·1 cm.
Z-scores of height-for-age were estimated with respect to three growth norms: the NCHS 1978 reference, the British 1990 reference (UK90) and recent WHO 2006 standards. The data set used for the present analysis has previously been used by the author to examine patterns of Z-scores calculated using the NCHS, UK90 and CDC references(Reference Moestue, de Pee, Hall, Hye, Sultana, Ishtiaque, Huq and Bloem25). This existing data set contained 504 358 observations with NCHS and UK90 Z-scores within the range available for analysis: children with Z-scores less than −6 or greater than 4 were excluded from the analysis because the validity of the measurement was questioned. The age of each child had been calculated by subtracting the date of the visit from the date of birth and then truncating to the whole month of age. NCHS Z-scores had been calculated with the Anthro computer software (Centers for Disease Control and Prevention, Atlanta, GA, USA) and the UK90 Z-scores with the British 1990 growth reference obtained from the Child Growth Foundation (London, UK). WHO Z-scores were calculated using the existing data set and an SPSS macro available on the WHO website (http://www.who.int/childgrowth), of which 502 409 observations had Z-scores within the stated range available for analysis. WHO and UK90 Z-scores were re-generated and double-checked using the ‘LMS growth’ add-in (developed by the Institute for Child Health, London, UK; available online at http://www.health-for-all-children.co.uk/pro.epl?DO=PRODUCT&WAY=INFO&ID=185) within the Excel software package (Microsoft Corp., Redmond, WA, USA). All of the Z-scores generated were length-based for children below 24 months of age and height-based otherwise.
The mean and standard deviation of Z-scores of height-for-age and the percentage of stunted children were calculated for each of the three norms, and separately for each sex and month of age. All children with Z-scores more than 2sd below the median of the reference population were classified as stunted. Student’s t test was used to compare means. A P value of less than 0·01 was considered to be statistically significant. All statistical analyses were done using the SPSS statistical software package version 15 (SPSS Inc., Chicago, IL, USA).
The growth curves generated for boys and girls were assessed primarily according to their shape (i.e. an assessment of growth faltering or catch-up with age) and secondly according to their position relative to each other (i.e. a simple comparison of average Z-score or stunting prevalence at a specific age). The former method is preferable because sex differences are cumulative in nature, and therefore one would expect to observe a gradual change with age. Nevertheless, it is recognized that the latter method is more commonly used in nutritional surveys where small sample sizes prevent the generation of smooth growth curves by age.
Results
Figure 1 shows average height-for-age Z-scores of Bangladeshi boys and girls as calculated by the WHO standards and NCHS and UK90 growth references by month of age.
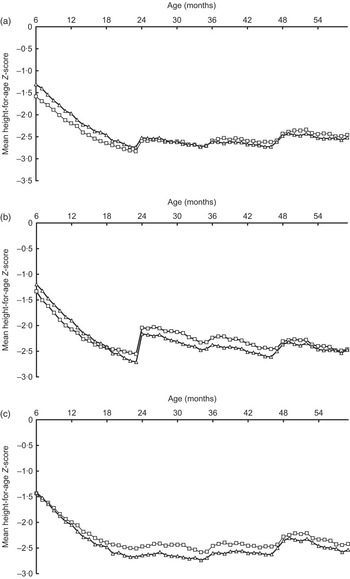
Fig. 1 Mean height-for-age Z-score of Bangladeshi boys (–□–) and girls (–▵–) aged 6–59 months, estimated using three growth norms: (a) the 2006 WHO standards, (b) the 1978 National Center for Health Statistics reference and (c) the 1990 British growth reference
Growth of boys and girls aged 6–23 months according to the WHO standards
Girls are better nourished than boys from 6 to 23 months according to the WHO curves (Fig. 1(a)). The difference is greatest for the youngest age group, 6–11 months, where the prevalence of stunting is 44 % for boys (n 22 713) and only 36 % for girls (n 26 759). The average Z-score at 6 months was −1·58 for boys and –1·31 for girls. However, the shape of the curve indicates that girls’ nutritional advantage diminishes with age, with girls’ Z-scores decreasing faster than boys’. For example, from 18 to 23 months of age, girls’ average WHO Z-score was lower by 0·06sd from one month to the next, compared with 0·04sd for boys. In summary, the WHO curves for children aged 6–23 months show that girls start off being better nourished than boys at 6 months, but falter faster as they grow older. The faster deterioration of girls’ nutritional Z-scores during the weaning period is plausible given what is known about discrimination against girls in child care. However, while the shape of the growth curves is deemed realistic, the absolute differences in sex-specific Z-scores, and hence the relative position of boys’ and girls’ growth curves, are deemed less plausible.
Comparison of growth at 6–23 months of age according to the three norms
The WHO, NCHS and UK90 norms all suggest that the nutritional status of Bangladeshi children deteriorates from 6 to 23 months of age, and that this occurs faster for girls than boys (Fig. 1). However, important differences exist between the three sets of growth curves. First and most important for the current analysis, Fig. 1 shows that all three norms disagree on the relative position of the sex-specific growth curves: the WHO standards show that girls are better off, the UK90 reference shows that boys are better off, while the NCHS presents a mixed picture. Second, while the NCHS and WHO curves have a disjunction at 24 months, the UK90 curves do not. The disjunction is a natural consequence of the change in measurement method from recumbent length to standing height of children, and the lack of a disjunction in the UK90 reference is due to the way the reference was created, with length/height differences around 24 months of age having been smoothed out. Finally, the NCHS curves display an ‘18-month crossover’: girls at 6 months are less stunted than boys by an average of 0·14 Z-scores but the growth curves gradually converge and cross at 18 months of age.
Comparison of growth at 24–59 months of age according to the three norms
All three sets of growth curves suggest that Bangladeshi children remain poorly nourished throughout their pre-school years. They all display wave-like patterns in mean height-for-age Z-scores, probably due to rounding in reported age. The NCHS curves are generally more downward than the WHO and UK90 curves. Use of the NCHS reference thus implies that children continue to falter in height well into their sixth year of life, whereas the WHO and UK90 curves suggest that both boys and girls become a little less malnourished with age. In terms of the relative positioning of boys’ and girls’ curves, the WHO curves suggest that boys’ nutritional status improves more than girls’. Meanwhile the opposite is seen with the UK90 and NCHS curves, where girls narrow the gap with age by becoming better nourished. The shape of the WHO curves is thus unique in showing that girls consistently falter faster or catch up slower than boys from 6 to 59 months of age.
Trends 1990–1999
Figure 2 presents trends in stunting among boys and girls aged 6–23 months. As expected, use of all three norms produces downward trends in stunting during this decade of economic improvement. Use of the WHO standards and the NCHS reference suggests that girls have been less stunted than boys throughout the decade. Although the size of the sex difference in stunting varied from year to year, the WHO and NCHS curves suggest that girls had a greater advantage over boys at the end of the decade than the beginning, and that this advantage increased steadily from 1995 to 1999. For example, the WHO curves suggest that girls were less stunted than boys by just 3·3 % in 1995, increasing to 7·8 % in 1999. Only the UK90 chart displays a plausible trend in stunting over the 1990s, with girls being more stunted than boys throughout the decade and the gender gap gradually narrowing from the mid-1990s: from 5·2 % in boys’ favour in 1995 to just 0·9 % in 1999.

Fig. 2 Stunting prevalence in Bangladeshi boys (–□–) and girls (- -▵- -) aged 6–23 months by year (1990–1999), estimated using three growth norms: (a) the 2006 WHO standards, (b) the 1978 National Center for Health Statistics reference and (c) the 1990 British growth reference
Discussion
The present study explores whether anthropometry can be a tool to assess gender discrimination by using three different growth norms – WHO, NCHS, UK90 – to calculate the linear growth of children and examine sex differences according to age (6–59 months) and years (1990–1999). The assumption is made that if boys and girls were cared for equally their anthropometric status would, as a population average, be the same. The data set is extraordinarily large (>500 000), allowing for the generation of smooth curves and the detection of small age and sex differences. The children in the data set were born in Bangladesh during the 1980s and 1990s, a place and time known to exhibit gender discrimination with implications for children’s health and growth.
Three key findings emerge from our study. First, the study shows that conclusions on sex differences in growth of Bangladeshi children depend on the norm used: the three sets of growth curves present conflicting pictures of the relative growth of girls and boys, in relation to both age and time. Second, the study shows that conclusions also depend on the method of analysis used to examine the growth curves, whether in relation to their shape (i.e. an assessment of growth faltering or catch-up with age that captures cumulative and gradual sex differences) or their relative position (i.e. a simple comparison of average Z-score or stunting prevalence at a specific age). Finally, the study highlights the value of using a large test population to explore a specific application of a growth norm, which may also serve to expose other important issues, such as the continued problem of age determination and digit preference in nutrition surveys, so clearly shown in the curves presented here.
The focus of the study has been on the application of the WHO standards because these are recommended for international use. It is therefore encouraging to find that the WHO standards uniquely present Bangladeshi girls as faltering faster or catching up slower than boys throughout their pre-school years, a finding consistent with the literature. Yet confusion arises if one also compares Z-score averages for a specific age group, a cruder approach still commonly used in the field. For example, use of the WHO standards for children 6–23 months of age gives girls higher average Z-scores than boys, implying they are better nourished and thereby contradicting the interpretation yielded by an assessment of the curves’ shapes.
There are implications of these findings, both technical and practical. First, there is a need for further research to examine the causes behind the differences in the growth curves produced using the three norms, bearing in mind that differences reflect variations not only in the reference populations used but also the methodologies applied to construct the growth curves. Such research should also examine sex differences in growth prior to 6 months of age. Meanwhile, the practical implications relate to the fact that, throughout the world today, anthropometric data are routinely collected and analysed. Thus there exists potential, in theory at least, to ensure that gender discrimination is monitored and reported upon as a matter of course. Further research and debate are needed to determine whether and how this can be achieved, while bearing in mind the realities of data collection. Most nutrition surveys have small sample sizes that rarely permit the development of the smooth growth curves necessary for a thorough assessment of growth faltering or catch-up with age.
In Bangladesh, as in other Asian countries, the problem of gender discrimination cannot be overstated. Even today there is evidence for male bias in the provision of food and health care for Bangladeshi children, the population is skewed towards the male, and there are concerns that recent health reforms have not sufficiently taken gender issues into account(20, Reference Hausman, Tyson and Zahidi31–Reference Choudhury, Hanifi, Rasheed and Bhuiya33). It is urgent that gender gets back on the agenda. The ongoing global process of implementing the new WHO international growth standards, currently giving rise to new challenges and triggering debate(Reference de Onis, Garza, Onyango and Borghi34–Reference Seal and Kerac36), presents a real opportunity to explore the role of anthropometry for gender analysis. Further research is needed to corroborate or dispute the findings presented here and to help establish whether and how the WHO international standards can most meaningfully be used to measure and monitor gender discrimination.
Acknowledgements
There are no funding sources or conflicts of interests to be reported. Thanks go to the NSP team at HKI in Bangladesh for producing these valuable data. Special thanks go to Martin Bloem for his insight and advice on the analysis.


