


Alterations in body composition and metabolism occur following spinal cord injury (SCI)(Reference Farkas, Pitot and Gater1,Reference Bertoli, Spadafranca and Merati2) . Adiposity increases while lean mass (LM) below the level of injury decreases, resulting in neurogenic obesity(Reference Bertoli, Spadafranca and Merati2–Reference Spungen, Adkins and Stewart5). This reduction in LM with concomitant decreases in activity levels and impaired sympathetic nervous system activity results in a lowering of BMR and daily energy needs following SCI(Reference Spungen, Bauman and Wang6,Reference Nightingale and Gorgey7) . Persons with SCI report total energetic intakes lower than able-bodied (AB) individuals(Reference Farkas, Pitot and Gater1,Reference Nightingale and Gorgey7,Reference Silveira, Winter and Clark8) in addition to lower measured BMR and calculated total energy expenditure(Reference Gater9,Reference Gorgey, Caudill and Sistrun10) . In spite of this reduced energetic intake, obesity is more prevalent among persons with chronic SCI compared with AB persons(Reference Spungen, Wang and Pierson4,Reference Spungen, Adkins and Stewart5,Reference Gorgey and Gater11) . Across studies, it has been found that the prevalence of obesity varies from 40 to 66 % among individuals with SCI, and consequently, obese individuals with SCI are susceptible to a wide range of health consequences(Reference Rajan, McNeely and Warms12,Reference Gill, Sumrell and Sima13) .
Persons with chronic SCI have an increased risk for obesity-related cardiometabolic diseases, including dyslipidemia, glucose intolerance and diabetes mellitus, central obesity, systemic inflammation and mitochondrial dysfunction(Reference Gill, Sumrell and Sima13–Reference Sumrell, Nightingale and McCauley17). Additionally, reduced mobility due to chronic SCI predisposes individuals to adipose tissue accumulation and further increases the risk for obesity-related chronic diseases(Reference Gater9,Reference Bauman and Spungen18) . To counteract this increased risk, it is recommended that those with SCI engage in regular physical activity and modify their dietary habits(Reference Gorgey, Caudill and Sistrun10). However, recommended nutritional intake after SCI requires an accurate measurement of metabolic rate and appropriate classification of SCI-specific obesity(Reference Goldsmith, Holman and Puri19). The purpose of this review is to summarise the current SCI literature pertaining to metabolic rate and systematically highlight those differences in measuring BMR compared with RMR in persons with SCI. Therefore, researchers and clinicians should rely on measured or predicted BMR when developing dietary regimens in order to promote weight loss in persons with SCI as RMR may increase the risk of overfeeding.
Management of neurogenic obesity after spinal cord injury
The lack of innervation to paralysed limbs results in extensive muscle atrophy and progressive accumulation of FM and ectopic adiposity(Reference Gorgey and Gater3); which in combination with a sedentary lifestyle is responsible for dysregulated carbohydrate, protein and fat metabolism(Reference Perret and Stoffel-Kurt20). The reduction in lean body mass, lipolysis and sympathetic nervous system dysregulation causes an alteration in energy balance, which may lead to obesity-related complications(Reference Buchholz and Pencharz21). Furthermore, several studies have also reported that individuals with SCI consume relatively more dietary fat than recommended(Reference Perret and Stoffel-Kurt20,Reference Groah, Nash and Ljungberg22–Reference Gorgey, Mather and Cupp24) . It is worth noting that exercising lower extremity muscles using functional electrical stimulation predominantly relies on carbohydrate consumption over fat as a primary source of energy(Reference Gorgey and Lawrence25). Encouraged fat utilisation may require low-intensity functional electrical stimulation or neuromuscular electrical stimulation resistance training(Reference Gorgey, Khalil and Gill15,Reference Gorgey, Mather and Cupp24–Reference Gorgey, Lai and Khalil26) . The latter has been shown to be effective in reducing ectopic adiposity, primarily intramuscular fat or visceral adiposity.
Furthermore, it is important to note that unchanged dietary habits following SCI without considering the balance between energetic intake and energy expenditure may lead to weight gain and predisposes individuals with SCI to obesity and cardiometabolic risk factors(Reference Gill, Sumrell and Sima13,Reference Felleiter, Krebs and Haeberli27,Reference Nash and Bilzon28) . Therefore, an accurate measure of basal metabolic needs or BMR through indirect calorimetry serves as an important strategy for developing personalised nutritional plans for individuals with SCI and preventing obesity-related comorbidities. Obese individuals with SCI (BMI > 22 kg/m2) are predisposed to a wide range of health consequences including but not limited to glucose intolerance, insulin resistance, diabetes mellitus, hypertension, pressure ulcers and CVD(Reference Gater9,Reference Nash and Bilzon28,Reference Bauman and Spungen29) . Therefore, it is important to identify strategies to mitigate these adverse effects following SCI. To appropriately address this heightened obesity-related risk after SCI, SCI-specific classifications must be used because relying on AB classification systems may underestimate the prevalence of obesity in persons with SCI. The traditional understanding of obesity was previously defined as an excess accumulation of percent body fat with cut-off values for men greater than 22 % in men and 35 % in women(Reference Gater9). However, since the 1990’s the WHO defined obesity as an increase in BMI calculated by dividing an individual’s weight (kg) by height squared (m2)(30). AB individuals with a BMI greater than or equal to 30 kg/m2 are considered obese and at risk of cardiovascular diseases, yet BMI is still often applied to persons with SCI, which can severely underestimate obesity. Laughton et al., showed that current BMI cut off values (≥ 30 kg/m2) fail to identify obese individuals in the SCI population and clearly provided evidence showing the need to lower BMI cut-off values (≥ 22 kg/m2)(Reference Laughton, Buchholz and Martin Ginis31). Gater et al. supported this lower BMI cut-off in a sample of 473 veterans that using the WHO standard of BMI (≥ 30 kg/m2), 26·9 % of participants were classified as obese, whereas reducing the BMI threshold to 22 kg/m2 showed an increase in obesity by 76·7 %(Reference Gater, Farkas and Berg32). It is important to note that the use of BMI as a determinant of obesity for SCI populations does not take into account fat-free mass (FFM), fat mass (FM) or percentage of intramuscular fat. Sumrell et al., developed an SCI-specific waist circumference cut-off value of 86·5 cm for individuals with motor complete SCI. The authors reported that seated/supine circumferences are associated with central adiposity and biomarkers of cardiometabolic disease risk in persons with SCI(Reference Sumrell, Nightingale and McCauley17). In addition, quantification of regional abdominal adiposity after SCI using MRI is important considering the cardiometabolic risk factors associated with increasing visceral adiposity. A report by Gorgey et al. suggested that a ratio of visceral adipose tissue to subcutaneous adipose tissue greater than 0.4 may increase cardiometabolic risk factors in individuals with SCI(Reference Gorgey, Mather and Poarch33). Body composition assessment using dual X-ray absorptiometry (DXA) is widely used to assess whole-body and regional composition FFM and FM, and the precision of quantifying total and regional compartments has been previously determined(Reference Gorgey, Cirnigliaro and Bauman34). Further, because obesity is so prevalent after SCI, it is necessary to accurately quantify energy expenditure following SCI to determine proper energetic intake and prevent over-feeding(Reference Oshima, Berger and De Waele35).
Indirect calorimetry
Indirect calorimetry is the primary method used to measure metabolic rate from measurements of oxygen consumption and carbon dioxide production. This is, in part, because indirect calorimetry is more practical and feasible due to the use of portable metabolic cart systems, allowing researchers to measure energy expenditure non-invasively in both acute and outpatient settings (See Fig. 1). Regardless of the method used, it is imperative to follow specific guidelines when measuring metabolic rate. For indirect calorimetry, proper calibration of the unit is important to ensure accurate measurements of BMR. In order to achieve an accurate BMR measurement, subjects require an overnight fasted rest for 10–12 h prior to measurement to minimise the contributions of thermic effect of food and physical activity. After the overnight fast, the subject is gently awakened in the early morning (∼06:00 AM) in a dark room with a thermoneutral environment (22–26°C) in order to ensure there is no thermoregulatory effect on heat production. BMR measurement proceeds by placing a clean canopy over the subject’s head while lying in a supine position for approximately 20 min (see Fig. 1). Metabolic cart systems are connected to a mixing chamber that exerts negative pressure to measure the continuous level of inspired and expired gas volumes produced by the participant (see Fig. 2). Acquisition of BMR requires approximately ∼20–25 min, and it is advisable to closely monitor the respiratory exchange ratio (VCO2/VO2 = 0·70–0·82; Fig. 2(a). In contrast, a participant undergoing an RMR measurement does not require an overnight stay as only a short period of rest time is required for RMR measurement (10 to 20 min) prior to RMR acquisition(Reference Compher, Frankenfield and Keim36). As previously mentioned, BMR and RMR primarily differ in testing protocols, as both are non-invasively measured through indirect calorimetry. In the literature, the terms BMR and RMR are often used interchangeably with basal and resting energy expenditure (BEE and REE). Standardisation of the terminology used in the literature should be considered, as the use of different terminology may lead to confusion.

Fig. 1. Indirect calorimetry set up for measuring BMR in an individual with complete SCI. The test was administered in a dark thermoneutral environment (22–26°C). The subject is placed under a clear canopy with a plastic drape to eliminate air leakage, which is connected to a COSMED K4B2 mixing chamber.

Fig. 2. Representative figures displaying ventilatory breath-by-breath measurements and BMR. (a) VCO2 and VO2 (ml/min) continuous breath-by-breath measurement following an overnight fast (10–12 h) in a dark thermoneutral environment to measure BMR. The first 5 min are discarded (red portion), as determined by the RER ranging from (0·7 to 0·82). (b) BMR (kcal/d) calculated automatically by the COSMED software using the Weir equation (BMR kcal/d) = (VO2 × 3·941) + (VCO2 × 1·11) × 1440). The remaining 15 min (green) are averaged to provide the BMR. Note the oscillation in the measurements suggests that BMR across a 24-hour period may vary in persons with SCI.
BMR v. RMR
The imbalance between energy intake and expenditure is important for determining recommended individualised dietary plans that mitigate fluctuations in body weight after SCI. Energy intake can be defined as the total energy content of foods consumed, which also reflects the percentage of macronutrients (carbohydrates, protein, fat and alcohol) consumed daily(Reference Gater9). Recently, the Clinical Practice Guidelines on Identification and Management of Cardiometabolic Risk after SCI (PVA) developed recommended nutritional guidelines for individuals following SCI(Reference Nash, Groah and Gater37). The guidelines promote energetic assessment (BMR or RMR) using indirect calorimetry to accurately measure energy needs in persons with SCI. In addition, the Dietary Guidelines for Americans and the PVA guidelines focus on providing healthy dietary patterns rather than emphasising macronutrient restriction in diets following SCI. To accurately measure daily energy needs, total daily energy expenditure (TDEE) needs to be calculated using the following equation.
 $${\rm{TDEE = BMR}} \times {\rm{constant}}(1 \cdot 15)$$
This constant reflects both the thermic effect of food and non-leisure time physical activity(Reference Farkas, Gorgey and Dolbow38).
TDEE is the total energy used by an individual during a 24-hour period and is divided into three main components: BMR, thermic effect of food and physical activity energy expenditure. BMR is the largest contributor to TDEE (75–80 % in persons with SCI) and is defined as the minimum daily energy metabolism that individuals require to support essential functions of life, which include breathing, circulation, nutrient processing and cell production(Reference Gorgey, Caudill and Sistrun10,Reference Khalil, Gorgey and Janisko39) (see Table 1). Metabolic rate can be measured as BMR or RMR; however, it is important recognise the differences between these indices and understand that these terms are not interchangeable. RMR is defined as the energy required by the body in a resting condition as opposed to a basal condition. Both BMR and RMR are measured following an overnight fasting period of 8–12 h and require abstaining from exercise, caffeine, nicotine and food to remove the effect of thermogenesis carried on by the consumption of food.(Reference McMurray, Soares and Caspersen40,Reference Farkas, Sneij and McMillan41) . RMR is measured after the participant wakes up and travels to the testing site, undertaking a short resting period prior to the test being conducted. BMR is more precise than RMR due to a more stringent testing protocol and is measured in the morning upon awakening before the participant has performed any movement after an overnight fast for 10–12 h. A study by Wu et al. exemplified differences in BMR and RMR in 251 normal weight, overweight and obese AB individuals (BMR: 1429, 1609, 1778 kcal/d (1 kcal = 4.184 kJ) v. RMR: 1522, 1712, 1885 kcal/d, respectively)(Reference Wu, Mao and Zhang42). The current evidence clearly shows that BMR is lower in persons with SCI and accounting for this difference is of paramount significance in combating the prevalence of obesity in persons with SCI.
Table 1. BMR in spinal cord injury literature
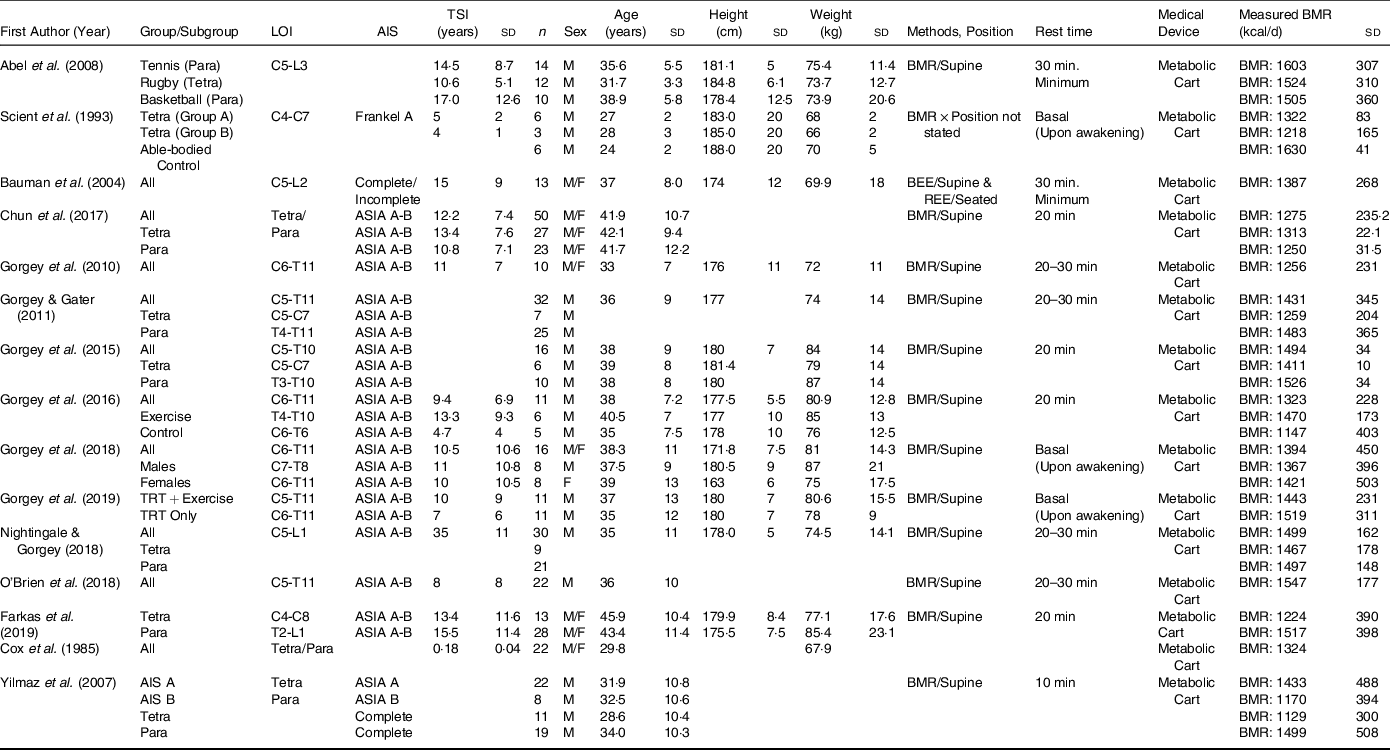
SCI, spinal cord injury; REE, resting energy expenditure; BEE, basal energy expenditure; LOI, level of injury; AIS, American Spinal Injury Association Impairment Scale; TSI, time since injury; Para, paraplegia; Tetra, tetraplegia; P, pressure; NP, no pressure; TRT, testosterone replacement therapy.
Blank spaces indicate data was not provided in the study; data are presented as mean ± standard deviation.
Differences between BMR and RMR
We comprehensively evaluated the studies that measured BMR(Reference Gorgey and Gater3,Reference Nightingale and Gorgey7,Reference Gorgey, Caudill and Sistrun10,Reference O’Brien, Graham and Chen14,Reference Gorgey, Khalil and Gill15,Reference Farkas, Gorgey and Dolbow38,Reference Farkas, Sneij and McMillan41–Reference Gorgey, Farkas and Dolbow49) (n=15; Table 1) and RMR(Reference Spungen, Bauman and Wang6,Reference Perret and Stoffel-Kurt20,Reference Gorgey, Mather and Cupp24,Reference Felleiter, Krebs and Haeberli27,Reference Bauman, Spungen and Wang45,Reference Alexander, Spungen and Liu50–Reference Sedlock and Laventure66) (n=22; Table 2) to accurately calculate the differences between both metabolic variables. In addition, the average height calculated for studies that measured BMR was 178·9 cm and 165·6 cm for studies that measured RMR. Weight distribution was also noted, as the BMR studies had an average weight of 75·4 kg and 80·5 kg for studies that measured RMR. The mean age for studies that measured BMR was 35·9 years and 40·5 years for studies that measured RMR. In both the studies that measured BMR and RMR, sex distribution was 90 % male and 10 % female. The criteria for classifying the studies into either BMR or RMR relied primarily on analysing the described methods to determine whether the SCI participants had BMR measured immediately upon awakening prior to any movement or an RMR measurement was performed after the subject wakes up and travelled to the testing site, and then undertakes a short resting period prior to assessment. We are aware that some of the reported studies referred to BMR as RMR; these studies based on the described methods accurately measured BMR(Reference Gorgey and Gater3,Reference Gorgey, Chiodo and Zemper47) .
Table 2. RMR in spinal cord injury literature
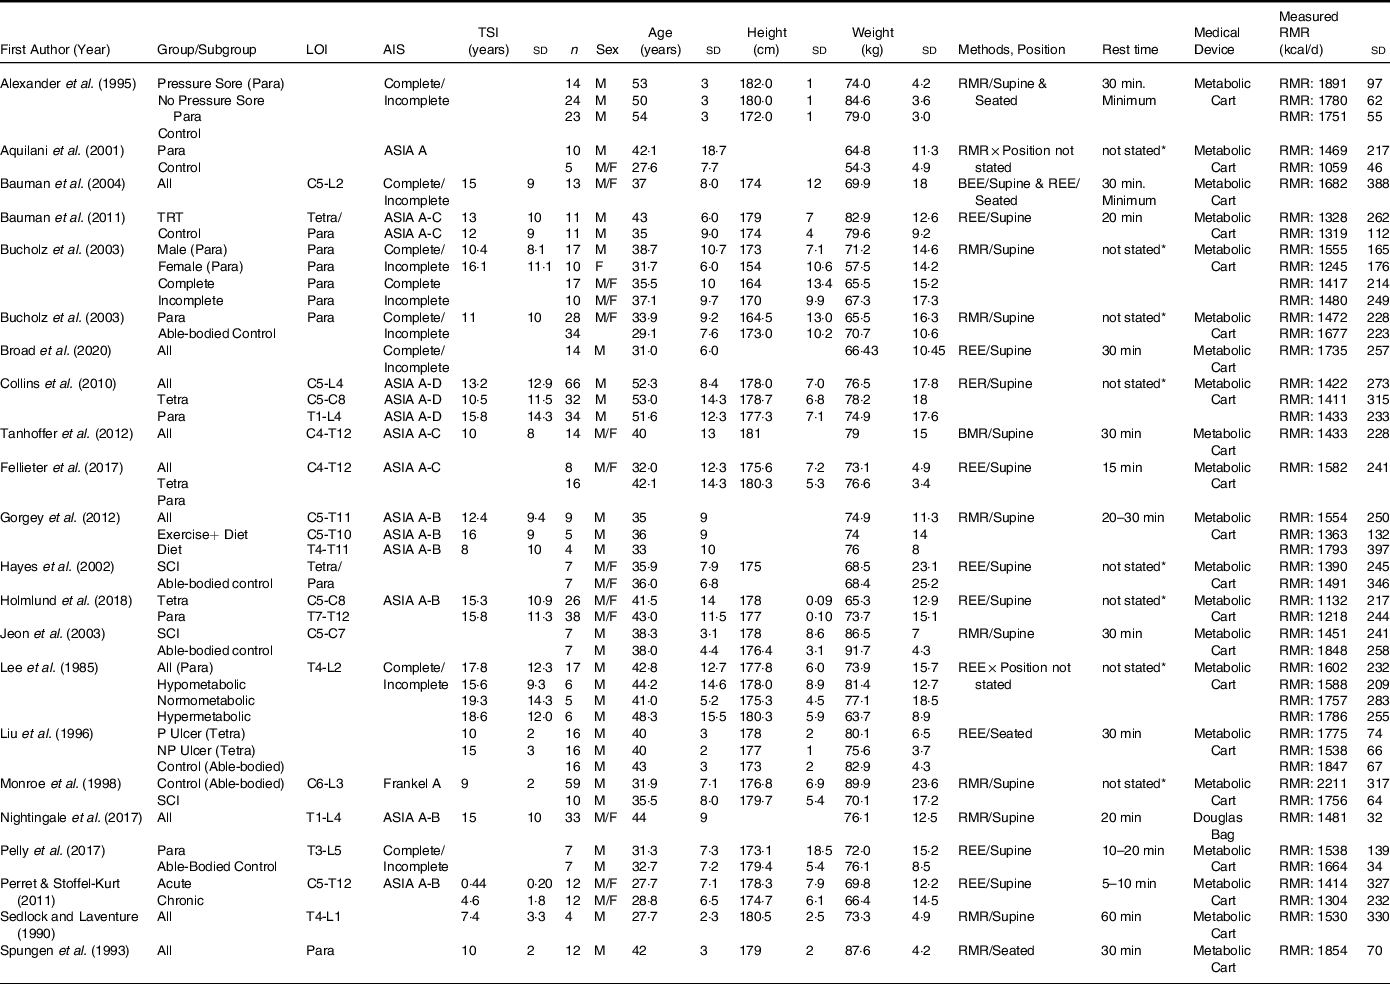
SCI, spinal cord injury; REE, resting energy expenditure; BEE, basal energy expenditure; LOI, level of injury; AIS, American Spinal Injury Association Impairment Scale; TSI, time since injury; Para, paraplegia; Tetra, tetraplegia; P, pressure; NP, no pressure; TRT, testosterone replacement therapy.
Blank spaces indicate data was not provided in the study; data are presented as mean ± standard deviation.
The results showed that BMR was equivalent to 1397 ± 139 kcal/d, whereas RMR is equivalent to 1527 ± 188 kcal/d. This means that BMR is 9 % lower than RMR with an absolute difference of 130 kcal/d (the difference between 1527 and 1397 kcal/d). This difference can be translated to 3900 kcal/month or 46 800 kcal/year. Therefore, this overestimation by relying on RMR may lead to a 6·1 kg (0·5 kg = 3500 kcal) increase in body weight.
The reduction in muscle and LM after SCI has been well established in comparison to the non-injured population(Reference Bauman and Spungen18). However, the dramatic changes in muscle mass depend on several factors, including the level of injury and severity of the lesion, among others(Reference Singh, Rohilla and Saini67). For instance, Bauman et al. showed differences in BMR and RMR in thirteen pairs of monozygotic twins with and without SCI and reported higher RMR values (SCI twin: 1682 kcal/d v. non-SCI twin: 1854 kcal/d) in comparison to BMR values (SCI twin: 1387 kcal/d v. non-SCI twin: 1660 kcal/d)(Reference Bauman, Spungen and Wang45). Importantly, the authors demonstrated that RMR was 20 % higher than BMR in SCI twins, while RMR was found to be 11 % higher than the measured BMR for non-SCI twins. Both BMR and RMR were significantly lower in the twins with SCI compared with non-SCI twins, more specifically BMR was 18 % lower in SCI twins compared with non-SCI twins, while RMR was 10 % lower for SCI-twins. Importantly, when BMR and RMR were adjusted to FFM, BMR/FFM was not different between groups (SCI twin: 30·4 kcal/kg v. non-SCI twin: 29·9 kcal/kg), while RMR/FFM was 3·5 kcal/kg higher for SCI twins compared with non-SCI twins (SCI twin: 36·9 kcal/kg v. non-SCI twin: 33·4 kcal/kg). Likewise, when BMR and RMR were adjusted to body mass, (BMR: SCI twin: 20·4 kcal/kg v. non-SCI twin: 21·5 kcal/kg) and (RMR: SCI twin: 24·9 v. non-SCI twin: 24·2 kcal/kg) were not significantly different between both groups. Additionally, the authors found significant linear relationships between FFM with BMR and RMR for both SCI twins and non-SCI twins(Reference Bauman, Spungen and Wang45). Bauman and colleagues clearly demonstrated that following chronic paralysis, greater reductions in LM is directly related to the reduction in energy expenditure following SCI, and importantly the authors measured both BMR and RMR in the same sample of individuals, whereas all other studies evaluated either measured BMR or RMR(Reference Bauman, Spungen and Wang45). Similarly, Wu et al. examined differences in BMR and RMR in AB individuals and showed that in normal-weight AB individuals RMR was 7 % higher than BMR (112 kcal/d difference), which is slightly lower than the 11 % difference observed by Bauman et al. with the non-SCI group(Reference Wu, Mao and Zhang42,Reference Bauman, Spungen and Wang45) . In addition, RMR was 5 % higher for overweight individuals and 6 % higher than BMR for the obese group(Reference Wu, Mao and Zhang42). The authors also noted that the absolute BMR and RMR was significantly different for the three groups (normal weight, overweight, obese), but after adjusting to FFM no significant differences were found(Reference Wu, Mao and Zhang42).
In addition, there is a notable difference between the absolute metabolic rate in paraplegic compared with tetraplegic individuals. Gorgey et al. reported a difference of 224 kcal/d in BMR between tetraplegic and paraplegic participants; however, after adjustment to FFM, BMR was not different between both groups (29·4 v. 29·4 kcal/kg, respectively)(Reference Farkas, Sneij and McMillan41). A study by Yilmaz et al. also reported a significant difference of 370 kcal/d in BMR between tetraplegic and paraplegic participants, and BMR/LM was modestly 2·5 kcal/kg lower for the tetraplegic group (33·9 v. 36·5 kcal/kg, respectively)(Reference Yilmaz, Yasar and Goktepe68). Farkas et al. reported a significant difference in BMR between tetraplegic and paraplegic participants (1224: v. 1517: kcal/d, respectively), BMR/LM was not different between groups (29·9 v. 30·3 kcal/kg, respectively)(Reference Farkas, Gorgey and Dolbow38). In addition, Gorgey et al. reported a non-significant difference in BMR between tetraplegic and paraplegic participants (1411: v. 1526: kcal/d, respectively), and BMR/LM was 3·0 kcal/kg higher for the tetraplegic group(Reference Gorgey, Caudill and Sistrun10). However, a study by Collins et al. did not report any significant differences in RMR between tetraplegic and paraplegic participants (1411: v. 1433: kcal/d, respectively)(Reference Collins, Gater and Kiratli56). In addition, the authors did not measure LM or FFM, however when RMR was divided by body mass (kg), RMR/body mass was 1·1 kcal/kg lower in the tetraplegic group compared with the paraplegic group (18·0 v. 19·1 kcal/kg, respectively). Similarly, Chun et al. examined only motor complete SCI, and although a non-significant 63 kcal/d difference in BMR was demonstrated between tetraplegic and paraplegic participants (1313 v. 1250 kcal/d), BMR/FFM was 1·7 kcal/kg lower for the tetraplegic group compared with the paraplegic group (29·7 v. 31·4 kcal/kg, respectively)(Reference Chun, Kim and Shin46). Discrepancies in energy expenditure between these studies may be attributed to methodological differences, heterogeneity between samples (e.g., incomplete v. complete SCI), sample size and/or population demographics. For instance, Chun et al., Gorgey and Gater, Farkas et al. and Yilmaz et al. examined chronic motor complete SCI and measured BMR, whereas Collins et al. included both complete and incomplete SCI participants in their samples and measured RMR as opposed to BMR. The current findings may suggest that the metabolic rate is similar between paraplegic and tetraplegic groups after adjusting to total body mass, FFM and LM. However, it is worth noting that although the range in adjusted BMR to FFM or LM was narrow in some studies (0·0 to 0·5 kcal/kg of FFM or LM)(Reference Gorgey and Gater3,Reference Farkas, Gorgey and Dolbow38) , while other studies demonstrated a wider range from 2·5 to 9·0 kcal/kg of FFM between tetraplegic and paraplegic groups(Reference Gorgey, Caudill and Sistrun10,Reference Chun, Kim and Shin46,Reference Yilmaz, Yasar and Goktepe68) . As previously mentioned, differences in reported metabolic rate may be attributed to methodological differences, heterogeneity of the studied samples, sample size and population demographics/ethnicity.
Moreover, based on the available literature, we evaluated differences between both BMR and RMR between persons with paraplegia and tetraplegia. Six studies (6/24) evaluated BMR by level of injury, and persons with paraplegia showed an average BMR of 1462 ± 105 kcal/d, whereas tetraplegia had an average BMR of 1301 ± 124 kcal/d(Reference Gorgey and Gater3,Reference Nightingale and Gorgey7,Reference Gorgey, Caudill and Sistrun10,Reference Farkas, Gorgey and Dolbow38,Reference Chun, Kim and Shin46,Reference Yilmaz, Yasar and Goktepe68) . This 162 kcal/d (∼12 %) difference can be simply explained as lower LM in persons with tetraplegia compared with paraplegia(Reference Spungen, Adkins and Stewart5). Likewise, the two studies that evaluated RMR by level of injury showed that paraplegic individuals had an average RMR of 1326 ± 152 kcal/d, whereas tetraplegia had an average RMR of 1272 ± 197 kcal/d(Reference Collins, Gater and Kiratli56,Reference Holmlund, Ekblom-Bak and Franzén59) . The reported differences in RMR between individuals with paraplegia and tetraplegia can also be attributed to the fact that individuals with motor-complete tetraplegia experience a greater loss of LM. Singh et al. reported a 6 % lower LM in the trunk and ∼10 % lower LM in the arms for individuals with tetraplegia(Reference Singh, Rohilla and Saini67). Similarly, Rankin et al. reported that individuals with tetraplegia have a 13 % smaller trunk muscle cross-sectional area compared with those with paraplegia, with DXA trunk-LM predicting 37 % of the variance in BMR(Reference Rankin, O’Brien and Gorgey69). Such reductions in LM in individuals with tetraplegia are important to consider when organising dietary plans for individuals with SCI, as less metabolically active tissue can influence either BMR or RMR.
The differences in measured metabolic rate between tetraplegic and paraplegic individuals warrant the need for more research. Previous reports have shown that BMR is approximately ∼20 % lower compared with RMR in persons with SCI, while only ∼11 % lower than RMR in persons without SCI(Reference Farkas, Sneij and McMillan41,Reference Bauman, Spungen and Wang45) . Based on the current findings, BMR was found to be 9 % lower compared with RMR in persons with SCI. The discrepancy may be stemmed from classifying the reported studies into either BMR or RMR. Importantly, since RMR has been shown to be 20 % higher than BMR in SCI, using RMR as a predictor of energy expenditure instead of BMR in persons with SCI may overestimate dietary needs by roughly 400 kcal/d assuming a 2000 kcal/d diet, which could lead to inappropriate nutrient intake recommendations that may exacerbate the risk for obesity and secondary cardiometabolic complications(Reference Farkas, Sneij and McMillan41,Reference Bauman, Spungen and Wang45) . Moreover, previous reports have indicated that many individuals with SCI have a disproportionate energetic intake relative to their energy requirements, which consequently results in positive energy balance that may increase the risk of obesity in individuals with SCI(Reference Groah, Nash and Ljungberg22,Reference Gater, Farkas and Berg32) . Several studies have shown that individuals with chronic SCI require a 10 % lower energetic intake compared with AB individuals, which equals 200 kcal/d assuming a 2000 kcal/d diet(Reference Bauman, Spungen and Wang45,Reference Buchholz, McGillivray and Pencharz53,Reference Monroe, Tataranni and Pratley63) . Therefore, an overestimation of energetic intake using RMR may lead to obesity, considering that previous reports have shown that an additional 100–200 kcal/d should be restricted to promote negative energy balance(Reference Gorgey and Gater11).
While BMR is more precise than RMR, it is important to emphasise that RMR is often more practical and feasible to measure due to its less stringent protocol, especially with the advent of portable metabolic carts. Therefore, BMR measurement is ideal, but RMR is an acceptable proxy if appropriately conducted and standardised. Fellieter et al. investigated the changes in RMR and body composition over time in individuals admitted for acute treatment after SCI and showed that the average RMR from 2 weeks of admission to 130 weeks decreased significantly (1582 v. 1291 kcal/d, respectively)(Reference Felleiter, Krebs and Haeberli27). Importantly, RMR was measured instead of BMR, possibly because RMR is measured under less strict conditions, as individuals in the acute phase spent more time in the intensive care unit. Several participants in the study were unable to undergo RMR assessment due to spinal shock, as they experienced symptoms of hypotension that required clinical intervention through the delivery of high fluid volumes and vasopressors to mitigate hypotension(Reference Felleiter, Krebs and Haeberli27). Likewise, under certain conditions, it may not be feasible to measure metabolic rate, in which case population-specific prediction equations may be used to estimate BMR.
Population specific prediction equations
The use of predictive equations as a surrogate for metabolic rate measurement allows clinicians to estimate the energy needs for individuals with SCI. Prediction equations rely on assumptions and have many limitations, and the most widely used prediction equations are not reliable in SCI, given that they are derived from uninjured populations. Prediction equations derived from populations without SCI include the following: Harris Benedict, 1919; Schofield, 1985; and Mifflin-St., 1990(Reference Harris and Benedict70–Reference Schofield72). A review by Nevin et al. reported that prediction equations derived from AB individuals overestimate measured metabolic rate from 4 % to 92 % in individuals with SCI(Reference Nevin, Steenson and Vivanti73). Cox and colleagues showed that using the Spanier and Shizgal equation which predicted RMR by multiplying body mass (kg) by 45 kcal/d resulted in a predicted RMR of 3056 kcal/d, resulting in an overprediction of RMR by 92 % compared with the measured RMR of 1589 kcal/d(Reference Nevin, Steenson and Vivanti73–Reference Spanier and Shizgal75). These equations typically incorporate age, weight and height, which are primarily used to estimate BMR in AB individuals. The predicted values of RMR and BMR reported by Bauman and colleagues were found to be significantly higher than the measured metabolic rate by indirect calorimetry(Reference Bauman, Spungen and Wang45,Reference Bauman, Cirnigliaro and La Fountaine52) . A recent systematic review by Farkas et al. evaluated the accuracy of predicted metabolic rates in comparison to measured metabolic rates through indirect calorimetry. The authors confirmed that several prediction equations derived from AB individuals overestimate metabolic rate and energetic requirements for individuals with SCI(Reference Farkas, Pitot and Gater1). Importantly, the previously described predictive equations do not factor in LM, FM or regional adipose tissue.
Recent SCI population-specific equations developed by Chun et al. & Nightingale & Gorgey, more accurately estimate BMR by incorporating measures of FFM via DXA(Reference Nightingale and Gorgey7,Reference Chun, Kim and Shin46) . Additionally, further incorporation of anthropometric measurements such as weight, height and circumferential methods have been shown to improve estimations of BMR by 8 % (r2 = 0·77)(Reference Nightingale and Gorgey7). Similarly, Chun et al. reported a mean difference of 5·4 kcal/d between the measured and predicted metabolic rate after accounting for FFM(Reference Chun, Kim and Shin46). These two SCI-specific prediction equations offer the best estimate of BMR in adults with chronic SCI; however, difficulty obtaining FFM using DXA may limit the feasibility predicting BMR using these methods. Gorgey et al. suggested that a simple measurement of body weight (kg) can be used to predict whole-body FFM in men with chronic complete SCI using the following prediction equation: whole-body FFM = 0·288 × body weight (kg) + 26·3(Reference Gorgey, Dolbow and Gater76). Chun et al., found no statistical differences between estimated and DXA-measured values of FFM in thirty-eight male participants using the previously described prediction equation(Reference Chun, Kim and Shin46,Reference Gorgey, Dolbow and Gater76) . In the absence of detailed body composition information, utilisation of anthropometric measurements (height, weight and transverse abdominal diameter) offers a useful method in predicting BMR but yields a lower R2 value of (r2 = 0·57)(Reference Nightingale and Gorgey7). Furthermore, prediction equations may be used to estimate TDEE from measured BMR or RMR.
Recently, Farkas et al. performed detailed calculations using a metabolic equivalent of 2·7 ml of oxygen/kg of body weight/min as opposed to 3·5 ml/kg per min that is commonly used in the general population(Reference Farkas, Gorgey and Dolbow38). The authors developed a novel SCI-specific correction factor of 1·15 instead of 1·2 to estimate TDEE from BMR using one metabolic equivalent of 2·7 ml of oxygen/kg of body weight/min(Reference Farkas, Gorgey and Dolbow38). An accurate estimate of TDEE should be considered after measuring or estimating BMR, which further allows clinicians and dieticians to devise appropriate dietary and exercise regimens that address the individual patient’s needs while combatting obesity and other SCI-associated secondary comorbidities.
Regardless of the mode of measurement, individuals with SCI experience a reduction in metabolic rate, which contributes to obesity and increases risk for several cardiometabolic diseases(Reference Spungen, Bauman and Wang6). Therefore, an accurate determination of energy expenditure is important to ensure appropriate recommendations of dietary intake to mitigate this heightened risk in persons with chronic SCI. Importantly, different methods of calorimetry (direct v. indirect) are commonly used to measure metabolic rates.
Discussion
The majority of the SCI literature detailed in this review indicates a shift towards measuring RMR, instead of BMR, with the latter being more precise in quantifying energy expenditure (Tables 1 and 2). Metabolic rates are consistently lower in persons with SCI compared with the general population. The vast majority of inconsistencies between BMR/RMR measurements in SCI v. AB individuals is attributed to reduced lean body mass following SCI. More specifically, reductions in metabolically active muscle and bone tissue below the level of injury account for significant reductions in energy expenditure and increases in fat tissue. Moreover, several reports have indicated a lower metabolic rate in tetraplegic SCI compared with paraplegic SCI, which has been confirmed in the current review. Since RMR is not measured in a basal state, RMR is generally higher in comparison to BMR for individuals with or without SCI(Reference Farkas, Sneij and McMillan41). We showed that BMR is 9 % lower compared with RMR in persons with SCI. Across the SCI literature, the mean BMR measured for individuals with SCI was 1397 kcal/d (range:1124 kcal/d–1603 kcal/d), whereas the mean measured RMR was 1527 kcal/d (range:1132 kcal/d–1891 kcal/d) (Tables 1 and 2). Importantly, numerous factors affect metabolic rates in persons with SCI, including type of mobility device (e.g., manual wheelchair, walker, power wheelchair, etc.). For instance, Gorgey et al. reported a 15 % difference in BMR comparing manual and power wheelchair users (1551 v. 1340 kcal/d, respectively)(Reference Gorgey, Caudill and Sistrun10). Although differences in BMR were not statistically significant, possibly due to a limited sample size (n=13), these findings do however suggest that manual wheelchair users have a higher level of activity due to the physical exertion of using a manual wheelchair compared with power wheelchair users. Therefore, the type of mobility device should be clearly indicated when reporting metabolic rates in this population.
Additionally, several interventions have shown that increases in lean body mass have resulted in increased metabolic rate in SCI. Bauman et al. demonstrated that hypogonadal male SCI participants on testosterone replacement therapy (TRT) (5–10 mg/d) had a significant increase in RMR (1328 v. 1440 kcal/d, respectively(Reference Bauman, Cirnigliaro and La Fountaine52). Likewise, Welle et al. reported a 10 % increase in BMR following 3 months of TRT in AB men with muscular dystrophy and a 7 % increase in healthy AB individuals(Reference Welle, Jozefowicz and Forbes77). Given these findings, TRT can increase lean body mass, and also significantly improve metabolic rate. Gorgey et al. examined the effect of 16 weeks of neuromuscular electrical stimulation resistance training (RT) in combination with low dose TRT (2–6 mg/d) v. TRT only and reported a 14–17 % increase BMR following the combination with no change in the TRT-only group of men with complete SCI (1693 v. 1502 kcal/d, respectively)(Reference Gorgey, Khalil and Gill15). The increase in RMR reported by Bauman et al. may be due to a higher dose of testosterone administered to participants (5–10 mg/d), whereas Gorgey et al. reported no significant changes in BMR in the TRT-only group (2–6 mg/d).
In another study, Gorgey et al. showed that following 16 weeks (5 d per week) of either functional electrical stimulation cycling (n=3) or arm cycling ergometry (n=3), BMR was significantly reduced by ∼17 % following both interventions(Reference Gorgey, Martin and Metz48). Nevertheless, the conflicting change in metabolic rate noted in previous studies suggests that changes in BMR are dependent upon the mode of exercise and dietary restriction-induced reductions in metabolic rate in persons with SCI.
Reductions in energetic intake in combination with exercise and/or pharmacological interventions for individuals with SCI have been known to reduce FM and concomitantly increase LM. A recent case report noted a 25 % reduction in energetic intake (440 kcal/d, respectively) in an individual with motor complete T5 SCI in combination with 16 weeks of TRT administration resulting in total body weight reduction by 8 % and total body fat reduction by 29 %(Reference Gorgey, Lester and Ghatas78). These findings demonstrate that accurately determining BMR allows researchers to better understand the role of exercise and clinical interventions in promoting improvements in body composition and health outcomes to combat obesity-related complications in persons with SCI.
The literature reviewed measured BMR and/or RMR non-invasively with indirect calorimetry using a metabolic cart (Tables 1 and 2). As previously stated, BMR is precise, but RMR is often more feasible. Moreover, while direct calorimetry is the gold standard for measuring TDEE, indirect calorimetry is considered the gold standard to measure BMR/RMR to estimate TDEE. In the clinical environment, access to metabolic carts for indirect calorimetry may be limited, and thus the measurement of metabolic rate may not be feasible. The use of predictive equations as a surrogate for indirect calorimetry allows clinicians to estimate energy needs for individuals with SCI; however, commonly used equations do not factor in LM, FM or regional adipose tissue. As previously mentioned, recent SCI population-specific equations have been developed that more accurately estimate BMR through measures of FFM via DXA and anthropometric circumferential measurements(Reference Nightingale and Gorgey7). However, limited access to advanced imaging techniques (i.e., DXA) may limit the feasibility predicting BMR using this method. Therefore, utilisation of anthropometric measurements (height, weight and transverse abdominal diameter) may offer a useful and feasible method for predicting BMR. Moreover, important work has been done to more accurately estimate TDEE from BMR measurements in persons with SCI(Reference Farkas, Gorgey and Dolbow38). This is an important step that further allows clinicians and dieticians to devise individualised dietary and exercise plans to mitigate obesity and SCI-associated secondary comorbidities.
Several methodological differences have been noted while reviewing SCI literature on metabolic rate. The majority of studies measured metabolic rate in a supine position; however, several studies measured metabolic rate in a seated position (Tables 1 and 2). Previous reports have indicated that certain postures require increased muscle tone and may potentially influence the measurement of metabolic rate(Reference Compher, Frankenfield and Keim36). In contrast, other studies have shown that acquisition of metabolic rate through indirect calorimetry is not substantially influenced by position(Reference Miles-Chan, Sarafian and Montani79). It is also worth noting that spasticity occurs in more than 80 % of individuals with SCI, which is characterised by involuntary and uncontrolled muscle contractions(Reference Levi, Hultling and Seiger80). During the assessment of either BMR or RMR, occurrences of spastic hypertonia may result in increased energy expenditure due to excessive muscle contraction, which may warrant multiple measurements of BMR or RMR using indirect calorimetry for individuals with severe spasticity(Reference Stoquart, Detrembleur and Nielens81). In majority of the literature reviewed, resting time prior to RMR acquisition was 20–30 min; however, several studies reported resting times ranging from 5 to 20 min. Nevertheless, standardisation and consistency would dramatically improve our understanding of metabolic rate following SCI. Moreover, differences in terminology need to be addressed while describing metabolic rate in persons with SCI, as we have clearly noted that BMR is a more accurate measure in comparison to RMR and these terms are not interchangeable.
Future research should take into consideration the overestimation of energy expenditure when using RMR and use the more precise assessment of BMR instead. If BMR is not feasible, then the dietary recommendations need to properly account for this overestimation. Additionally, it is highly recommended that researchers and clinicians acknowledge the accurate measure of BMR when using SCI-specific prediction equations to predict TDEE, as using RMR may potentially overestimate total energy expenditure. Future studies with larger sample sizes are needed to evaluate the influence of level of injury, completeness of injury and sex on BMR, RMR and TDEE in persons with SCI.
Acknowledgments
The work was supported by the Department of Veteran Affairs (VA) Merit Program (Application # 1 I01 RX002649-01A; Protocol ID: B2649-R) by ASG.
A. M. A.: Helped write the original draft, reviewed scientific evidence and scientific writing, summarising research findings and helped with writing and editing, developed figures and organised and approved the final version of the manuscript. J. A. G.: Helped writing the original draft, assisted with the development of the manuscript, helped with data curation, provided critical feedback, reviewed scientific evidence and helped edit and approved the final version. M. W. A.: Provided critical feedback, helped with editing and formal analysis and approved the final version. A. S. G.: Provided critical feedback, submitted the initial proposal, reviewed scientific evidence, helped writing the original draft, assisted with the development of the manuscript, helped with data analysis, helped with writing and editing and approved the final version.
The authors have no conflicts to report.


 Open access