


Promoting healthy beverages, by reducing consumption of sugar-sweetened beverages (SSB) and increasing water access and intake, is a key public health challenge in the USA. There is particular interest in shaping beverage choice among very young children since research has demonstrated that children develop dietary preferences early and these preferences persist over the life course( Reference Beckerman, Alike and Lovin 1 ).
Consumption of SSB, which include drinks with added sugars such as soda and fruit drinks, is high among young children, with the most recent national estimates (2013–2014) suggesting that nearly half (47 %) of all children aged 2–5 years consume an SSB on a typical day( Reference Bleich, Vercammen and Koma 2 ). Despite declines over the past decade( Reference Bleich, Vercammen and Koma 2 ), SSB consumption in this age group remains a significant concern among public health professionals given the well-documented associations between drinking these beverages and adverse health consequences among children including weight gain, dental caries, insulin resistance and caffeine-related effects (e.g. headaches)( Reference Bleich and Vercammen 3 ). Research also suggests that the majority of children in the USA are inadequately hydrated( Reference Kenney, Long and Cradock 4 ), with over 20 % of children aged 1–5 years not drinking any tap water on a typical day( Reference Patel, Shapiro and Wang 5 ). Although research on the topic is limited, substituting safe drinking-water for SSB could help to decrease intake of excess energy and added sugars, while promoting adequate hydration for optimal physical and cognitive functioning( Reference Lieberman 6 ).
For more than a decade, reducing SSB consumption and increasing water access and intake among young children has been the target of many research, policy and advocacy efforts in the USA. Researchers have evaluated a number of approaches targeting individual behaviour change, such as nutrition classes, counselling and public awareness campaigns (e.g. Rethink Your Drink in children’s hospitals)( Reference Vargas‐Garcia, Evans and Prestwich 7 ). Recently, there has been growing interest in influencing beverage consumption at the population level by changing policies, systems or environments( Reference Honeycutt, Leeman and McCarthy 8 ), through efforts such as SSB taxation or healthy beverage ordinances that require restaurants to serve milk or 100 % juice with kids’ meals instead of SSB. In school and early childcare settings, there has been movement towards reducing access to SSB through government procurement standards and local school wellness policies that limit the types and amounts of beverages served to children( 9 , 10 ). Such standards have reduced the availability of SSB in school and childcare settings( Reference Gorski, Cohen and Hoffman 11 , Reference Mozaffarian, Gortmaker and Kenney 12 ), but evidence on the availability of alternative healthy beverages, such as safe and appealing water sources, is mixed( Reference Patel, Hecht and Hampton 13 , Reference Ritchie, Sharma and Gildengorin 14 ). The quality of drinking-water available and accessible to communities is a pertinent concern underlying water promotion efforts, an issue publicized after Pb contamination of Flint, Michigan’s drinking-water supply( Reference Hanna-Attisha, LaChance and Sadler 15 ).
While there is a large and growing body of empirical research documenting the effectiveness of strategies to reduce consumption of SSB and increase water access and intake, the perspectives of expert stakeholders actively working on these issues is not well understood. Understanding their views on the existing evidence base as well as identifying key research gaps or novel ideas to explore in the future are critical for developing a coordinated research agenda with the greatest potential to promote healthy beverage consumption in young children. The objectives of the present study were to: (i) summarize stakeholder recommendations on novel and innovative strategies to reduce SSB consumption and increase water access and intake among young children; and (ii) present stakeholders’ ratings of these strategies on their feasibility, reach, effectiveness, health equity and overall importance.
Methods
Study population for surveys 1 and 2
Using a snowball sampling approach, the research team identified a list of 312 experts representing various sectors (e.g. research, advocacy, government). An expert was defined as someone who works closely on issues related to SSB and/or water access and intake. The list of survey respondents was developed in collaboration with staff at the Health Eating Research programme of the Robert Wood Johnson Foundation and an advisory committee of leading researchers in the field. The contact information (names and emails) for the survey population was obtained online and through referrals from colleagues. The surveys were also distributed through email listservs consisting of individuals actively involved with SSB and/or water consumption issues (e.g. American Academy of Pediatrics; full list of listservs available from authors on request). As it was possible to receive both a private email invitation and a listserv invitation, some individuals may have been invited to complete the survey more than once.
While a list of 312 experts was compiled for survey 1, seventeen emails bounced back and therefore were not successfully delivered to the recipient. Of the 295 individuals successfully invited via email to complete survey 1 in Qualtrics, seventy-one (24 %) completed the survey; an additional 205 individuals completed the survey using an anonymous listserv link. Of the 480 individuals invited via email to complete survey 2 in Qualtrics, 137 (29 %) completed the survey; an additional forty-five individuals completed the survey through an anonymous survey link. These response rates are consistent with what other studies using email surveys have reported( Reference Sheehan 16 ). Since the total number of individuals reached by the anonymous listserv links is not known, it was not possible to estimate the response rate for this mode of distribution.
Survey 1 (sugar-sweetened beverage and water strategy recommendations)
The purpose of the first survey was for stakeholders to generate a list of novel and innovative strategies to reduce SSB consumption and increase water access and consumption (see online supplementary material, Supplemental File 1, for the full survey). In February 2018, survey respondents received an email invitation through Qualtrics (Qualtrics LLC, 2014) or via listserv asking them to complete a six-item web-based survey. The survey included open-ended questions asking each respondent to list up to three strategies to reduce SSB consumption and up to three strategies to increase water access and intake among 0–5-year-olds, as well as demographic characteristics: primary sector (e.g. academia), role (e.g. researcher), location (i.e. city, state, country) and if the respondent worked directly on issues related to SSB and/or water. The survey took approximately 10 min to complete, was open for 10d (27 February–9 March 2018) and respondents received a minimum of two reminder emails to complete the survey.
The two open-ended questions from this survey about strategies to modify SSB and water consumption were coded in NVivo version 11 (QSR International Pty Ltd, 2018) and analysed for thematic content by three authors (K.A.V., J.M.F. and C.M.L.). Each suggested strategy was treated as a response and was broadly coded as either a strategy to reduce SSB consumption or increase water access and intake, which were analysed separately. From this list of responses, two coders working independently first identified strategies that mapped on to a list of sub-themes previously identified in the literature (e.g. price changes), and then used an inductive approach to identify novel themes and sub-themes. Coders iteratively read and coded participant responses and discussed emergent themes to develop a codebook, which included definitions and example cases for each theme (online supplementary material, Supplemental Tables 1 and 2). The codebook was used to identify emergent themes, sub-themes and target settings across all SSB and water responses separately, and to calculate the proportion of responses mentioning each code. Inter-rater reliability between two coders was high (>90 % agreement).
Survey 2 (sugar-sweetened beverage and water strategy ratings)
The purpose of the second survey was for stakeholders to rank strategies suggested in survey 1 and identified from the peer-reviewed literature (see online supplementary material, Supplemental File 1, for the full survey). To identify strategies from the peer-reviewed literature, a systematic review was conducted by searching seven databases (PubMed, Web of Science, EMBASE, CINAHL, ERIC, CAB Abstracts and the Cochrane Central Register of Controlled Trials) for relevant articles published between 1 January 2000 and 15 December 2017 that evaluated an intervention to reduce SSB consumption among children aged 0–5 years living in high-income countries( Reference Vercammen, Frelier and Lowery 17 ). Therefore, survey 2 included existing strategies from the peer-reviewed literature, as well as novel and innovative strategies suggested by survey 1 respondents.
In March of 2018, survey respondents received a second email invitation through Qualtrics or via listserv asking them to complete a follow-up survey consisting of ten questions. The survey questions asked respondents to rate SSB and water strategies across five domains on a Likert scale from 1 (‘least likely’) to 5 (‘most likely’): (i) feasibility; (ii) effectiveness; (iii) reach; (iv) health equity; and (v) overall importance. Definitions of each domain are provided in the survey text in Supplemental File 1. The survey took approximately 20 min to complete and was open for 13d (28 March–9 April 2018). Respondents received a minimum of two reminder emails to complete the survey.
For each strategy and domain rating, the mean score and sd were calculated. ANOVA was used to analyse differences in the overall importance score of strategies by respondents’ primary sector, with Tukey tests utilized for post hoc comparisons. Other questions in the survey were summarized with frequencies and proportions.
Results
Respondent characteristics
Survey 1 (n 276) and survey 2 (n 182) respondent characteristics are reported in Table 1. Most respondents worked in academia (32 %), non-governmental organizations (NGO; 24 %) or government (20 %), as a programme director/staff (36 %) or researcher (30 %), and the majority lived in the western (35 %) or southern part of the USA (32 %). Survey 2 respondents had comparable characteristics to those who completed survey 1.
Table 1 Professional and geographic characteristics of survey 1 and 2 respondents
SSB, sugar-sweetened beverages.
Survey 1 was conducted from 27 February 2018 to 9 March 2018. Survey 2 was conducted from 28 March 2018 to 9 April 2018. ‘Direct service provider’ refers to doctors, nurses, dietitians.
* Includes Hawaii and Alaska.
† Includes Australia, South Africa, Canada, Japan, France and Jordan.
Survey 1 (sugar-sweetened beverage and water strategy recommendations)
The participants who completed survey 1 provided 676 SSB strategies and 593 water strategies. Table 2 reports the themes and sub-themes identified from these responses and the proportion of responses mentioning each.
Table 2 Themes and sub-themes for strategies to reduce sugar-sweetened beverage (SSB) consumption and increase access to and consumption of safe drinking-water among 0- to 5-year-olds from survey 1
Percentages in bold (themes) are calculated with the total number of strategies as the denominator. Percentages not in bold (sub-themes) are calculated with the number of strategies within each theme as the denominator. ‘–’ indicates that a given theme or sub-theme was not relevant for either water or SSB, respectively. The proportion of responses mentioning each theme or sub-theme within a theme do not always add to 100 % because some responses were coded as more than one theme (e.g. a strategy suggesting changes to price and physical access), some responses identified a theme but not a sub-theme (e.g. ‘education for parents’), and a small number of responses did not address any of the emergent themes or were unrelated to the question.
Six themes emerged that applied to both increasing water consumption and reducing SSB consumption: physical access (34 % of total SSB responses and 48 % of total water responses), education (29 % of total SSB responses and 33 % of total water responses), campaigns and contests (9 % of total SSB responses and 11 % of total water responses), pricing (9 % of total SSB responses and 3 % of total water responses), marketing and advertising (8 % of total SSB responses and 6 % of total water responses) and improving the capacity of settings to promote healthy behaviours (4 % of total SSB responses and 13 % of total water responses).
Physical access strategies most frequently suggested included decreasing access to SSB through various sales, servings and consumption restrictions (86 % of SSB physical access responses; e.g. policy that federally funded early childcare centres (ECC) cannot serve SSB or childcare providers cannot consume SSB in front of children) and increasing access to water through improvements in availability and accessibility (95 % of water physical access responses; e.g. placing more child-friendly water fountains in public places), and were primarily proposed in ECC and schools (55 % % of SSB physical access responses that specified a setting and 61 % of water physical access responses that specified a setting). Educational strategies to reduce SSB consumption most often included counselling and screening by health professionals for children and parents (18 % of SSB education responses) and training for childcare or health-care providers (17 % of SSB education responses), while educational strategies to increase water consumption frequently included passive written education (29 % of water education responses) and behaviour change techniques for children and parents (24 % of water education responses). Educational strategies were mainly recommended for implementation in ECC and schools (41 % of SSB education responses and 54 % of water education responses that specified a setting) and health-care settings (40 % of SSB education responses and 25 % of water education responses that specified a setting). The most commonly recommended pricing strategies were SSB taxation (79 % of SSB pricing responses) and providing financial incentives to purchase water (67 % of water pricing responses). Marketing and advertising strategies most often suggested included restrictions and regulations on SSB advertising (57 % of SSB marketing and advertising responses), as well as counter-advertising to promote water consumption (88 % of water marketing and advertising responses). Strategies to improve setting capacity most commonly suggested included providing technical assistance, resources and funding to specific programmes/locales (74 % of SSB setting capacity responses and 93 % of water setting capacity responses) and were mainly recommended in ECC and schools (56 % of SSB setting capacity responses that specified a setting and 53 % of water setting capacity responses that specified a setting).
Emergent themes that applied only to SSB were labelling (4 % of total SSB responses; e.g. warning labels) and sugar reduction (1 % of total SSB responses; e.g. reformulation). Water quality and safety emerged as a theme that applied only to water (17 % of total water responses), with responses recommending water testing (35 % of water quality/safety responses) and quality (53 % of water quality/safety responses) and taste (26 % of water quality/safety responses) improvement.
Survey 2 (sugar-sweetened beverage and water strategy ratings)
Supplemental Table 3 (see online supplementary material) reports the mean score for each of the nineteen SSB strategies and twenty water strategies for overall importance, feasibility, reach, health equity and effectiveness.
Figures 1 and 2 display each SSB and water strategy graphically as a function of the five domains. The SSB reduction strategies which received consistently high ratings (≥3·5) across all domains were strategy #13 (prohibit serving, marketing or selling SSB in childcare settings receiving federal funds) and strategy #14 (prohibit licensed ECC from serving SSB). In contrast, strategy #11 (eliminate increased marketing for SSB during Supplemental Nutrition Assistance Program (SNAP) benefit issuance) received consistently low ratings (≤3·2) across all domains (Fig. 1). The water strategies that received consistently high ratings across all domains were strategy #12 (increase availability of safe drinking-water), strategy #13 (make water the default beverage choice at food retailers), strategy #14 (implement policy specifying the types of beverages that can be provided to children at ECC sites) and strategy #20 (organizational strategies in schools and public spaces such as scheduling water breaks). In contrast, strategy #2 (educate with in-person sessions) and strategy #5 (develop a peer-to-peer support group for parents to exchange information about water consumption) received consistently low ratings across all domains (Fig. 2).
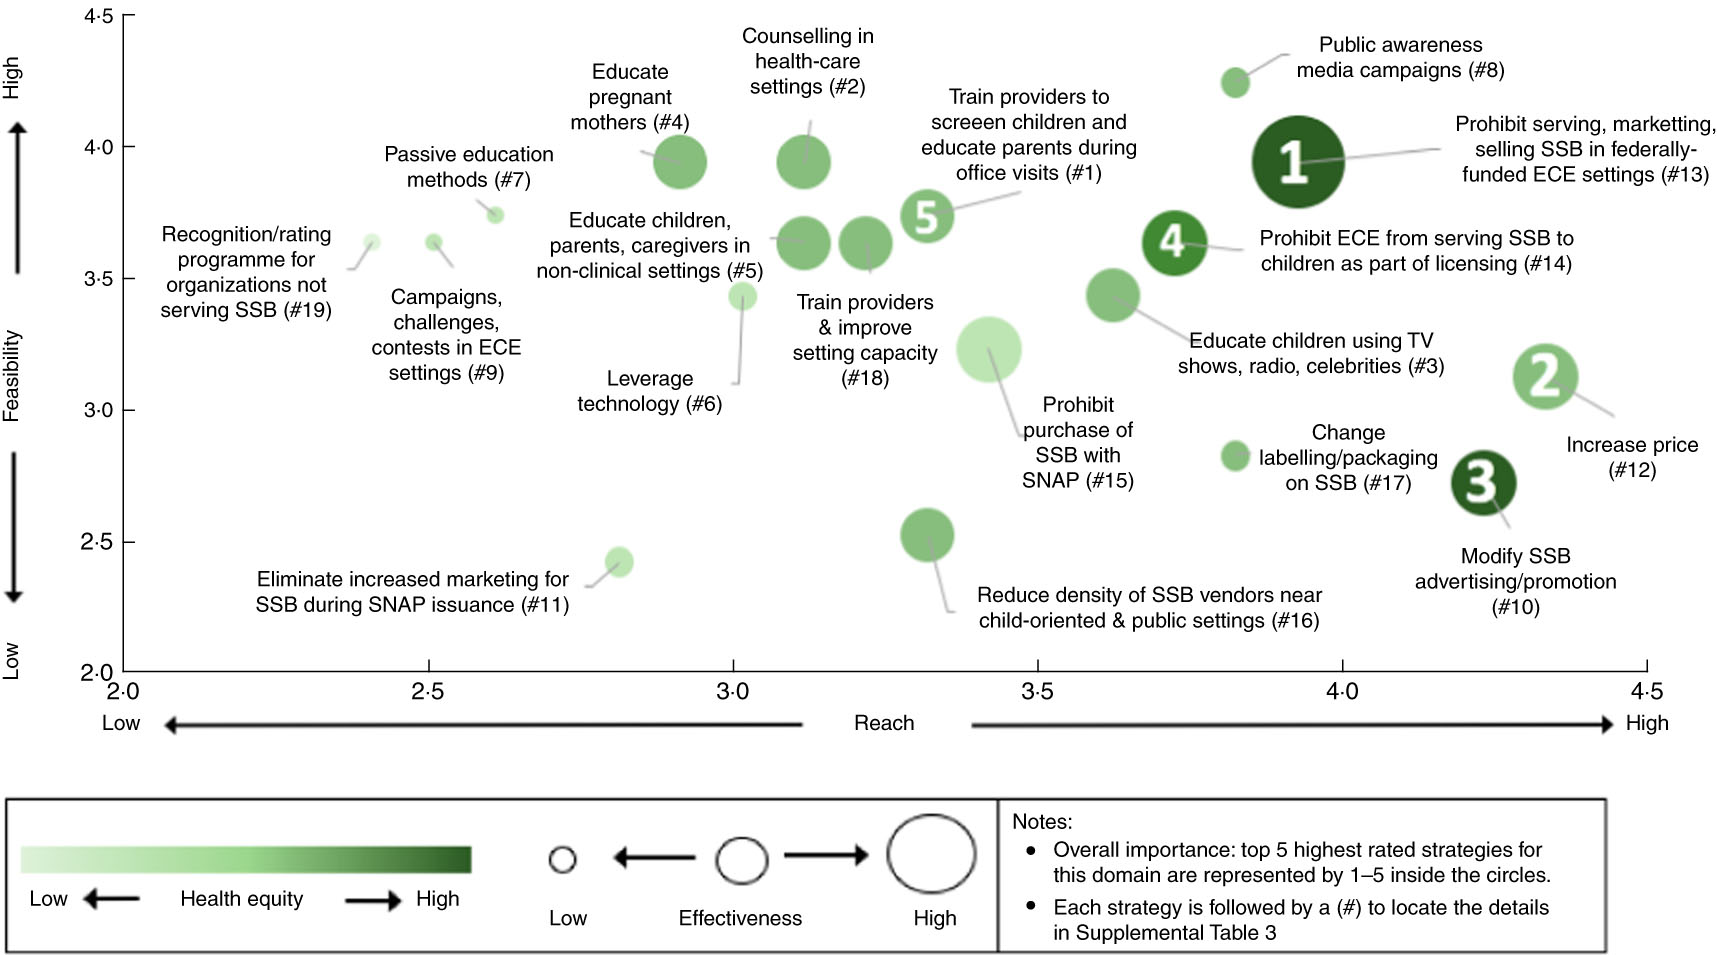
Fig. 1 Graphical depiction of ratings of strategies from survey 2 to reduce sugar-sweetened beverage (SSB) consumption among 0–5-year-olds. The strategies to reduce SSB consumption are ranked across five domains as summarized in the online supplementary material, Supplemental Table 3: (i) as the strategies move up the y-axis, they are ranked as more feasible; (ii) as the strategies move right across the x-axis, they are ranked as having a greater reach; (iii) as the strategy bubbles become a darker shade of green, they are ranked as more equitable; (iv) as the strategy bubbles become larger, they are ranked as more effective; and (v) inside the strategy bubbles, the strategies which received the highest overall importance rating are indicated with a number (1 to 5). ECE, early childhood education; SNAP, Supplemental Nutrition Assistance Program; TV television
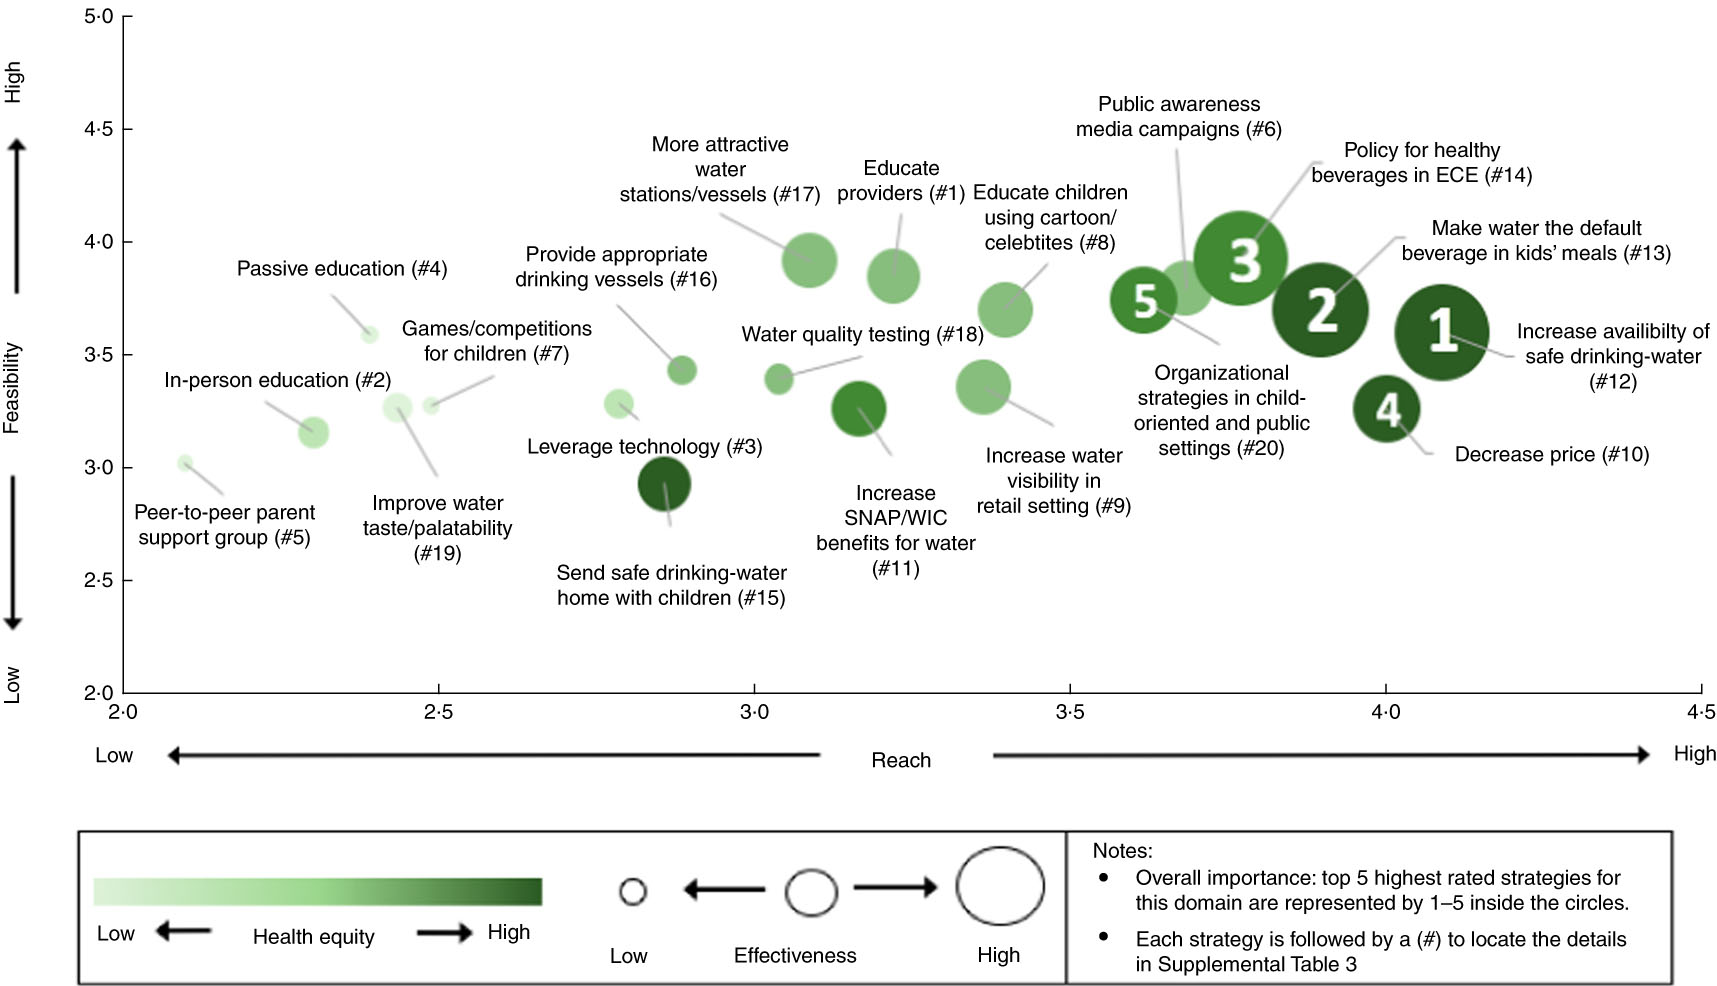
Fig. 2 Graphical depiction of ratings of strategies from survey 2 to increase access to and intake of water among 0- to 5-year-olds. The strategies to increase access/consumption of safe drinking-water ranked are across five domains as summarized in the online supplementary material, Supplemental Table 3: (i) as the strategies move up the y-axis, they are ranked as more feasible; (ii) as the strategies move right across the x-axis, they are ranked as having a greater reach; (iii) as the strategy bubbles become a darker shade of green, they are ranked as more equitable; (iv) as the strategy bubbles become larger, they are ranked as more effective; and (v) inside the strategy bubbles, the strategies which received the highest overall importance rating are indicated with a number (1 to 5). SNAP, Supplemental Nutrition Assistance Program; WIC, Special Supplemental Nutrition Program for Women, Infants, and Children; ECE, early childhood education
Significant differences in mean overall importance score across respondent sector were found for four SSB strategies (#7, #8, #12 and #19; see online supplementary material, Supplemental Table 4). Post hoc tests revealed that respondents working in education rated SSB strategy #7 (educate using passive education methods) significantly higher than respondents in academia and health care, and rated SSB strategy #19 (establish a programme to recognize organizations that do not serve SSB) significantly higher than respondents in academia, government or other sectors. Respondents working in NGO rated SSB strategy #8 (launch public awareness media campaigns) significantly higher than respondents in academia and rated SSB strategy #12 (make SSB more expensive) significantly higher than respondents in government.
Significant differences in mean overall importance score across respondent sector were found for two water strategies (#6 and #16). Respondents working in education rated water strategy #16 (provision of age-appropriate drinking vessels) significantly higher than respondents in academia, government and NGO. Post hoc comparisons for water strategy #6 did not identify any sectors that were significantly different from each other.
Discussion
Interest in using research, programming and policy to reduce SSB consumption and increase water access and intake among young children is high, but the available resources to do so are limited. The present study is the first to assess stakeholder opinions on strategies to change beverage consumption behaviours. This knowledge is key for understanding where stakeholders believe resources can be best utilized. Overall, we found that stakeholders provided higher ratings to strategies that used policy, systems and/or environmental change to promote healthy beverage behaviours. This suggests that stakeholders may be shifting their focus away from strategies encouraging individual behaviour change and towards approaches that aim to make environments more conducive to healthy beverage choices. This is a clear departure from the peer-reviewed literature, which has primarily focused on the implementation and evaluation of individual-level interventions (e.g. nutrition classes, counselling)( Reference Vercammen, Frelier and Lowery 17 ).
When asked to provide novel and innovative SSB and water strategies for young children using open-ended questions (survey 1), respondents most frequently recommended changes to physical access, education and water quality, with a smaller number suggesting public awareness campaigns, marketing and advertising changes, price changes and improving setting capacity. These findings are novel and important because they provide insight into stakeholders’ current engagement and interest in various strategies. This also provides a useful indication of the future direction for healthy beverage promotion research, as well as potential evidence that could be brought to bear on the policy process.
When asked to rank SSB and water strategies (survey 2), respondents consistently scored several strategies high across all domains. Strategy #13 (prohibit serving, marketing or selling SSB in childcare settings receiving federal funds) and strategy #14 (prohibit licensed ECC from serving SSB) received the highest ratings for SSB, while strategy #12 (increase availability of safe drinking-water), strategy #13 (make water the default beverage choice at food retailers), strategy #14 (implement policy specifying the types of beverages that can be provided to children at ECC sites) and strategy #20 (organizational strategies) received the highest ratings for water. In line with the first survey, these findings suggest that stakeholders view interventions that modify physical access through policy, systems and environmental changes to be the most promising way to affect SSB and water access/intake among young children. While the literature evaluating the impact of policy, systems and environmental changes on SSB consumption among young children is limited( Reference Vercammen, Frelier and Lowery 17 ), the small number of published studies on this topic generally suggest a positive effect( Reference Ritchie, Sharma and Gildengorin 14 , Reference Vercammen, Frelier and Lowery 17 – Reference Woo Baidal, Nelson and Perkins 19 ). For example, Ritchie et al. examined the impact of a California beverage policy that required childcare sites participating in the Child and Adult Care Food Program (CACFP) to make water available at all times, finding that significantly more sites served water with meals/snacks (47 v. 28 %) and made self-serve water available indoors (77 v. 69 %) following the policy implementation( Reference Ritchie, Sharma and Gildengorin 14 ).
A number of strategies also emerged as scoring consistently low across all domains. Strategy #11 (eliminate increased SSB marketing by retailers during time period(s) when SNAP participants receive benefits; e.g. by extending SNAP benefit issuance throughout the month)( Reference Moran, Musicus and Findling 20 ) received the lowest ratings for SSB, while strategy #2 (educate with in-person sessions) and strategy #5 (develop a peer-to-peer support group for parents to exchange information about water consumption) received the lowest ratings for water. In general, education strategies for both SSB and water received low ratings, suggesting that stakeholders view individual-level education and behaviour change strategies as less likely to change beverage consumption in young children. In contrast with these low ratings for education in survey 2, education was one of the most frequently recommended strategies in survey 1. This discrepancy in findings across surveys may indicate that while education is viewed as a ubiquitous tool for health promotion by experts, its perceived utility and promise as a sole strategy to affect beverage consumption is limited.
A number of strategies were rated as very high in one domain, but low in other domains. In particular, many of the education and public awareness campaign strategies for both SSB and water were rated as very high on feasibility, but low for all other domains. Similarly, several strategies which required more controversial policy change, such as price changes and modifying advertising of SSB, received high ratings for effectiveness and reach, but low ratings for feasibility. These mixed scores across domains emphasize the complexity of the path forward to reducing SSB consumption and increasing water intake.
Overall, there was a high level of consistency between strategies recommended to change SSB v. water consumption, although some important differences emerged. In general, education, campaigns and contests, and marketing and advertising changes were recommended at a similar proportion for both SSB and water. Price changes were recommended more frequently as a way to reduce SSB (9 v. 3 %), most likely due to growing interest in implementing SSB taxes to dissuade purchasing( Reference Backholer, Blake and Vandevijvere 21 ). While respondents frequently suggested changes to physical access as a way to impact both SSB and water consumption, a higher proportion of responses suggested this for water compared with SSB (48 v. 34 %). This may reflect stakeholders’ belief that parents’ perceptions around the safety and appeal of drinking water are the biggest barrier to increasing children’s water intake in the USA( Reference Backholer, Blake and Vandevijvere 21 , Reference Cradock, Wilking and Olliges 22 ). Strategies to improve setting capacity were recommended more frequently as a way to increase water consumption (13 v. 4 %), due in large part to the number of respondents recommending that settings be provided with funding and resources to conduct water testing and remediation.
The overall importance ratings of several strategies differed by respondent primary sector. In general, respondents from NGO and the education sector gave higher ratings, while respondents from academia gave lower ratings. This heterogeneity highlights potential challenges to creating a multi-sectoral agenda to reduce SSB consumption and increase water intake. Since the findings of the present study demonstrate that experts view the value of strategies differently depending on their work and area of expertise, there is a need to incorporate more objective measures of reach, feasibility, health equity and effectiveness into research to help implementers and policy makers make decisions about which strategies to prioritize.
In both surveys, ECC and schools emerged as the most commonly recommended and highest ranked setting of implementation. For example, four of the six strategies which scored consistently high across all domains and none of the strategies which scored consistently low across all domains specified ECC as the primary setting. This is in line with findings from other studies which have recommended that educational settings should be a focal point for obesity prevention efforts since children spend over half of their waking hours and consume at least one-third of their daily energy at school( Reference Hoelscher, Kirk and Ritchie 23 , Reference McGuire 24 ). However, while advocates and researchers in the current survey may view ECC and schools as an important path forward, it will be important to include the perspectives of implementers (e.g. educators, food-service staff) in future studies.
Strengths and limitations
The present study has several limitations. First, there were several important stakeholder groups who were not included in our survey population (e.g. food and beverage industry). Second, there is the potential for selection bias in our study population, as individuals who opted to complete the surveys may have differing views from the broader population of stakeholders. Third, 13 % of survey participants reported that they did not work on issues directly related to SSB or water, meaning the results may include the opinions of individuals who are not necessarily experts in the field. Moreover, since the survey included a wide range of strategies and settings, respondents were not necessarily experts in all strategies that were presented to them. For example, previous studies have found that that the serving of SSB in ECC is not very common( Reference Erinosho, Dixon and Young 25 , Reference Neelon, Copeland and Ball 26 ), and therefore efforts to prohibit SSB in ECC may not be as effective a strategy to reduce consumption as experts in our survey perceived it to be. Fourth, a number of participants copied verbatim the strategies that were provided as examples in the survey 1 question prompt; this may have biased results towards a focus on ECC and reducing access to beverages (as this was the focus of the example strategy provided).
The present study also has a number of strengths. First, it study employed mixed-methods research methodology to provide a nuanced examination of stakeholder perspectives on strategies to affect the beverage consumption of young children. Second, coding of all open-ended questions was conducted independently and in duplicate by authors, reducing the potential for bias. Third, the study participants were from a broad spectrum of sectors, ensuring there was sufficient representation of a range of stakeholder views and opinions.
Public health implications
Public health interest in the promotion of healthy beverages is underscored by the high prevalence of SSB consumption and inadequate hydration among young children. The present study provides important insight into the opinions of stakeholders on strategies to reduce SSB consumption and increase water intake. Overall, there is a high level of interest in strategies that use policy, systems and environmental changes to promote healthy beverage behaviours, especially targeting changes in ECC and school settings.
Future research is needed to evaluate strategies that were rated highly in this survey but have a weak peer-reviewed evidence base. For decreasing SSB consumption, evidence is needed to examine how marketing, labelling and price changes affect SSB consumption among young children. While some studies have evaluated these types of interventions( Reference Block, Chandra and McManus 27 – Reference Cornelsen, Mytton and Adams 29 ), outcomes have been limited to household-level purchases or adults’ self-reported consumption. For increasing water access and intake, evidence is needed on how changes to physical access and water quality testing and improvement affect water intake among young children. Finally, research is needed to gauge the perspectives of parents/caregivers on the potential for high-ranking strategies to change their children’s beverage intake.
Acknowledgements
Acknowledgements: The authors thank Mary Story, Healthy Eating Research staff and members of the Advisory Committee for very useful feedback. Financial support: This work was supported by the Healthy Eating Research programme at the Robert Wood Johnson Foundation. The Healthy Eating Research programme at the Robert Wood Johnson Foundation provided useful feedback on the design, analysis and writing of this article. Conflict of interest: None. Authorship: K.A.V. conducted the analyses, interpreted the data and drafted the manuscript. J.M.F. conducted the analyses, interpreted the data and provided critical manuscript revisions. C.M.L. conducted the analyses and provided critical manuscript revisions. A.J.M. and S.N.B. supervised the analysis, interpreted the data and provided critical manuscript revisions. Ethics of human subject participation: This study is not human subjects research based on the Department of Health and Human Services regulations.
Supplementary material
To view supplementary material for this article, please visit https://doi.org/10.1017/S1368980018002604


