


Pikeperch (Sander lucioperca) is a freshwater species of high commercial interest in aquaculture with an increasing production in intensive recirculation systems( Reference Dalsgaard, Lund and Thorarinsdottir 1 ). Tailored commercial starter feeds have yet to be formulated for this species and among challenges in larval rearing are specific dietary fatty acid (FA) requirements during early ontogenetic development. Thus, dietary n-3 long-chain PUFA (LC-PUFA), such as EPA (20 : 5n-3) and DHA (22 :6n-3), play critical roles in performance, neurological development and stress resilience of pikeperch larvae and fry; dietary DHA deficiency provokes shock syndromes and large mortalities( Reference Hamza, Mhetli and Ben Khemis 2 – Reference Lund, Høglund and Ebbesson 4 ). Although other percid fishes, such as the close relative walleye (Sander vitreus), seem to have a comparative lower LC-PUFA requirement( Reference Czesny, Kolkovski and Dabrowski 5 ) and Eurasian perch larvae (Perca fluviatilis) possess some capability to elongate and desaturate 18-C n-3 PUFA to EPA and DHA( Reference Xu and Kestemont 6 ), recent research has indicated no such ability in pikeperch larvae and the necessity of a dietary supplementation of DHA. Hence, recent in vivo (1-C14) FA incubation studies in pikeperch larvae with the use of labelled 18 :3n-3 and EPA concluded that most of the n-3 elongation/desaturation products are consistent with the elongation of very long-chain FA, directly producing, respectively, 20 :3n-3 from 18 : 3n-3 and 22 :5n-3 and 24 :5n-3 from EPA (R Covadonga, unpublished results). An observed Δ6 desaturase enzyme activity was also consistent with a significant production of 18 : 4n-3 from 18 :3n-3; however, no further or any desaturation activity over EPA was evident, precluding the expression of Δ5 or even Δ4 desaturases in the larvae.
The essentiality of phosphoglycerides (phospholipids (PL)) has been demonstrated since decades, exerting beneficial effects on growth, survival, stress resistance, enzymatic activity and performance of fish larvae or fry in a variety of marine and freshwater species( Reference Azarm, Kenari and Hedayati 7 – Reference Cai, Feng and Xiang 17 ). Also in pikeperch, an increase in dietary PL improves growth and intestinal brush border membrane enzymatic activity, modulating expression of selected genes in liver( Reference Hamza, Mhetli and Ben Khemis 2 , Reference Hamza, Silvestre and Mhetli 18 ). The optimal dietary PL levels for this species has been suggested to be at least 9·5 % DW( Reference Hamza, Mhetli and Ben Khemis 2 ), which is in the range of those reported in experimental trials for other freshwater and marine carnivorous species (5–12 % of dietary lipids)( Reference Izquierdo and Koven 12 , Reference Tocher, Bendiksen and Campbell 16 , Reference Cahu, Gisbert and Villeneuve 19 ). Dietary inclusion of PL is typically in the form of soyabean lecithin (SBL)( Reference Liu, Caballero and El-Sayed 20 , Reference Saleh, Betancor and Roo 21 ), but marine lecithins( Reference Saleh, Betancor and Roo 22 ) and, occasionally, egg yolk have also been used( Reference Geurden, Charlon and Marion 23 ). Consequently, the content and proportion of lipid classes and LC-PUFA may vary( Reference Tocher, Bendiksen and Campbell 16 , Reference Izquierdo, Tandler and Salhi 24 , Reference Takeuchi, Arakawa and Satoh 25 ) and affect the optimal inclusion in the diet for a given species( Reference Cahu, Gisbert and Villeneuve 19 , Reference Geurden, Charlon and Marion 23 , Reference Geurden, Marion and Charlon 26 , Reference Saleh, Betancor and Roo 27 ). SBL contains typically 65–75 % PL( Reference Scholfield 28 ), with about 20–25 % each of the major phosphoglycerides: phosphatidylcholine (PC), phoshatidylethanolamine and phosphatidylinositol (PI). These are formed by l-glycerol with two FA esterified on positions 1 and 2, the second one typically with an unsaturated FA( Reference Tocher, Bendiksen and Campbell 16 ). SBL contains no LC-PUFA but up to 50–55 % of 18 : 2n-6, and 4 % of 18 : 3n-3, together with 8–11 % each of 16 : 0, 16 : 1 and 18 : 1, depending on the commercial product( Reference Staňková, Kremmyda and Tvrziká 29 ).
Despite a general consensus about the positive influence of either dietary n-3 LC-PUFA or PL during pikeperch larval ontogeny, the optimal supplemented levels and the combined effects of dietary PL and n-3 LC-PUFA during exogenous feeding are still controversial. Thus, growth improvement of pikeperch larvae has been related to the positive effect of dietary levels of PL independently of LC-PUFA levels( Reference Hamza, Mhetli and Ben Khemis 2 , Reference Hamza, Kestemont and Ben Khemis 30 ). This observation is in agreement with studies on larvae of the freshwater carp (Cyprinus carpio) and the amphidromous ayu (Plecoglossus altivelis) where SBL, despite lacking n-3 LC-PUFA, were as effective or even more effective than marine lecithins rich in n-3 LC-PUFA( Reference Geurden, Radünz-Neto and Bergot 10 , Reference Kanazawa, Teshima and Inamori 31 ). In other studies, conducted with marine fish larvae, PL were superior to neutral lipids (NL) as a source of EFA( Reference Izquierdo, Tandler and Salhi 24 ), and fish larvae reared on PL rich in n-3 LC-PUFA showed further enhanced growth, digestion and absorption, as well as an increased lipid transport and uptake into larval membranes( Reference Izquierdo, Socorro and Arantzamendi 11 , Reference Saleh, Betancor and Roo 27 , Reference Gisbert, Villeneuve and Zambonino-Infante 32 ). The provision of n-3 LC-PUFA, as preformed intact PL (i.e. wild live preys such as copepods, marine lecithin and so on) or as NL or TAG (i.e. enriched cultured live preys such as rotifers, microdiets and so on), is probably a plausible explanation for the higher efficiency of the former in sustaining growth, survival and skeletal and ontogenetic development( Reference Cahu, Gisbert and Villeneuve 19 , Reference Gisbert, Villeneuve and Zambonino-Infante 32 – Reference Salhi, Hernández-Cruz and Bessonart 37 ). Ingested LC-PUFA are hydrolysed and emulsified in bile salts and passively transported over the enterocytes as monoacylglycerol (MAG) or free fatty acid and re-esterified or re-acylated to TAG or PL mainly on the sn-2 position. Although PL can be effectively synthesised by the enterocyte mainly by the glycerol-3-phosphate pathway, as well as by the MAG pathway, the efficiency of these pathways can be markedly impaired by dietary lipids( Reference Caballero, Gallardo and Robaina 38 ). Moreover, fish larvae have a poor development of enterocytes, and this may further reduce the ability to synthesise PL de novo ( Reference Coutteau, Geurden and Camara 39 ) and a low PL:TAG ratio is found to accumulate lipid droplets in the enterocytes( Reference Salhi, Hernández-Cruz and Bessonart 37 ) by inhibiting the assembly of lipoprotein particles (chylomicrons and VLDL) or transport mechanisms out of the enterocytes and consequently cause TAG to accumulate in the intestinal epithelium( Reference Liu, Caballero and El-Sayed 20 , Reference Olsen, Evjemo and Kjorsvik 36 , Reference Morais, Cahu and Zambonino-Infante 40 ).
In the present study, we hypothesise that an increase in dietary PL in the presence of supplemented DHA (as TAG) may increase both the de novo PL synthesis and the incorporation of LC-PUFA (especially DHA) into the tissue molecules of both TAG and PL for optimal development and performance of pikeperch larvae during early larval development. Thus, the main objective was to determine optimal levels of SBL-derived PL in formulated extruded starter feeds and the additional effects of n-3 LC-PUFA TAG on performance and development of larval pikeperch. As an increased dietary PL may reduce bone malformations( Reference Saleh, Betancor and Roo 27 , Reference Kanazawa, Teshima and Inamori 31 , Reference Saleh, Betancor and Roo 41 ) and liver proteomic studies can help to understand fish metabolism responses to dietary changes( Reference Addis 42 , Reference Rodrigues, Silva and Dias 43 ), to better understand the physiological mechanisms implied in the effect of PL and n-3 LC-PUFA on larval performance, studies on hepatic proteomics, expression of lipid metabolism related genes, digestive enzymes activity and skeleton morphogenesis were also conducted.
Methods
Experimental conditions
Fertilised eggs of pikeperch were obtained from Aquapri Innovation, Egtved, Denmark and transferred in oxygenated plastic bags to DTU Aqua at the North Sea Research Centre, Denmark. Eggs were incubated until hatching in upflow McDonald type incubators with a flow-through system. Freshwater heated at 17·5°C from a temperature-controlled 10 m3 reservoir was constantly supplied. Hatched larvae were distributed into two 0·5 m3 fibreglass tanks and kept until 10 d post-hatch (DPH) at 19·5–20·3°C and constant low-intensity light. From 3 to 10 DPH, larvae were fed newly hatched non-enriched Artemia nauplii (strain MC460; INVE, kept at 5°C after hatching) for 2×8 h through a peristaltic pump (longer pumps, BT300-2J; Langer Instruments Corp.) to make sure that live Artemia nauplii were always present ad libitum (i.e. 1–3 individuals/ml) in the tanks. At 10 DPH, all larvae were mixed and moved to another temperature-controlled freshwater flow-through larval system consisting of eighteen conical tanks of 46 litre. Pikeperch larvae were manually distributed into these tanks at a density of seventeen larvae per litre and fed one of the six experimental dry diets until 30 DPH under a water temperature of 20–20·5°C and at dimmed light (30–40 lux at water surface) provided by electrical LED bulbs. Daily, the flow rate was adjusted at 15 litres/h per tank, and oxygen (7·8 (sd 0·4) mg/l) and temperature (20·2 (sd 0·1)°C) were monitored by a hand-held oxymeter (OxyGuard).
In total, six isonitrogenous and isoenergetic diets (Table 1) were formulated to contain three PL levels (PL1, PL2 and PL3), adding 3, 10 and 19 % SBL, and these same PL levels combined with increased DHA levels (PL1H1, PL2H2 and PL3H3) adding 0·55, 2 and 3·4 % Algatrium DHA70. Supplementation with SBL replaced olive oil in the diets. Olive oil with a high oleic acid content was used (>81 % wet weight) and with a limited n-6 and n-3 PUFA content. Experimental diets were manufactured by SPAROS. All powder ingredients were initially mixed and ground in a micropulveriser hammer mill (SH1; Hosokawa-Alpine). Subsequently, the oils were added, diets humidified with 25 % deionised water and agglomerated by a low-shear and temperature-controlled extrusion process (P55; Italplast). The resulting pellets (0·8 mm) were dried in a convection oven for 3 h at 40°C (OP 750-UF; LTE Scientifics), crumbled (103; Neuero Farm) and mechanically sieved (Eco-Separator; Russell-Finex) to particle size ranges (400–600 and 800 µm).
Table 1 Feed formulation and proximate analysis of the six experimental diets
TFA, total fatty acids; NFE, N-free extract.
* MicroNorse Fish Meal: 71 % crude protein and 9·8 % crude fat; Tromsø Fiskeindustri AS.
† Soluble fish-protein concentrate (CPSP 90): 84 % crude protein and 12 % fat; Sopropêche.
‡ Squid meal: Super prime squid meal: 80 % crude protein and 3·5 % crude fat; Sopropêche.
§ Fish gelatin: 88 % crude protein, 0·1 % crude fat; LAPI Gelatine SPA.
|| Wheat gluten: VITAL 83·7 % crude protein and 1·4 % crude fat; Roquette Frères.
¶ Wheat meal: 11·7 % crude protein and 1·6 % crude fat; Casa Lanchinha.
** Algatrium DHA70: Brudy Technologies.
†† Olive oil: Henry Lamotte Oils GmbH.
‡‡ PVO40.01 premix for marine fish (Premix Lda); vitamins (per kg diet): 100 mg dl-α tocopherol acetate, 25 mg sodium menadione bisulphate, 20 000 IU retinyl acetate, 2000 IU dl-cholecalciferol, 30 mg thiamin, 30 mg riboflavin, 20 mg pyridoxine, 0·1 mg B12, 200 mg nicotinic acid, 15 mg folic acid, 1000 mg ascorbic acid, 500 mg inositol, 3 mg biotin, 100 mg calcium panthotenate, 1000 mg choline chloride and 500 mg betaine; minerals (per kg diet): 2·5 mg cobalt sulphate, 1·1 mg copper sulphate, 0·2 g ferric citrate, 5 mg potassium iodide, 15 mg manganese sulphate, 0·2 mg sodium selenite, 40 mg zinc sulphate, 0·6 g magnesium hydroxide, 1·1 g potassium chloride, 0·5 g sodium chloride and 4 g calcium carbonate.
§§ Soya lecithin powder: Lecico P700IPM; LECICO GmbH.
|||| Binder (guar gum): HV109; SEAH International.
¶¶ Antioxidant powder: Paramega PX; KEMIN EUROPE NV.
*** Antioxidant liquid: NATUROX; KEMIN EUROPE NV.
††† TFA, thirty-four analysed.
From 10 to 17 DPH, triplicate groups of larvae were co-fed one of the six experimental dry feeds together with newly non-enriched Artemia nauplii (INVE) from 08.00 to 22.00 hours. During this period, Artemia feeding was daily postponed by 1 h. From 10 to 17 DPH, larvae were fed a diet with a pellet size of 400–600 µm (initially further ground in a mortar to 200–250 µm), which was gradually increased to 600–800 µm during the 2nd week. A mixture of these two size ranges was applied for the remaining experiment until 30 DPH. Dry feed was daily administered by eighteen programmable automatic feeders (screw feeders; made by DTU Aqua), which allowed very small quantities to be fed at short specific time intervals (approximately 15 min) during the entire feeding period. Dry feeds were administered at 25 % of expected larval biomass in the 1st weeks and 10–15 % during the last week. Larvae were not fed 12 h before sampling for analytical purpose to ensure an empty gut. Tank bottom was daily vacuum-cleaned to remove uneaten feed and to count dead larvae.
Larval sampling
A representative number of larvae (2×100) were sampled at hatching (0 DPH) and 10 DPH for FA analysis and fifty larvae sampled for initial weight measurement. At 30 DPH, 2×10 larvae per replicate tank were sampled for PL and FA analysis. In all, ten larvae per tank were sampled for analysis of digestive enzymes at 30 DPH. In addition, 2×10 larvae per replicate were sampled for proteomics at 30 DPH. All larvae were killed by an overdose of benzocaine and immediately frozen and kept at –80°C until analysis. At 30 DPH, an additional ten larvae per tank were sampled for larval organ and skeleton development for specific staining of bone and cartilage and stored in 10 % phosphate-buffered formaldehyde. To quantify the gene expression involved in skeletal development, ten larvae per replicate were sampled and stored in RNA-later overnight and frozen at −80°C until analysis.
Larval survival and growth
Daily mortality was assessed by the number of registered dead larvae, whereas the total number of alive larvae manually counted at the end of the trial was considered as the final survival in each tank. Growth was determined by individually weighing 100 randomly sampled larvae at 10 DPH and thirty-five larvae per replicate tank at 30 DPH. Each anaesthetised larva was wiped to remove excess water (medical care tissue cloth) and weighed to the nearest 0·01 mg on a Mettler Toledo AT200. Mean larval weight at 10 DPH was 1·95 (sd 0·31) mg wet weight and 0·56 (sd 0·09) mg DM. Specific daily growth rate (SGR) (% per d) was calculated according to the following equation: SGR = (ln (final average body weight of sampled larvae) −ln (initial average body weight of sampled larvae))×100/feeding days.
Biochemical analysis
Representative samples of the six diets were homogenised using a Krups Speedy Pro homogenizer 244 and analysed for DM and ash (NMKL, 1991), crude protein 245 (ISO 2005; crude protein; Kjeldahl N×6·25) and crude lipid( Reference Bligh and Dyer 44 ). N-free extract (NFE) was calculated as DM minus the sum of crude protein, crude lipid and ash. The proximate composition of the diets was similar in terms of protein, lipid, NFE and ash content and with almost identical values of the essential amino acids, lysine, methionine and cysteine and the sulphur-containing non-protein amino acid taurine (Table 1).
The FA composition in diets (Table 2) and larvae (Table 3) was determined by lipid extraction with a chloroform–methanol mixture( Reference Folch, Lees and Sloane Stanley 45 ) and either sonicated in an ultrasound cleaner, model Branson, 2510, or homogenised (larger larvae) by a tissue-tearor probe with a diameter of 4·5 mm (Biospec Products, Inc.). Trans-esterification of the lipids was performed by acetyl chloride in methanol at 95°C. The FA methyl esters were analysed by GC–MS. Peaks on a given chromatogram were identified by comparison with the retention time of a commercial mix of a known FAME standard, SUPELCO 18919 (4 : 0–24 : 0), from SIGMA. Peaks were quantified by means of the target response factor of the FA and 23 : 0 as internal standard. FA concentrations were calculated (version E.02.02.1431; ChemStation) on the basis of the quantified peaks of the standard series and the samples, as well of dry weight of prey and larvae, and expressed as ng/sample.
Table 2 Analysed total fatty acids (TFA) content (mg/g DM) and fatty acid (FA) composition (% of TFA) of the six experimental dietsFootnote *(Mean values and standard deviations, n 2)
* PL1, PL2 and PL3 (soyabean lecithin (SBL): 3, 10 and 19 %); PL1H1, PL2H2 and PL1H3 (SBL: 3, 10 and 19 %) + Algatrium DHA 70: 0·55, 2·05 and 3·4 %.
Table 3 Analysed total fatty acids (TFA) content and fatty acid (FA) composition (% of TFA) of total lipids in pikeperch larvae at 0 and 10 d post-hatch (DPH), as well as in 30 DPH (mg/g, wet weight), after 20 d of feeding experimental dietsFootnote *(Mean values and standard deviations, n 3)
ARA, arachidonic acid.
a,b,c,d,e Mean values (for larvae fed the experimental diets (30 DPH) within a row followed by unlike superscript letters were significantly different (P<0·05).
* PL1, PL2 and PL3 (soyabean lecithin (SBL): 3, 10 and 19 %); PL1H1, PL2H2 and PL1H3 (SBL: 3, 10 and 19 %) + Algatrium DHA 70: 0·55, 2·05 and 3·4 %.
A total of thirty-four FA were analysed, with the twenty most relevant FA shown (Tables 2 and 3). Total FA (TFA) differed between the diets and decreased by substitution of olive oil with SBL. The main differences in dietary FA profiles (% TFA) were related to oleic acid (18 : 1n-9), linoleic acid (18 : 2n-6), α-linolenic acid (18 : 3n-3), EPA, DHA and consequently total MUFA, n-6 PUFA and n-3 PUFA (Table 2). 18 : 2n-6 and 18 : 3n-3 content increased by the increased supplementation of SBL, for which 18 : 2n-6 is the dominant FA (approximately 55 % TFA, data not shown) with the additional content of some 18 : 3n-3 (3 % TFA). Diets PL1H1–PL3H3 contained significantly increased levels of EPA and DHA (as compared with diets PL1–PL3) owing to the supplementation of Algatrium DHA 70.
Quantification of PL in diets and larvae was performed by Spectral Service AG, by use of 31P-NMR spectroscopy using an internal standard according to the method previously described( Reference Menses and Glonek 46 ). Preweighed homogeneous subsamples of feed or larvae (30 DPH) were used, and before analysis larvae for each replicate were freeze-dried for 24 h on an Adolf Kühner AG Beta 2-16. NMR analyses were carried out on a Bruker DRX 600 spectrometer (Bruker Biospin GmBH), resonating at 600·13 MHz for 1H and 150·90 for 13C, using a 5-mm BBO probe at 297 K. For the quantification of PL in the samples, a defined amount of the test substance and corresponding internal standard (exactly weighed) were dissolved in CDCL3, methanol and aqueous CS-EDTA solution (0·2 m, pH 7·5). After 30 min of shaking, the organic layer was separated by centrifugation and measured with 31P-NMR. The integrated signals of the test substance and of the internal standard triphenylphosphate were used for calculation.
The dietary analytical content of the three main PL classes identified increased as expected by dietary incorporation of SBL (Table 1). Total PL content ranged from 3·7 % (% of lipids) for PL1 and PL1H1 to approximately 14·4–14·5 % for diets PL3 and PL3H3.
Digestive enzyme activity
The heads and tails of pikeperch (S. lucioperca) larvae were removed to isolate the digestive segment on a glass maintained on ice (0°C), and the stomach region was separated with the intestinal segments. Pooled samples from each tank were homogenised in 10 volumes (v/w) of cold distilled water. Assay of the cytosolic peptidase, leucine–alanine peptidase (leu–ala), was performed according to the method of Nicholson & Kim( Reference Nicholson and Kim 47 ) using leucine–alanine (Sigma-Aldrich) as substrate. Alkaline phosphatase (AP) and aminopeptidase N, two enzymes of brush border membrane, were assayed according to Bessey et al.( Reference Bessey, Lowry and Brock 48 ) and Maroux et al.( Reference Maroux, Louvard and Baratti 49 ) using p-nitrophenyl phosphate (Sigma-Aldrich) and l-leucine p-nitroanalide (Sigma-Aldrich) as substrates, respectively. Pepsin was assayed by the method of Worthington( Reference Worthington 50 ) modified by Cuvier–Péres and Kestemont( Reference Cuvier-Péres and Kestemont 51 ). Trypsin and amylase activities were assayed according to Holm et al.( Reference Holm, Hanssen and Krogdahl 52 ) and Metais and Bieth( Reference Metais and Bieth 53 ), respectively such as described by Gisbert et al.( Reference Gisbert, Giménez and Fernández 54 ). Protein was determined using the Bradford procedure( Reference Bradford 55 ). Enzyme activities are expressed as specific activities (mU/mg protein).
Skeleton anomalies and related gene expression
Skeleton analyses were conducted on fixed 30 DPH pikeperch larvae. These were stained with alizarin red to evaluate the skeletal anomalies and vertebral mineralisation according to methods( Reference Izquierdo, Scolamacchia and Betancor 56 ) modified from previous studies( Reference Vandewalle, Gluckmann and Wagemans 57 ). Classification of skeletal anomalies was conducted according to Boglione et al.( Reference Boglione, Gagliardi and Scardi 58 ). Anomalies were expressed as frequency of total severe anomalies and specific anomalies, such as cranial, dentary, branchiostegal, prehaemal and caudal vertebrae, within each dietary group. The effects of the different weaning diets on the axial skeleton mineralisation were evaluated considering the total number of completely mineralised vertebral bodies within a larval size class.
Total RNA from larvae samples (average weight per sample 60 mg) was extracted using the Rneasy Mini Kit (Qiagen). Total body tissue was homogenised using the Tissue Lyzer-II (Qiagen) with QIAzol lysis reagent (Qiagen). Samples were centrifuged with chloroform for phase separation (12 000
g
, 15 min, 4°C). The upper aqueous phase containing RNA was mixed with 75 % ethanol and transferred into an RNeasy spin column where total RNA bonded to a membrane and contaminants were washed away by RW1 and RPE buffers (Qiagen). Purified RNA was eluted with 30 µl of RNase-free water. The quality and quantity of RNA were analysed using the NanoDrop 1000 Spectrophotometer (Thermo Scientific) and by electrophoresis of total RNA in a 1 % agarose gel. Synthesis of complementary DNA (cDNA) was conducted using the iScript cDNA Synthesis Kit (Bio-Rad) according to manufacturer’s instructions in an iCycler thermal cycler (Bio-Rad). Primer efficiency was tested with serial dilutions of a cDNA pool (1, 1 : 5, 1 : 10, 1 : 15, 1 : 20 and 1 : 25). Product size of the real-time quantitative PCR amplification was checked by electrophoresis analyses using PB322 cut with HAEIII as a standard. Real-time quantitative PCR was performed in an iQ5 Multicolor real-time PCR detection system (Bio-Rad; Hercules) using RAG1 as the housekeeping gene in a final volume of 20 µl/reaction well, and 100 ng of total RNA reverse-transcribed to complementary cDNA. Each gene sample was analysed once per gene. The PCR conditions were as follows: 95°C for 3 min 30 s followed by forty cycles of 95°C for 15 s, 61°C for 30 s and 72°C for 30 s, 95°C for 1 min and a final denaturing step from 61 to 95°C for 10 s. Data obtained were normalised and the Livak method ( $2^{{{\minus}\Delta \Delta C_{t} }} $
) was used to determine relative mRNA expression levels. Pikeperch-specific gene primers were designed after searching the NCBI nucleotide database and using the Oligo 7 Primer Analysis software (Molecular Biology Insights). Within the oligo used, RAG1, ALP, Twist2, Mef2c and Sox9 oligonucleotide primers were designed by extracting fish mRNA sequences from NCBI, aligning with MEGA 7 software and identifying conserved domains, to which primers were designed using Primer3 (version 0.4.0) program. Target specificity was tested by sequencing the resulting amplicons and comparing with the NCBI sequence database using BLAST. Detailed information on primer sequences and accession numbers is presented in Table 4.
$2^{{{\minus}\Delta \Delta C_{t} }} $
) was used to determine relative mRNA expression levels. Pikeperch-specific gene primers were designed after searching the NCBI nucleotide database and using the Oligo 7 Primer Analysis software (Molecular Biology Insights). Within the oligo used, RAG1, ALP, Twist2, Mef2c and Sox9 oligonucleotide primers were designed by extracting fish mRNA sequences from NCBI, aligning with MEGA 7 software and identifying conserved domains, to which primers were designed using Primer3 (version 0.4.0) program. Target specificity was tested by sequencing the resulting amplicons and comparing with the NCBI sequence database using BLAST. Detailed information on primer sequences and accession numbers is presented in Table 4.
Table 4 Sequences of primers used for gene expression analysis
F, forward; R, reverse.
Proteomics
Slightly thawed larvae (30 DPH) were dissected on a glass plate maintained at 0°C. The liver was extracted and immediately frozen in liquid N2 and kept at −80°C until analysis. In total, three independent biological replicates were used for each experimental condition. The soluble protein fractions were harvested by centrifugation at 12 000 g for 15 min at 4°C. The pH of the protein extract was adjusted to 8·5 by addition of an appropriate volume of 50 mM NaOH and protein concentration was evaluated using a Pierce 660-nm protein assay kit as described by the manufacturer. Minimal labelling of samples (containing 25 μg of solubilised proteins) was performed on ice for 30 min in the dark using three cyanine dyes (Cy2, Cy3 and Cy5), and quenched with 1 mm lysine for 10 min. Cy2 was used as the internal standard and was composed of equal amounts of proteins from each sample, whereas Cy3 and Cy5 were used to individually label the samples. The three labelled mixtures were combined and the total proteins (75 µg) were added v-v reducing buffer (7 m urea, 2 m thiourea, 2 % 1,4-dithiothreitol, 2 % 3-[(3-cholamidopropyl)dimethylammonio]-1-propanesulfonate (CHAPS) and 2 % immobilised pH gradient (IPG) 4–7 buffer) for 15 min at room temperature in the dark. These mixtures were then cup-loaded on immobilised pH gradient strips (24 cm, pH 4–7; GE Healthcare) and passively rehydrated overnight with a rehydration buffer. The isoelectric focusing was performed with an Ettan™ IPGphor II isoelectric focusing unit (GE Healthcare) at 20°C for a total of 68 000 Vh. IPG strips were then reduced (1 % 1,4-dithiothreitol) and alkalised (2·5 % iodoacetamide) in equilibration buffer just before being loaded onto a 10 %, 24-cm, 1-mm-thick acrylamide gel. The strips were run in an Ettan™ DALTsix electrophoresis unit (GE Healthcare) at constant 0·5 W/gel. The gels were then scanned with a Typhoon 9400 scanner (GE Healthcare) at wavelengths specific for the CyDyes (488 nm for Cy2, 532 nm for Cy3 and 633 nm for Cy5). Image analysis, with a resolution of 100 μm, was performed using the DeCyder BVA 5.0 software (GE Healthcare). Data were analysed using one-way ANOVA followed by the Tukey’s post hoc test (using the Statistica 5.5 software, 2000; StatSoft, Inc.) when significant differences between groups were found (P<0·05).
For peptide sequencing and protein identification, preparative gels including 150 μg of proteins of mixed samples were performed (pH 4–7 IPG strips, 10 % acrylamide). Gels were post-stained with 10 % krypton overnight after 30 min of fixation, twice, in 40 % ethanol and 10 % acetic acid. The proteolytic digestion was performed on excised spots by the addition of 3 μl of modified trypsin (Promega) suspended in 100 mm NH4HCO3 cold buffer. Proteolysis was performed overnight at 37°C. The supernatants were collected and kept at −20°C before analysis. Peptides were analysed by using nano-LC-ESI–MS/MS maXis Impact UHR-TOF (Bruker) coupled with a nanoLC UltiMate 3000 (ThermoFisher). Scaffold (version Scaffold-4.6.1; Proteome Software Inc.) was used to validate MS/MS-based peptide and protein identifications. All MS/MS samples were analysed using Mascot (version 2.4; Matrix Science) and X!Tandem (The GPM, thegpm.org). In all protein identifications, only significant hits as defined by Mascot probability analysis (using the algorithm Peptide Prophet)( Reference Keller, Nesvizhskii and Kolker 59 , Reference Nesvizhskii, Keller and Kolker 60 ) were considered initially, with a significance threshold set at 0·01. Proteins were functionally annotated using AgBase-Goanna( Reference McCarthy, Wang and Magee 61 ) as described in Roland et al.( Reference Roland, Kestemont and Hénuset 62 ). The false discovery rate was always set at 0 %. The GO categories for biological processes were then sorted to determine the most common ones represented by the proteins identified. The mean number of proteomic spots detected per gel was 1917 (sd 498). A one-way ANOVA among the six experimental groups revealed twenty-seven spots with differential intensity at P<0·05. These spots were selected for statistical analyses and MS/MS identifications. Of the twenty-seven spots picked up for MS analysis, seventeen spots contained one protein identification per spot, and this led to the identification of fifteen different proteins.
Statistics
Percent data were arcsine-transformed before analysis. Experimental data were subjected to a one-way or two-way ANOVA and all pairwise multiple comparison of means test for determining significance of differences among the four treatment groups where applicable. Linear regression was used to determine correlation of dietary FA, phosphoglyceride content and larval content, as well as enzymatic activity. For larval survival, final weight, growth, FA, PL composition and enzymatic activity, the SigmaPlot 13.0 software was used and Holm Sidak test applied. For skeletal anomalies and related gene expression, the IBM SPSS Statistics 21 software was used and Tukey’s test applied. For proteomics data, peptide sequencing and protein identification, the Statistica 5.5 software was used and Tukey’s test applied. Levene’s test was used to check for homogeneity of variance within the treatment groups. Values throughout the text are expressed as the mean values and standard deviations. In all statistical tests used, P<0·05 was considered statistically different. All analyses were based on larval samples obtained from triplicate groups, as described previously.
Ethical standards
The study has been conducted in accordance with national and international guidelines according to animal welfare ethics and approved. The ARRIVE guidelines for animal research studies have been followed.
Results
Larval survival and growth
From 15 DPH, there was an increase in daily larval mortality (data not shown), regardless of tanks and dietary codes. At the end of the trial (30 DPH), the sum of daily registered mortality suggested a survival ranging from 57 to 61 % for the different tanks and without significant differences among dietary treatments (P≥0·553). However, based on the remaining number of alive larvae at the end of the trial, the actual survival was much lower (10–14 %), but neither statistically different (P≥0·633).
Mean final larval weight at 30 DPH ranged from 92 to 154 mg wet weight (Fig. 1). Dietary inclusion of PL resulted in an increase in body weight, and additional supplementation of DHA (+EPA) in the form of Algatrium DHA 70 further increased weight. Thus, larvae fed the highest DHA and PL levels (diet PL3H3) showed the highest mean body weight, being significantly larger than in those fed PL1 (P<0·001), PL2 (P≤0·01) and PL1H1 (P<0·001). PL2H2 larvae were larger than those fed PL1 (P<0·03) and PL1H1 (P≤0·001). Finally, PL2 and PL3 larvae were both larger than larvae fed PL1H1 (P≤0·04 and P≤0·01, respectively). Overall, larval growth calculated as SGR was lowest for PL1H1 (21·2 %/d) and highest for PL3H3 (24·3 %/d) (Fig. 1).
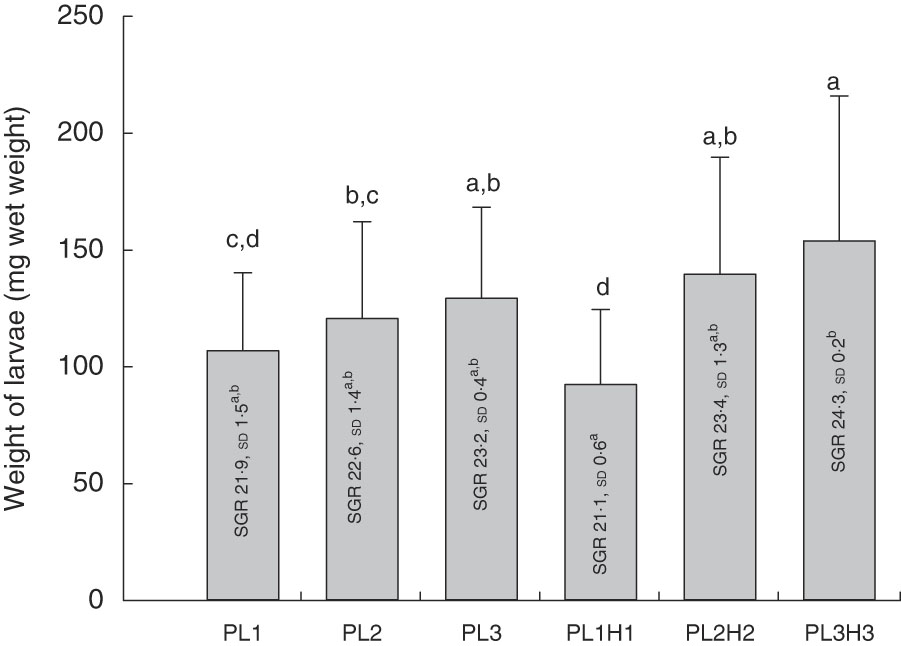
Fig. 1 Mean final body weight (mg wet weight; bars) of larvae fed experimental diets for 20 d (10–30 DPH). PL1, PL2 and PL3 (soyabean lecithin (SBL): 3, 10 and 19 %); PL1H1, PL2H2 and PL1H3 (SBL: 3, 10 and 19 %) + Algatrium DHA 70: 0·55, 2·05 and 3·4%. Final body weight values are pooled means of three tank replicates (n 35 fish per tank), and standard deviations represented as vertical bars. Specific daily growth rate (SGR) (%/d, values inside each bar, n 3 replicate tanks and standard deviations). a,b,c,d Mean values for each diet group with unlike letters were significantly different (P<0·05).
Biochemical analysis
There was a marked decrease in larval EPA and DHA larval composition from 0 to 10 DPH and a corresponding increase in stearic acid (18 : 0), oleic acid (18 : 1) and 18 : 3n-3 (Table 3). Larval FA content at 30 DPH reflected dietary formulation and the increase in supplementation of PL and Algatrium DHA70 at the expense of olive oil, the main contributor of oleic acid (Table 3). The highest inclusion of Algatrium DHA 70 caused an increase of DHA content in larvae of PL3H3 about 2·5 times higher than that of PL3-fed larvae, whereas it was 1·5 times higher for EPA. An increased substitution of olive oil with SBL without LC-PUFA supplementation (PL2 and PL3) caused a significantly lower n-3/n-6 in larvae compared with the other larval groups. An overall very significant larval/dietary correlation was observed for all larval groups for both oleic acid (P<0·001; R 2 0·99·6) and for DHA and EPA (P<0·001, R 2 0·98) and P=0·016, R 2 0·80), respectively. Consequently, larval DHA:EPA was significantly correlated to diet DHA:EPA (P<0·001, R 2 0·97).
PC was the major PL class in diets and larvae (Fig. 2). In larvae, it constituted between 68 and 73 % of the total PL content and was not significantly different between treatment groups (P≥0·241). An increase in the dietary content of PC increased the larval PC tissue content (Fig. 3a); however, this correlation was not significant for any of the two groups PL1–PL3 (P≥0·14) or PL1H1–PL3H3 (P≥0·12). The phosphatidylethanolamine (PE) tissue content in larvae fed diet PL3H3 was significantly lower than in larvae fed PL2 and PL3 (P<0·03; Fig. 2). For larvae fed diets PL1, PL2 and PL3, an increase in the dietary PE content slightly increased larval content (Fig. 3b), but the correlation was not significant (P≥0·62). However, for larvae fed diets PL1H1, PL2H2 and PL3H3, a strong negative tissue content correlation was observed with dietary PE content (P=0·001) (Fig. 3b). For PL1–PL3 larval groups, a dietary increase in PI slightly increased larval PI content; however, the correlation was not significant (P≥0·91). PL1H1–PL3H3 displayed on contrast a significant negative PI diet:PI larval correlation (P=0·05). For other minor PL classes analysed, there were no significant differences among content in larvae between groups, although analysed contents in all diets were below detection.
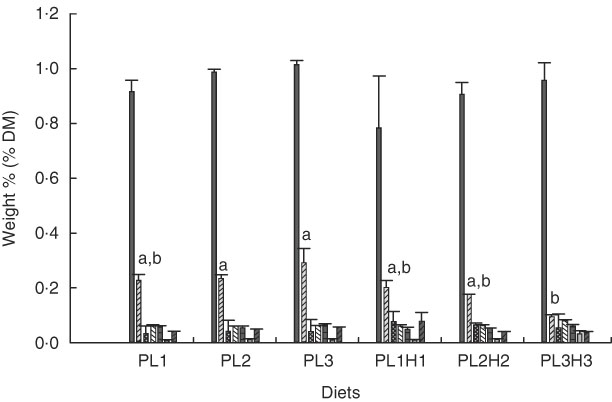
Fig. 2 Phospholipid class composition in larvae (% DM mean values and standard deviations, n 3 replicate tanks) fed experimental diets for 20 d (10–30 DPH). PL1, PL2 and PL3 (soyabean lecithin (SBL): 3, 10 and 19 %). PL1H1, PL2H2 and PL1H3 (SBL: 3, 10 and 19 %) + Algatrium DHA 70: 0·55, 2·05 and 3·4 %. ![]() , Phosphatidylcholine;
, Phosphatidylcholine; ![]() , phosphatidylethanolamine;
, phosphatidylethanolamine; ![]() , phosphatidylinositol;
, phosphatidylinositol; ![]() , sphingomelin;
, sphingomelin; ![]() , phosphatidylserine;
, phosphatidylserine; ![]() , lysophosphatidylcholine;
, lysophosphatidylcholine; ![]() , N-acyl phosphatidylethanolamine. a,b Mean values for each diet group with unlike letters were significantly different (P<0·05).
, N-acyl phosphatidylethanolamine. a,b Mean values for each diet group with unlike letters were significantly different (P<0·05).
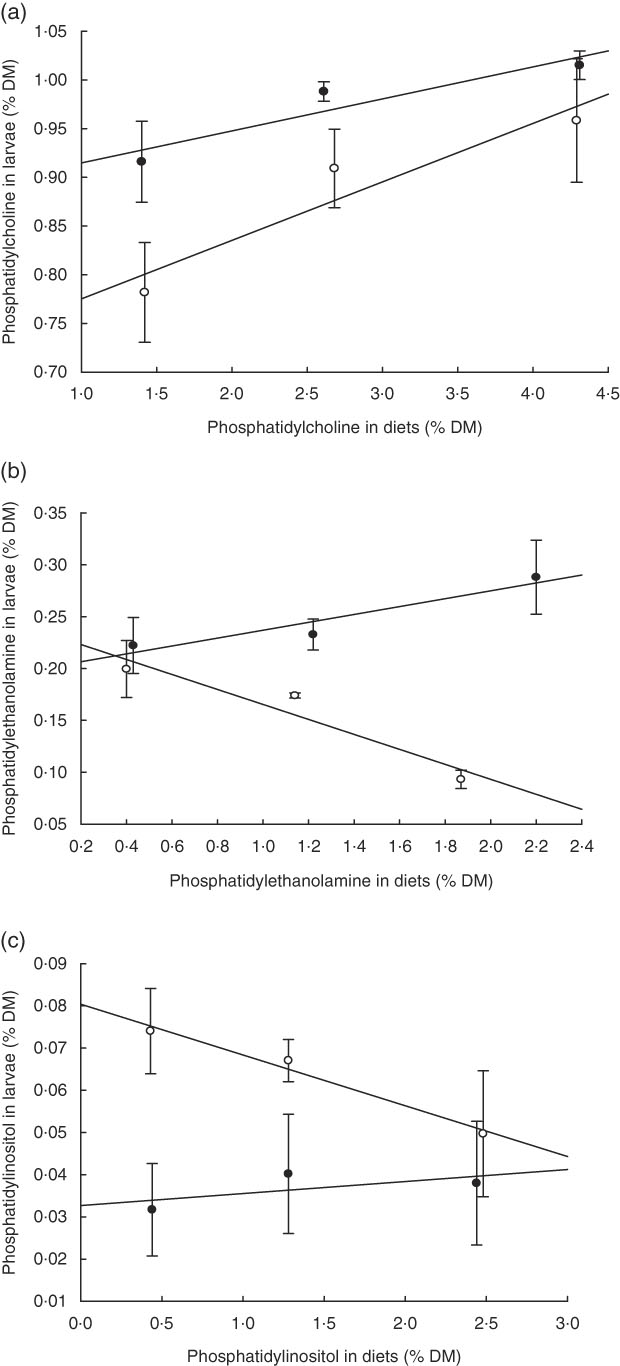
Fig. 3 (a–c) Dietary: larval tissue phospholipid class correlation when fed experimental diets for 20 d (10–30 DPH). Values are means (n 3) replicate tanks. a: ![]() , (PL1–PL3) y: 1·40x+0·88; r
2 0·88;
, (PL1–PL3) y: 1·40x+0·88; r
2 0·88; ![]() , (PL1H1–PL3H3) y: 1·42x+0·72; r
2 0·91; b:
, (PL1H1–PL3H3) y: 1·42x+0·72; r
2 0·91; b: ![]() , (PL1–PL3) y: 0·43x+1·98; r
2 0·91;
, (PL1–PL3) y: 0·43x+1·98; r
2 0·91; ![]() , (PL1H1–PL3H3) y: 0·40x−0·238; r
2 0·92; c:
, (PL1H1–PL3H3) y: 0·40x−0·238; r
2 0·92; c: ![]() , (PL1–PL3) y: 1·44x+0·03; r
2 0·42;
, (PL1–PL3) y: 1·44x+0·03; r
2 0·42; ![]() , (PL1H1–PL3H3) y: 0·43x+0·08; r
2 0·97.
, (PL1H1–PL3H3) y: 0·43x+0·08; r
2 0·97.
Digestive enzyme activity
No significant differences were observed in larval pepsin activity (Table 5), despite a general trend for a higher activity in pikeperch larvae fed increased PL and DHA contents. In this sense, a significant positive linear correlation was found among the two parameters (y=0·4971x+45·397; r 2 0·934) (Fig. 4). Trypsin activity was significantly higher in larvae fed PL1H1 than in those fed PL2, PL3 and PL3H3 (P=0·003; Table 5). Results showed that an increase in DHA, particularly from PL2 to PL2H2, significantly reduced trypsin activity. In addition, a dietary increase in both PL and DHA from PL1H1 to PL3H3 significantly reduced trypsin activity (P=0·003). On the other hand, despite the increase in dietary PL from PL1 to PL3, it did not significantly affect larval trypsin activity (Table 5). Aminopeptidase activity was lowest in larvae fed PL2 compared with those fed PL3, PL2H2 and PL3H3 (P=0·001). An increase in dietary PL, particularly from PL2 and PL1H1 to PL3H3, significantly increased aminopeptidase activity. AP was significantly highest for PL3H3 larvae than for PL1H1 larvae (P≤0·038). Thus, despite the increase in dietary PL from PL1 to PL3, it did not significantly affect larval AP activity, but a dietary increase in both PL and DHA from PL1H1 to PL3H3 significantly increased the activity of this enzyme.
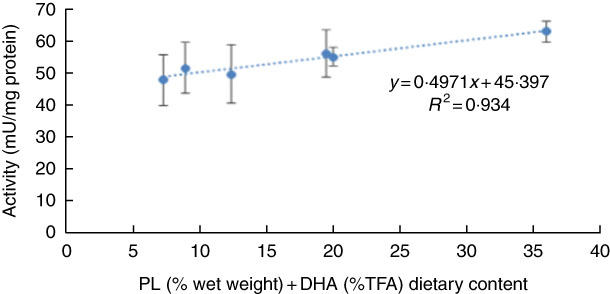
Fig. 4 Effect of dietary phospholipid (PL) (% wet weight) and DHA (% total FA (TFA)) on pepsin-specific activity in pikeperch larvae after 20 d of feeding experimental diets. Values are means (n 3) replicate tanks and standard deviations represented by vertical bars.
Table 5 Larval-specific enzymatic activity (mU/mg protein) in 30 d post-hatch (DPH) pikeperch larvae after 20 d of feeding experimental dietsFootnote *(Mean values and standard deviations, n 3)
a,b,c Mean values within a row followed by unlike superscript letters were significantly different (P<0·05).
* PL1, PL2 and PL3 (soyabean lecithin (SBL): 3, 10 and 19 %); PL1H1, PL2H2 and PL1H3 (SBL: 3, 10 and 19 %) + Algatrium DHA 70: 0·55, 2·05 and 3·4 %.
Skeleton anomalies and related gene expression
Overall there was a high incidence of severe anomalies, particularly those related with endochondral bones, such as cranium or dentary bones. The lowest incidence of severe anomalies was found in PL3H3 pikeperch, followed by PL3 (Table 6). An increase in dietary PL from PL1 to PL3 tended to reduce the incidence of severe anomalies. Moreover, a dietary increase in both PL and DHA from PL1H1 to PL3H3 significantly reduced the occurrence of severe anomalies. The incidence of maxillary anomalies was very low and only detected in larvae fed PL1H1 (Table 6). Dentary bone anomalies were significantly lowest in PL3 and PL3H3 larvae and highest in PL2 (Table 6). A similar trend was found in branchiostegal rays (Table 6) and cranial anomalies incidences (Table 6) that were significantly lowest in larvae fed diets PL3H3 and PL3 and highest in PL1 and PL1H1. Indeed, a highly significant inverse correlation was found between the dietary PL content or PC content and the incidence of cranial anomalies (r 2 0·98; P<0·001 or r 2 0·98, P<0·001, respectively) or severe anomalies (r 2 0·89, P<0·01; r 2 0·88, P<0·01, respectively). No significant differences were found in any of the other anomalies studied.
Table 6 Incidence of different bone anomalies (%) in 30 d post-hatch (DPH) pikeperch larvae after 20 d of feeding experimental dietsFootnote *(Mean values and standard deviations, n 3)
a,b Mean values within a row followed by unlike superscript were significantly different (P<0·05).
* PL1, PL2 and PL3 (soyabean lecithin (SBL): 3, 10 and 19 %); PL1H1, PL2H2 and PL1H3 (SBL: 3, 10 and 19 %) + Algatrium DHA 70: 0·55, 2·05 and 3·4 %.
Expression of bone morphogenesis-related genes did not show a clear effect of the different treatments. In fact, no statistical differences were found between larvae fed the different diets for the four genes analysed (Table 7).
Table 7 Gene expression in 30 d post-hatch (DPH) pikeperch larvae after 20 d of feeding experimental dietsFootnote *(Mean values and standard deviations, n 3)
* PL1, PL2 and PL3 (soyabean lecithin (SBL): 3, 10 and 19 %); PL1H1, PL2H2 and PL1H3 (SBL: 3, 10 and 19 %) + Algatrium DHA 70: 0·55, 2·05 and 3·4 %.
Proteomics
Of fifteen different identified proteins, nine proteins displayed a differential intensity between treatments (Tukey’s post hoc test (P<0·05), Table 8). Fatty acid synthase (FAS) is primarily responsible for the synthesis of palmitate (16 : 0) (i.e. SFA with 12, 14 or 16 carbons can be synthesised), which can be further elongated and/or desaturated as it is the main reactor in lipogenesis and FA synthesis. Among the identified proteins, FAS was significantly down-regulated in PL3H3 larvae compared with larvae of PL1, PL2 and PL1H1 (4·36-, 3·65- and 3·50-fold respectively, P<0·01), suggesting a negative relation with DHA levels in larvae (Table 3). Besides, for a given dietary PL content (14·4 %), an increase in total dietary n-3 LC-PUFA from 10·5 to 27·9 % (i.e. Table 2) significantly down-regulated FAS expression; this protein was over-expressed in PL3 larvae compared with PL3H3 (3·54-fold, P=0·002). However, the analysis showed that, for the same level of low total n-3 PUFA content (7·7 %), the increase in dietary PL content did not significantly affect FAS expression (comparison between PL2 and PL1H1 larvae; Table 2).
Table 8 Protein differentially expressed in liver of 30 d post-hatch (DPH) pikeperch larvae after 20 d of feeding experimental diets
PI, isoelectric point; MW, molecular weight.
Another protein related to lipid metabolism, ATP-citrate synthase, was also under-expressed in PL3H3 larvae compared with PL2 larvae (2·60-fold, P<0·05). Similarly, a high PL and LC-PUFA dietary content (diet PL3H3) led to an under-expression for spot 1633, in which two lipid transfer proteins were identified, the non-specific lipid transfer protein and the hydroxysteroid dehydrogenase-like protein 2 (HSDL2), as compared with PL1H1 (1·63-fold, P=0·03). In comparison with larvae reared on PL2, larvae fed PL3H3 displayed a decrease in abundance for two proteins involved in endoplasmic reticulum (ER) stress: the glucose regulated protein (Grp) and the glucose-regulated 94 (Grp94) (Hsp90) (1·70-fold, P=0·007, and 1·52-fold, P=0·03, respectively). A similar pattern of protein expression occurred for Grp94 in PL1H1 larvae compared with PL2 (1·48-fold, P=0·03). In addition, spot number 369 displayed a differential intensity between larval groups PL3H3 and PL1 (1·63-fold, P=0·03), in which both Grp94 and a function ubiquitin carboxyl-terminal hydrolase 5 were identified. Two spots were identified as protein disulphide-isomerase (PDI) (spots 1376 and 1947); according to Tukey’s post hoc test, only spot 1947 displayed a differential intensity that was lower in larvae fed PL1 compared with PL2H2 and PL2 treatment (1·99- and 1·85-fold, P=0·005). Larvae fed PL2 showed also an increase in its abundance compared with PL1H1-fed larvae (1·67-fold, P=0·005). Last, larvae reared on PL1 showed an increase in abundance for a spot identified as Keratin – a cytoskeletal and structural protein – in comparison with PL2H2 and PL3H3 larvae (2·27- and 2·33-fold respectively, P=0·03).
Discussion
Survival was reduced by cannibalism in all tanks, in agreement with previous observations( Reference Hamza, Mhetli and Ben Khemis 2 , Reference Lund and Steenfeldt 3 ). Larval growth was generally high, even when fish were fed the lowest PL and n-3 LC-PUFA dietary levels. An increase in dietary PL levels up to 8 % markedly enhanced larval weight, in agreement with a recent unpublished study with these same diets, where pikeperch larvae fed the lowest PL levels (3·70 and 3·73 %) showed a significantly lower growth. However, elevation of dietary PL from 8 to 14·5 % did not further increase fish growth significantly. These results are in agreement with the optimum PL requirement previously defined for pikeperch (9·5 %) fed SBL( Reference Hamza, Mhetli and Ben Khemis 2 ). Similarly, PL requirements for gilthead seabream (Sparus aurata) fed SBL were approximately 8 %, when larvae were fed five dietary PL levels (4·9–9·6 %)( Reference Saleh, Betancor and Roo 21 ). Pikeperch growth promotion by an increase in dietary PL may be related to a higher feed intake as shown in gilthead seabream and prawn (Penaeus monodon)( Reference Izquierdo, Tandler and Salhi 24 , Reference Koven, Kolkovski and Tandler 63 , Reference Teshima, Kanazawa and Kakuta 64 ). Moreover, an increase in dietary PL tended to increase larval PC contents. This increase in PC at higher dietary PL contents would be in agreement with previous studies showing that PC is the main product of PL synthesis in fish enterocyte( Reference Caballero, Gallardo and Robaina 38 ) and comprises up to 95 % of the PL found in VLDL( Reference Lie, Sandvin and Waagbo 65 ). Moreover, PC has been long considered the most effective PL to promote larval growth( Reference Izquierdo and Koven 12 ). For instance, dietary supplementation with PC, but not PE, stimulated feeding activity in gilthead seabream larvae, probably through the ingestion of the trimethyl group of the choline base of PC that binds to receptor gustatory cells( Reference Hadas 66 ). Nevertheless, growth improvement in pikeperch larvae fed increased PL dietary levels could also be related to an improved lipid transport in agreement with previous studies. For instance, in gilthead seabream, fish fed diets without lecithin accumulated lipid vacuoles in the basal zone of intestinal enterocytes and caused steatosis in hepatic tissue, whereas supplementation with SBL reduced accumulation( Reference Salhi, Hernández-Cruz and Bessonart 37 ) and enhanced lipoprotein synthesis( Reference Liu, Caballero and El-Sayed 20 ).
An increase in dietary PL from 3·72 up to 8·19 % did not significantly affect the incidence of anomalies, which is in agreement with previous studies with pikeperch and similar PL levels (1·4–9·5 %) supplemented with SBL( Reference Hamza, Mhetli and Ben Khemis 2 ). Similar results were found in gilthead seabream, where an increase in dietary SBL did not reduce bone anomalies.( Reference Saleh, Betancor and Roo 41 ) However, in the present experiment, a further dietary PL increase up to 14·38 significantly reduced the incidence of severe skeletal anomalies, and tended to be lowest in fish fed increased DHA dietary levels. This was more evident on anomalies affecting endochondral bones, such as the cranium, where an increase in dietary PL reduced the prevalence of these anomalies. These results are in agreement with those obtained in European sea bass (Dicentrarchus labrax)( Reference Cahu, Zambonino Infante and Barbosa 67 ), although the incidence of anomalies was much lower in seabass than in pikeperch. It should be noticed that the seabass study used higher levels of PC and PI (35 and 16 mg/kg respectively). Despite the differences in prevalence of skeletal anomalies, bone anomaly reduction by PL was not related to the relative expression of the bone-development-related genes studied, such as alp (early mineralisation indicator), twist2, mef2c or sox9 (endochondral bone-development-related genes). This lack of effect could be because of an earlier origin of the anomalies during the first part of the feeding trial, when cartilage was being developed and bones ossified. At the final sampling (30 DPH), bone mineralisation in pikeperch was almost completed. Indeed, in gilthead seabream, an increase in SBL up to 12 % significantly up-regulated alp ( Reference Saleh, Betancor and Roo 21 ). Reduction of bone anomalies by increased PL dietary contents has been related to the specific increase in dietary PI( Reference Sandel, Nixon and Lutzky 68 ), as the second messenger inositol-3-phosphate regulates Ca mobilisation from the ER( Reference Tocher, Bendiksen and Campbell 16 ) and would stimulate osteocalcine production( Reference Izquierdo and Koven 12 ).
In addition to growth improvement, dietary SBL supplementation markedly affected pikeperch larvae FA composition, elevating the 18 : 2n-6, an essential FA for freshwater fish, as well as 18 : 3n-6 and 20 : 3n-6, products of δ-6-desaturase and elongase activity. However, 20 : 4n-6, a product of δ-5-desaturase activity, was not increased; this was in agreement with the low LC-PUFA biosynthetic ability of pikeperch larvae (unpublished results).
Combined supplementation of SBL up to 14·51 % DM PL with n-3 LC-PUFA (1·0 % DM DHA and 0·16 % DM EPA; i.e. 1·17 % LC PUFA) in the form of TAG led to the highest growth and lowest anomalies incidence, improving digestive enzyme activities and liver proteomics. This could be related to either a specific effect of the FA or a combined effect of PL and FA. The latter seems likely, as diets with lowest PL inclusion (3·70 and 3·73 %) but different LC PUFA content (i.e. 0·17 % EPA+0·39 % DHA v. 0·3 % EPA+0·98 % DHA) both lead to a relatively lower growth. A negative effect on growth by a high inclusion level of olive oil; 18 : 1n-9 in both of these diets, however, cannot be excluded as the gradual substitution of olive oil with soya lecithin caused a 3-fold increase in tissue linoleic acid, 18 : 2n-6 levels and a concurrent 2-fold decrease in tissue oleic acid, 18 : 1n-9 content. 18 : 2n-6 may have a growth-promoting effect or a different metabolic fate as compared with 18 : 1n-9, despite the fact that C14-labelled FA analyses have indicated no elongation or desaturation capability in pikeperch larvae (unpublished results). The optimal levels of EPA and DHA in marine fish larvae has been estimated to be about 3 % of dietary DM( Reference Sargent, Tocher and Bell 69 ), whereas for pikeperch larvae an optimal level of 1·2 % DM has been suggested, based on experiments with SBL without n-3 LC-PUFA and fish gonad lecithin with n-3 LC-PUFA( Reference Hamza, Kestemont and Ben Khemis 30 ). In addition, 1·2 % LC-PUFA is very similar to the 1·17 % estimated to be optimal in this experiment – in the presence of 14·5 % PL supplemented as SBL. In agreement with previous studies in marine fish larvae( Reference Izquierdo and Koven 12 , Reference Tocher, Bendiksen and Campbell 16 , Reference Izquierdo, Tandler and Salhi 24 , Reference Gisbert, Villeneuve and Zambonino-Infante 32 , Reference Salhi, Hernández-Cruz and Bessonart 37 , Reference Cahu, Zambonino Infante and Barbosa 67 , Reference Wold, Reitan and Cahu 70 ), marine PL rich in n-3 LC-PUFA could be more effective as a source of essential FA than SBL supplemented with n-3 LC-PUFA. Izquierdo et al.( Reference Izquierdo, Tandler and Salhi 24 ) compared the effect of four isoenergetic, isoproteic and isolipidic diets with either two levels of SBL substituted by oleic acid and supplemented with EPA and DHA in a TAG form or by two levels of marine PL in twenty-five DPH larval seabream. These authors found that PL, regardless of the SBL or marine origin, increased diet ingestion, but also that there was a higher incorporation of n-3 LC-PUFA into the larval polar lipids when these FA were provided in the form of marine PL, which was related with growth improvement( Reference Izquierdo, Tandler and Salhi 24 ). A combined increase in dietary PL and n-3 LC-PUFA interestingly reduced relative PE contents in the larvae, probably with a higher DHA content given the affinity of diacylglycerol ethanolamine phosphotransferase for DHA( Reference Caballero, Gallardo and Robaina 38 ), which could have been related to the proportional increase in PC stimulated by PL and n-3 LC-PUFA( Reference Izquierdo, Tandler and Salhi 24 ). An increase in both dietary PL and n-3 LC-PUFA seemed to cause an inverse relationship (P=0·05) to PI content in larvae. Dietary PI is known to be more effective in reducing deformities than PC. PI and its derivatives have a structural role in the membrane moduling protein kinase C activity, as well as calcium entry into the cell from nuclear reservoirs( Reference Cahu, Zambonino Infante and Takeuchi 71 ), and is believed to be influencing ontogeny of bone synthesis and mineralisation( Reference Sandel, Nixon and Lutzky 68 ). The observed lowest degree of malformation in pikeperch larvae with a combined increase of PL and DHA may involve dietary levels of PI; however, the physiological processes need further investigation.
In the present study, increased PL and n-3 LC-PUFA enhanced the activities of the brush border membrane enzymes, AP and aminopeptidase, in agreement with previous studies( Reference Hamza, Mhetli and Ben Khemis 2 , Reference Saleh, Betancor and Roo 22 , Reference Hamza, Kestemont and Ben Khemis 30 , Reference Gisbert, Villeneuve and Zambonino-Infante 32 , Reference Cahu, Rønnestad and Grangier 72 ). This enhanced enzymatic activity is associated with a higher maturation of the gut followed by growth improvement( Reference Hamza, Mhetli and Ben Khemis 2 , Reference Saleh, Betancor and Roo 22 , Reference Gisbert, Villeneuve and Zambonino-Infante 32 , Reference Cahu and Zambonino-Infante 73 – Reference Ribeiro, Zambonino-Infante and Cahu 75 ), and more precisely with a faster maturational process of the enterocytes( Reference Hamza, Ostaaszewska and Kestemont 76 ). Indeed, in fish larvae, enterocyte morphology is influenced by the developmental stage and dietary composition( Reference Kjørsvik, Olsen and Wold 34 , Reference Kjørsvik, Galloway and Estevez 35 , Reference MacQueen, Homme and Lie 74 ). In our study, the acceleration of gut developmental processes in larvae fed high PL was further supported by the advanced ontogenetical stage in larvae fed high PL suggested by proteomics finding of keratin type II expression.
Trypsin activity displayed an opposite pattern to that of the brush border enzymes in the present study, but also to the pepsin activity. Pancreatic secretion can be modulated by FA( Reference Gisbert, Villeneuve and Zambonino-Infante 32 , Reference Shintani, Takahashi and Fushiki 77 ), as well as by PL. Indeed it has been shown that an improvement in digestion efficiency in high PL-fed fish resulted in an enhanced secretion of cholecystokinine CCK, the primary regulator of pancreatic secretion( Reference Saleh, Betancor and Roo 21 , Reference Zhao, Ai and Mai 78 ). These authors suggested that an increased PUFA content in the biomembrane of larval tissues and intestinal lumen could modulate CCK function( Reference Saleh, Betancor and Roo 21 , Reference Kamaszewski, Ostaszewska and Prusińska 79 ). In this regard, an antagonistic feedback mechanism between CCK and trypsin activity was demonstrated in cod larvae( Reference Drossou 80 ), which further supports the existence of a CCK-releasing factor( Reference Rønnestad, Yufera and Ueberschar 81 ). Despite no significant difference was recorded in pepsin activity, it should be noted that the lowest trypsin activity was associated with the higher pepsin activity. In fact, during the early larval ontogeny, a progressive shift in relative activity from alkaline to acid proteases is observed( Reference Lazo, Mendoza and Holt 82 – Reference Zambonino Infante and Cahu 85 ). As a consequence, the decrease in tryptic activity could be linked to the enhancement of acidic digestion in the stomach of the largest pikeperch larvae.
Liver proteomics were also affected by the combined elevation of PL and n-3 LC-PUFA. For instance, FAS expression was down-regulated in larvae fed PL3H3 compared with PL1 and PL1H1, suggesting a higher energy demand of the smallest larvae. Moreover, FAS seemed to be more regulated by LC-PUFA content than by PL levels, probably as a positive effect of DHA supplementation. Most of the previous studies of FAS regulation have focused on the control of gene expression, suggesting that LC-PUFA may decrease FAS expression through the inhibition of SREBP-1c( Reference Hannah, Ou and Luong 86 , Reference Yahagi, Shimano and Hasty 87 ). Besides, FAS appears to participate in liver TAG metabolism by promoting β-oxidation of FA through the activation of PPARα under nutrient-deficient conditions( Reference Georgiadi and Kersten 88 ). Indeed, FAS is required for generating the PL 1-palmitoyl-2-oleoyl-sn-glycerol-3-phosphocholine (16 : 0/18 : 1-GPC), an endogenous ligand for PPARα ( Reference Chakravarthy, Lodhi and Yin 89 ). However, this interpretation should be considered carefully, taking into account the changes in FAS activity without corresponding changes in FAS protein levels. Equally, we also observed a low expression of ATP-citrate synthase in larvae fed the highest n-3 PUFA/PL diet, which is the primary enzyme responsible for the synthesis of cytosolic acetyl-CoA considered as the principal building block of FA, as acetyl-CoA is converted to malonyl-CoA by acetyl CoA carboxylase.
Another marked effect of dietary PL and n-3 LC-PUFA in pikeperch was the down-regulation of the expression of proteins involved in transfer and exchange of PL and cholesterol such as the non-specific lipid transfer protein and the HSDL2. The non-specific lipid transfer protein, more commonly denoted as sterol carrier protein 2 (SCP2), transfers PL between membranes and sterols (cholesterol and glycolipids)( Reference Bloj and Zilversmit 90 – Reference Bloj and Zilversmit 92 ). This peroxisomal protein is able to bind fatty acyl-CoA, where it is probably involved in the β-oxidation of FA( Reference Kowalik, Haller and Adamski 93 – Reference Wouters, Bastiaens and Wirtz 95 ). Furthermore, its association with the β-oxidation complex could be important for the protection of unsaturated FA intermediates against oxidative attack( Reference Dansen, Kops and Denis 96 ). It is well known that HSDL2 is the product of one of the sterol carrier protein 2 (SCP2) domain encoding genes( Reference Edqvist, Rebetz and Jaras 97 ), thus pointing to its potential involvement in the transport and/or metabolism of FA. Similarly, the peroxisomal localisation of human HSDL2 may suggest also an involvement in fatty acid metabolism( Reference Kowalik, Haller and Adamski 93 ). Previous studies demonstrated that the promoter region for SCP2-encoded gene contains several regulatory domains including a peroxisomal proliferator response element PPRE, which is the specific DNA region of target genes that bind with PPAR( Reference Berger and Moller 98 , Reference Gallegos, Atshaves and Storey 99 ). Therefore, in this study, we hypothesise that the down-regulation of SCP2 observed in this study in PL3H3 larvae may be explained by a deficient PPARα activation owing to the decrease in FAS expression in these larvae as a response to the high dietary n-3 LC-PUFA (explained above). Consistently with this hypothesis, in a recent study, SCP2 gene expression was down-regulated after colon cancer cell transplantation in mice fed high DHA. Besides, the same authors observed a decrease of SCP2 expression in cultured colon cancer cells, HCT-15, after a 48-h treatment with DHA( Reference Zou, Meng and Meng 100 ).
PDI is a multifunctional protein that acts as a catalyst of disulphide bond formation, reduction and isomerisation of newly synthesised proteins( Reference Noiva 101 , Reference Turano, Coppari and Altieri 102 ). In this experiment, an increase in abundance of PDI was observed in the liver of larvae fed PL2 and PL2H2 compared with PL1. A similar pattern of expression was reported in mice fed low- and high-n-3 LC-PUFA diets, suggesting an increase in protein synthesis in high-n-3 LC-PUFA animals( Reference Ahmed, Balogun and Bykova 103 ). On the other hand, in this experiment, a significant difference in PDI expression was recorded between larvae fed the same n-3 LC-PUFA – PL2 compared with PL1HI. The over-expression in PDI in the biggest larvae may reflect an enhanced protein synthesis through high-energy mobilisation for growth. In this sense, Hamza et al.( Reference Hamza, Silvestre and Mhetli 18 ) suggested the enhanced ability to allocate nutrient and energy into tissue formation in pikeperch larvae fed high PL. Moreover, PDI has a chaperone activity under stress; it is synthesised in response to the unfolded protein response pathway (UPR) in the ER lumen( Reference Malhotra and Kaufman 104 ), pointing its important role in the maintenance of ER homoeostasis( Reference Okumura, Kadokura and Inaba 105 ). In this respect, PDI over-expression in PL2 might indicate an ER stress( Reference Dorner, Wasley and Raney 106 ). Similarly, Grp and Grp94, known by their major roles during UPR to maintain ER homoeostasis( Reference Zhu and Lee 107 ), were over-expressed in PL2. Grp94 is a hallmark of the UPR response defined as an HSP90 family member commonly denoted endoplasmin( Reference Marzec, Eletto and Argon 108 ). This protein together with PDI and other folding factor components form a functional folding network under a coordinate transcriptional regulation( Reference Marzec, Eletto and Argon 108 ). As mentioned above, both Grp and Grp94 were over-expressed in larval group PL2 compared with PL3H3 in this study, suggesting a reduced sensitivity to stress thanks to the dietary PL supplementation( Reference Cahu, Rønnestad and Grangier 72 , Reference Kontara, Coutteau and Sorgeloos 109 ). Interestingly, the same pattern of expression regarding the response to the dietary PL was observed in PL1 and PL3H3 treatments. Indeed, apart from Grp94, another protein was identified, that is, the ubiquitin carboxyl-terminal hydrolase L5, which participates in a cellular pathway responsible for the degradation of misfolded and damaged proteins involved in the ubiquitin proteasome system( Reference Ciechanover and Brundin 110 ). However, the over-expression of Grp94 in PL2 as compared with PL1H1 (same n-3 LC-PUFA content) supports the importance of a balanced inclusion of both PL and n-3 LC-PUFA in the formulation of pikeperch diets.
The reduction in the different isoforms of the keratin type II detected in liver of pikeperch fed increased PL and n-3 LC-PUFA could indicate an advanced developmental stage in these larvae, as it has been shown that keratin type II displays a differential expression pattern during the early ontogeny of fish, with a higher abundance in younger larvae( Reference Sveinsdóttir, Vilhelmsson and Gudmundsdóttir 111 ).
Conclusion
In conclusion, this study confirms the importance of high PL levels of approximately 8 % in diets for pikeperch, as well as the positive additional beneficiary effect of supplementation with DHA+ EPA in the form of concentrated TAG in otherwise identical formulated diets. Thus, combined supplementation of SBL up to 14·51 % DM PL with n-3 LC-PUFA (1·00 % DM DHA and 0·16 % DM EPA) in the form of TAG led to the highest growth and lowest anomalies incidence, which improved digestive enzyme activities and liver proteomics. Overall, the results denote that essential FA may be directly supplemented as TAG to have a beneficial effect in pikeperch larvae development. Confirmatory larval studies in pikeperch larvae should involve effects of TAG- and PL-supplemented LC-PUFA and resultant FA composition in PL and NL tissue fractions.
Acknowledgements
The authors thank Thorsten Buchen and Rute Azevedo, Spectral Service AG, Germany, for their kind assistance regarding phospholipid 31P NMR spectroscopic analyses.
This study has been supported under the framework of the European Union Seventh Framework Programme project DIVERSIFY (KBBE-2013-07 single stage, GA 603121) titled ‘Exploring the biological and socio-economic potential of new/emerging fish species for the expansion of the European aquaculture industry’. A part of the research was funded by Agencia Canaria de Investigación, Innovación y Sociedad de la Información (TESIS 2015010078), for a predoctoral grant for D. D. for PhD studies.
I. L. performed the experiment and several analyses, and contributed to writing the manuscript. N. E. was in charge of several analyses of enzymes and liver proteomics and contributed to writing the manuscript. M. S. I. and D. D. performed the analysis on gene expression and anomalies and helped in revising the manuscript. B. W. H. and P. K. were involved in the design of the study and in the analysis of lipids, and they critically reviewed the manuscript.
The authors declare that there are no conflicts of interest.


