


Optimal sleep, determined by duration, number of awakenings, consistency with circadian rhythms and presence/absence of clinical sleep disorders, is vital for optimal health and wellbeing(Reference Luyster, Strollo and Zee1). Lack of sleep has been highlighted as a public health concern, particularly as current estimates of sleep duration fall short of the recommended 7–9 h per night for adults(Reference Zhu, Catt and Cassidy2,Reference Sheehan, Frochen and Walsemann3) . Self-reported short sleep duration (< 7 h per night) has been associated with increased risks of obesity(Reference Cappuccio, Taggart and Kandala4,Reference Zhou, Zhang and Hu5) and associated cardiometabolic complications(Reference Cappuccio, Cooper and D’Elia6–Reference Chaput, Dutil and Featherstone10). Long sleep (≥ 9 h) is also associated with relatively poor health outcomes but represents a potentially complex subpopulation where there may be many important confounding factors(Reference Chaput, Dutil and Featherstone10).
As well as average sleep duration, marked variation in intra-individual sleep timing and sleep duration indicates suboptimal sleep habits and misalignment with circadian rhythms and is implicated in risk of poor health(Reference Patel, Hayes and Blackwell11,Reference Bei, Wiley and Trinder12) . The term ‘social jetlag’ has been coined(Reference Wittmann, Dinich and Merrow13) to capture a habitual pattern of short sleep during working days relative to longer, catch-up sleep, on free days (usually the weekend). Unlike international travel-related jetlag, social jetlag is a lifelong disrupter of optimal sleep habits and has been positively associated with increased BMI(Reference Roenneberg, Allebrandt and Merrow14) and markers of cardiometabolic disease risk(Reference Parsons, Moffitt and Gregory15).
Proposed mechanisms linking insufficient sleep or circadian disruption with weight gain and metabolic diseases include changes in energy expenditure, hormonal dysregulation and impaired insulin sensitivity(Reference Killick, Hoyos and Melehan16,Reference McHill and Wright17) , which may be amplified by modifiable behavioural risk factors(Reference Grandner, Seixas and Shetty18). As cardiometabolic conditions have strong nutritional determinants, links between poor sleep and metabolic disruption may be mediated through diet(Reference Dashti, Scheer and Jacques19). Intervention studies under laboratory-controlled conditions have shown that short-term partial sleep deprivation causes higher total energy intakes(Reference Al Khatib, Harding and Darzi20). Chronic exposure to short sleep duration has also been associated with higher energy intakes(Reference Grandner, Jackson and Gerstner21,Reference Dashti, Zuurbier and de Jonge22) , carbohydrate(Reference Martinez, Tschann and Butte23), sugar(Reference Kant and Graubard24) and alcohol intakes(Reference Galli, Piaggi and Mattingly25), as well as lower protein(Reference Kant and Graubard24), fibre(Reference Grandner, Jackson and Gerstner21) and fruit and vegetable intakes(Reference Gębski, Jezewska-Zychowicz and Guzek26), as well as a lower overall diet quality score and unhealthy eating habits(Reference Theorell-Haglöw, Lemming and Michaëlsson27–Reference Córdova, Barja and Brockmann29).
Evidence is emerging that dietary patterns and nutrient intakes are also less favourable in those who report social jetlag, including among young university students(Reference Zerón-Rugerio, Cambras and Izquierdo-Pulido30), adolescents(Reference Cetiner, Yildirim and Kalyoncu31) and a nationally representative UK adult population (cross-sectional analysis 2008–2011)(Reference Almoosawi, Palla and Walshe32), but it is not clear whether this just reflects chronic sleep deprivation, or whether there is an independent relationship with inconsistency in sleep duration (i.e. social jetlag). The aim of this research is to investigate associations and interactions between sleep duration and social jetlag status with nutrient intake, nutrient status, body composition and cardiometabolic risk factors in a nationally representative UK adult population (2008–2017). The hypothesis was that short sleep duration would be associated with a less healthy dietary profile (higher saturated fat, salt and sugar, lower fibre intakes) and increased adiposity and cardiometabolic risk factors. The second hypothesis was that there would be an interaction between sleep duration and social jetlag.
Methods
Study design and cohort
This was a cross-sectional study comparing food intake, nutrient status and cardiometabolic risk factors in short (< 7 h), adequate (≥ 7–< 9 h) and long sleepers (≥ 9 h) in the UK National Diet and Nutrition Survey Rolling Programme (NDNS-RP). The NDNS-RP survey consists of a repeated cross-sectional survey that is carried out every 1·5 years with the aim of assessing nutritional intake and status in a nationally representative UK population(33). The present study investigates the combined results from Years 1–9 of the NDNS (2008/2009–2016/2017) and includes adults aged 19–64 years who are not pregnant or lactating. Full details of the methodology have been previously reported elsewhere(34). In summary, a UK representative random sample of individuals was drawn from a list of all the addresses in the UK, the Postcode Address File. Interviewers administered 4-d food diaries, measured participants’ weight and height, and assisted participants in completing a computer-assisted personal interview (CAPI) to collect background and lifestyle information, including sleep duration.
Sleep assessment
Sleep duration questions targeted weekdays and weekends separately, phrased as follows: ‘Over the last seven days, that is since (date), how long did you usually sleep for on weeknights. That is Sunday to Thursday nights?’ and ‘Over the last seven days, how long did you usually sleep for on weekend nights. That is Friday and Saturday nights?’ Only the time participants were asleep was included. If participants were on a night shift during the previous 2 weeks, then the average time slept during the day was recorded. Shift work and napping habits were not recorded as part of the NDNS-RP. To estimate a 7-d average sleep duration, the following calculation was applied: ((5 × weeknight sleep duration) + (2 × weekend sleep duration)/7)).
Dietary assessment and analysis
Participants completed a 4-d estimated food diary with portion sizes were estimated using household measures and weights from labels. To aid accurate estimation, photographs of frequently consumed foods, life-size spoons and a life-size glass were included in the food diary(34). Nutrient intakes were calculated using Diet In Nutrients Out (DINO), a dietary assessment system developed at the Human Nutrition Research Centre at Cambridge University and linked to Public Health England’s NDNS Nutrition Databank(34). Dietary intake outcomes included total energy intake, as well as absolute (g/d) and relative intakes (percentage of total energy intake (%E)) of the macronutrients and alcohol intakes. Dietary fibre was included as defined by the Englyst(Reference Englyst, Quigley and Hudson35) method, known as non-starch polysaccharides (NSP). As a proxy measure of carbohydrate quality, the carbohydrate:NSP(Reference Lloyd-Jones, Hong and Labarthe36) ratio was calculated. Dietary misreporters were identified using McCrory’s method, using 2 sd (Reference McCrory, Hajduk and Roberts37).
Nutritional biomarkers
The 24-h urinary excretion of Na, K and N was analysed as objective biomarkers of dietary intake of salt, fruit and vegetables and protein, respectively(34). Circulating nutritional biomarkers included Hb, plasma ferritin, serum vitamin B12 and plasma vitamin C, which were measured from blood samples collected during the nurse visit which occurred within 2 to 4 months after dietary data collection.
Cardiometabolic risk factors
Body composition
Participants’ weight and height were measured using a portable weighing scale and stadiometer at the initial interviewer visit. Waist circumference (WC) was measured at the scheduled nurse’s visit upon completion of the 4-d food diary. All measurements were taken twice, and if there were wide variations across measurements (height ± 0·5 cm, weight ± 0·2 kg, WC ± 3 cm), a third was taken and the mean value of the two most similar measurements was reported(34).
Blood pressure
Participants were asked to refrain from eating, consuming alcohol or exercising vigorously for 30 min prior to their seated blood pressure measurement. Participants’ blood pressure was measured three times at 1-min intervals between readings using an automated blood pressure monitor (Omron HEM907)(34).
Blood measurements
The present study also evaluates cardiometabolic risk using fasting plasma glucose, glycated Hb (HbA1c), serum total cholesterol, HDL-cholesterol, LDL-cholesterol, serum TAG and serum C-reactive protein (CRP)(34).
Assessment of confounding variables
Demographics and lifestyle information were collected using the computer-assisted personal interview CAPI(34). This information incorporates age, sex, economic status, qualifications level, the number of children in the household up to 4 years of age, and frequency of alcohol intake and smoking. Information on having any long-standing illness including cancers, mental illness such as anxiety, as well as endocrine, nutritional or metabolic diseases was also collected.
Statistical analysis
The present study includes adults aged 19–64 years in the NDNS-RP with sleep duration data available. Sleep duration was divided into three categories to define short (< 7 h), adequate (≥ 7–< 9 h) and long (≥ 9 h) sleepers as per National Sleep Foundation recommendations(Reference Hirshkowitz, Whiton and Albert38).
Previous research using the NDNS data set estimated social jet lag as the difference in sleep duration hours between weekend and weeknights, since midpoint sleep data were not available(Reference Almoosawi, Palla and Walshe32). Participants in this study were categorised as having social jetlag if they reported > 2 h difference in sleep duration between weeknights and weekend nights, based on previous reports showing that this cut-off was associated with increased cardiometabolic risk factors(Reference Roenneberg, Allebrandt and Merrow14,Reference Almoosawi, Palla and Walshe32,Reference Rutters, Lemmens and Adam39,Reference Koopman, Rauh and van ‘t Riet40) .
All statistical analyses were performed using IBM SPSS Statistics 25.0 (Statistical Product and Service Solutions, IBM Corp.). Differences in participant characteristics were assessed using chi-square tests and ANOVA for categorical and scale data, respectively. Normal distributions of residuals were visually checked using histograms and Q-Q plots. Log transformation (ln) was conducted for non-normally distributed residuals. The analysis outcomes were back log-transformed into the geometric mean values. The assumption for homoscedasticity was examined by plotting the standardised residuals of dependent variables and predictors. In sensitivity analyses of outcomes of dietary intake, misreporters were excluded, and the analyses were repeated including only plausible reporters.
The associations between sleep duration or social jetlag category and dietary intake (absolute (g/d) and relative (%EI)), biomarkers of nutrient status, body composition and cardiometabolic risk factors were assessed using ANCOVA, with Bonferroni corrections for post hoc pairwise comparisons. The model was adjusted for age, sex, ethnicity, BMI (except for when assessing BMI and WC as an outcome), total energy intake (except for when assessing energy intake as an outcome), as well as lifestyle and socio-economic confounders including economic status, whether they currently had a long-standing illness, number of children below 4 years of age, smoking status and alcohol intake (except when assessing alcohol as an outcome). A two-sided P-value of < 0·05 was considered statistically significant. To account for multiple comparisons, we conducted false discovery rate calculation using the Benjamini and Hochberg method(Reference Benjamini and Hochberg41). Dietary intake categories (e.g. any marker of dietary carbohydrate quality) and/or cardiometabolic health variables that significantly differed by both sleep duration and social jetlag category were selected, and interactions between sleep duration and social jetlag status were included in the model to reveal independent associations.
Chi-square tests were also conducted to assess the association between food groups and social jetlag. For CRP analysis in investigating the difference between a group with and without social jetlag, multinominal logistics regression was used with adjustments for the same factors as above. CRP values were divided into two groups as follows: < 3 mg/l and ≥ 3–< 10 mg/l.
The NDNS-RP requires survey weighting to correct for differences in sample selection and response. The appropriate weights were used for differential selection probabilities of households and individuals, non-response to the individual questionnaires, non-response to the nurse visit and non-response to the blood sample and urine collection(34). Weight factor wti_Y19 (weight for individual and diary-all ages, combined Years 1–9 (the UK NDNS-RP 2008–2017)) was the weight factor used for examining differences in dietary intakes among short, adequate and long sleeper groups as well as between a group with and without social jetlag; wtn_Y19 (weight for nurse-all ages, combined Years 1–9 (the UK NDNS-RP 2008–2017)) was used for investigating differences in body composition variables (BMI and WC), blood pressure and urinary Na, K and N; and wtb_Y19 (weight for blood-all ages, combined Years 1–9 (the UK NDNS-RP 2008–2017)) was used for investigating differences in blood analyte variables including CRP, lipids, glucose and biomarkers of nutrient status (vitamin B12, vitamin C, HbA1C, Hb and serum ferritin).
Results
Participant characteristics
Sleep data were available for 5015 adults aged 19–64 years (96% of 5223 total) participating in the NDNS-RP 2008–2017. The characteristics of the cohort in the present study stratified by sleep duration are outlined in Table 1. Short sleepers comprised 34% of the cohort, with only 7% identified as long sleepers. The mean age of the cohort was 42·6 ± 12·4 years, and the mean BMI was 27·5 ± 5·5 kg/m2. The cohort was predominantly ‘White’, and 59 % were female. Two-thirds of the cohort were employed (69 %), and 28 % of participants had obtained a degree or equivalent. Approximately two-thirds (67 %) of respondents reported not having any chronic illness, and 82 % had no children between the ages of 0 and 4 years of age living in the household. Current smokers consisted of 26 % of the sample, and 38 % reporting consuming no alcohol. A quarter of respondents (26 %) consumed a dietary supplement.
Table 1 Background characteristics of a representative UK adult population (aged 19–64 years) according to sleep duration and social jetlag status based on NDNS 2008–2019 (n 5015)
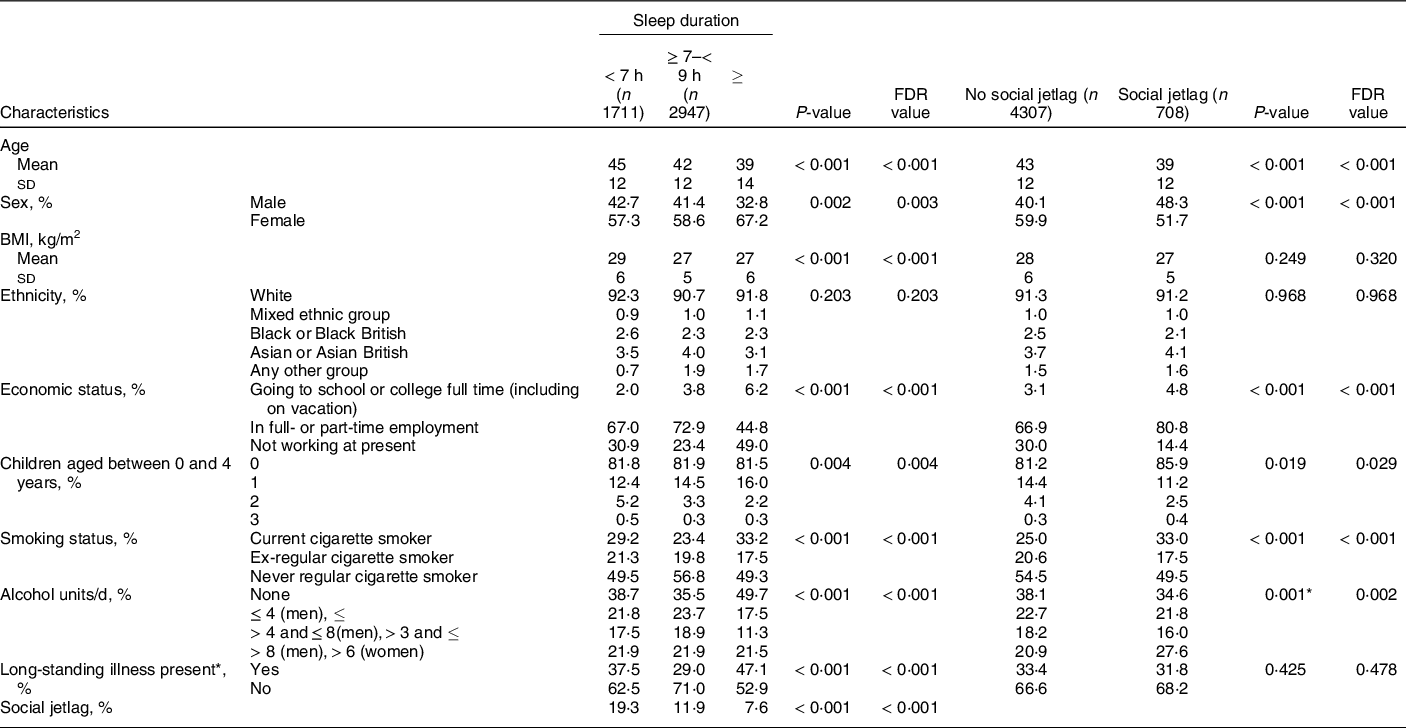
NDNS, Nutrition Survey Rolling Programme; FDR, false discovery rate.
Data are presented as mean ± sd for continuous variables or n (%) for categorical variables. Continuous data were tested by one-way ANOVA. P < 0·05 indicates a significant difference between groups. Multiple comparison-adjusted FDR P-values using the Benjamini–Hochberg false discovery rate are also provided. Categorical data were tested by chi-square test. P < 0·05 indicates a significant association between sleep group and the demographic variables.
* Any physical or mental health condition(s) or illness that have lasted, or expected to last, for 12 months or more.
In the unadjusted stratification of the population by sleep status (Table 1), short sleepers were significantly older and had higher BMI than those who slept ≥ 7 h. A greater proportion of long sleepers were female. There were no differences in the ethnic group distributions between sleep groups. More of the longer sleepers were either going to school or college full-time or not working at present, than the shorter and longer sleepers, with the adequate sleepers having the greatest proportion of people in employment. A greater number of short and long sleepers were either current or ex-smokers. Nearly, half of the long sleepers reported consuming no alcohol, with greater proportions of short and adequate sleepers consuming low or moderate amounts of alcohol. Nearly, half of the long sleepers reported having a long-standing illness, with the lowest proportion of those with long-standing illness being reported in adequate sleepers. Short sleep duration was significantly associated with social jetlag, with 19·3 % of short sleepers being categorised as having social jetlag, compared to only 11·9 % of adequate sleepers and 7·6 % of long sleepers (Table 1).
In the unadjusted stratification of the population by social jetlag status (Table 1), the social jetlag groups were significantly younger, had a greater proportion of men, and were more likely to be current smokers and drink more than 8 units per d (men) or 6 units per d (women) of alcohol than those who had regular sleep duration. BMI and ethnic group distributions did not differ between social jetlag groups. A greater proportion of the social jetlag group were in employment (80·8 %) compared to the no social jetlag group (66·9 %), and there was a slightly larger proportion of the social jetlag group that had no children between the ages of 0 and 4 years old. There were no differences between groups in their reporting of having a long-standing illness.
Dietary energy, macronutrient and micronutrient intakes
As presented in Table 2, in comparison with adequate sleepers (≥ 7–< 9 h), short sleep (< 7 h) was associated with lower absolute and relative intakes of protein and n-3 PUFA. There were no significant differences in intakes of saturated or trans fats in short sleepers in comparison with adequate sleepers. Short sleep was also associated with higher absolute and relative intake of carbohydrates, non-milk extrinsic sugars (NMES), and a higher carbohydrate:NSP ratio. In addition, short sleep was associated with lower intake of NSP fibre, folate, vitamin B12, vitamin C, K, Fe, and fruits and vegetables in comparison with adequate sleep. However, biomarkers of intake for vitamin B12, vitamin C, Fe (Hb and serum ferritin), and urinary Na (salt), K and N (protein) excretion were not significantly different between short sleepers and adequate sleepers (online supplementary material, Supplemental Table 1). In comparison with adequate sleepers (≥ 7–< 9 h), long sleepers (≥ 9 h) had no differences in dietary intakes (Table 2).
Table 2 Daily energy, macro- and micronutrient intake (estimated marginal mean (95 % CI)) of short, adequate and long sleepers*, in the UK adult population (aged 19–64 years) based on NDNS 2008–2019

NDNS, Nutrition Survey Rolling Programme; FDR, false discovery rate; NMES, non-milk extrinsic sugars; %EI, % energy intake; NSP, non-starch polysaccharides.
ANCOVA was used adjusted for age, sex, BMI, total energy intake (except for when assessing energy intake as the outcome), ethnicity, economic status, smoking status, alcohol intake (except when assessing alcohol as an outcome), number of children below 4 years of age and long-standing illness.
* Short, adequate and long sleepers n 1431, 2527 and 297, respectively.
† Residual data are non-normally distributed. The values presented from these variables are geometric (back log-transformed) means with 95 % CI.
‡ Two-sided P < 0·05 shows a significant difference.
§ Significant difference using multiple comparison-adjusted FDR P-values using the Benjamini–Hochberg false discovery rate.
Results of a sensitivity analysis in plausible dietary intake reporters only (85·2 % of the cohort, n 4274), as presented in Supplemental Table 2, show similar results to the analysis of the whole cohort, including significantly greater NMES intakes and a higher carbohydrate:NSP ratio in short sleepers compared with adequate sleepers. However, unlike the whole sample, both short and long sleepers reported lower energy intakes than adequate sleepers, and there were no differences in total carbohydrate intake (absolute or relative) in plausible reporters. In addition, there was no association between short sleep and K intake in plausible reporters.
Although short sleep was associated with higher NMES intake, the proportion of consumers of high sugar foods (‘sugar confectionery’, ‘sugars, preserves and sweet spreads’, ‘soft drinks, not low calorie’, ‘puddings’) was similar between the short sleep and adequate sleep groups (online supplementary material, Supplemental Table 3), or higher in the adequate sleep group (‘buns, cakes, pastries and fruit pies’, ‘chocolate confectionery’). However, a greater proportion of adequate sleepers consumed ‘brown, granary and wheatgerm bread’, ‘cheese’, ‘eggs and egg dishes’, ‘fruit’, ‘fruit juice’, ‘nuts and seeds’, ‘oily fish’, ‘other white fish, shellfish and fish dishes’, ‘salad and other raw vegetables’, ‘savoury sauces, pickles, gravies, and condiments’, ‘semi-skimmed milk’, ‘vegetables, not raw’ and ‘wine’ compared to short and long sleep groups.
As presented in Table 3, there were no significant differences in intakes of energy, protein, fat, total carbohydrate or alcohol between those with social jetlag compared with no social jetlag. However, social jetlag was associated with higher absolute NMES intakes and lower relative intakes of SFA, and absolute and relative intakes of trans fatty acids. There were no differences in NSP fibre or carbohydrate:NSP ratio, nor any differences in vitamin and mineral intakes, fruits and vegetables intake (Table 3), nor biomarkers of salt, K, protein, Fe, vitamin C and vitamin B12 intake (online supplementary material, Supplemental Table 4).
Table 3 Daily energy, macro- and micronutrient intake (estimated marginal mean (95 % CI)) of a group with and without social jetlag*, in the UK adult population (aged 19–64 years) based on NDNS 2008–2019
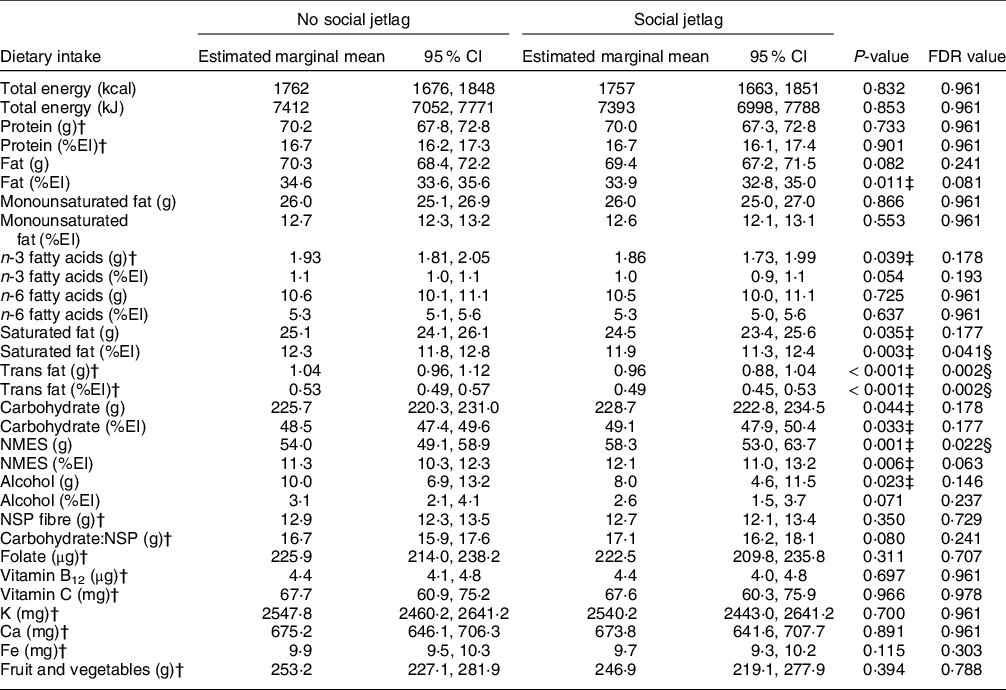
NDNS, Nutrition Survey Rolling Programme; FDR, false discovery rate; %EI, % energy intake; NMES, non-milk extrinsic sugars; NSP, non-starch polysaccharides.
ANCOVA was used adjusted for age, sex, BMI, total energy intake (except for when assessing energy intake as the outcome), ethnicity, economic status, smoking status, alcohol intake (except when assessing alcohol as an outcome), number of children below 4 years of age and long-standing illness.
* Without social jetlag n 3638; with social jetlag n 617.
† Residual data are non-normally distributed. The values presented from these variables are geometric (back log-transformed) means with 95 % CI.
‡ Two-sided P < 0·05 shows a significant difference.
§ Significant difference using multiple comparison-adjusted FDR P-values using the Benjamini–Hochberg false discovery rate.
A greater proportion of the social jetlag group reported consuming ‘chocolate confectionery’, ‘crisps and savoury snacks’ and ‘other meat and meat products’ (online supplementary material, Supplemental Table 5). A smaller proportion of the social jetlag group consumed ‘fruit’, ‘oily fish’, ‘other potatoes, potato salads, dishes’ (i.e. not including potato chips, fried roast potatoes and potato products’), and ‘tea, coffee and water’ compared to those not reporting social jetlag.
Short sleep was associated with a higher BMI and WC in comparison with the adequate sleep group (Table 4), but there were no differences between groups for blood pressure, fasting glucose concentrations, HbA1c, blood lipids or CRP. There were no differences in any of the cardiometabolic risk factors between the long sleep and adequate sleep groups. Body composition was not associated with social jetlag status, and there were no other differences in markers of cardiometabolic risk in the social jetlag group compared with the no social jetlag group.
Table 4 Cardiometabolic risk (estimated marginal mean (95 % CI)) in a representative UK adult population (aged 19–64 years)* according to sleep duration and social jetlag status based on NDNS 2008–2019
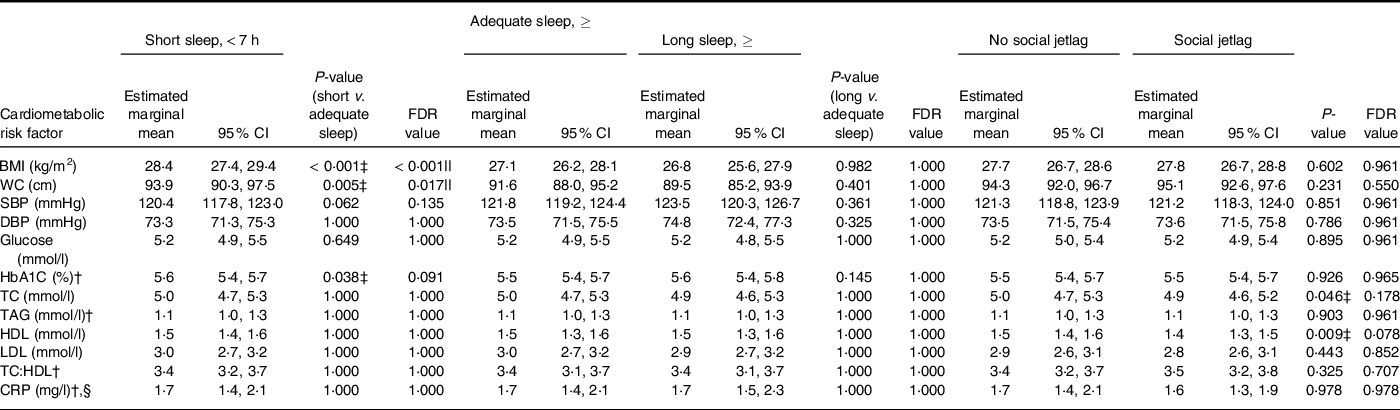
NDNS, Nutrition Survey Rolling Programme; FDR, false discovery rate; WC, waist circumference; SBP, systolic blood pressure; DBP, diastolic blood pressure; HbA1C, glycated Hb; TC, total cholesterol; CRP, C-reactive protein.
* BMI: short, adequate and long sleepers n 1082, 1930 and 215, respectively; without social jetlag n 2755; n with social jetlag n 472. WC: short, adequate, and long sleepers n 869, 1594 and 178, respectively; without social jetlag n 2824; with social jetlag n 484. SBP and DBP: short, adequate and long sleepers n 847, 1534 and 164, respectively; without social jetlag n 2181; with social jetlag n 364. ANCOVA was used adjusted for age, sex, BMI, ethnicity, economic status, smoking status, alcohol intake, number of children below 4 years of age and long-standing illness.
Glucose: short, adequate and long sleepers n 708, 1279 and 125, respectively; without social jetlag n 1821; with social jetlag n 291. HbA1C: short, adequate and long sleepers n 715, 1294 and 134, respectively; without social jetlag n 1835; with social jetlag n 308. TC, HDL and TC:HDL: short, adequate and long sleepers n 737, 1350 and 134, respectively; without social jetlag n 1908; with social jetlag n 313. TAG: short, adequate and long sleepers n 735, 1348 and 134, respectively; without social jetlag n 1905; with social jetlag n 312. LDL: short, adequate and long sleepers n 728, 1326 and 134, respectively; without social jetlag n 1882; with social jetlag n 306. CRP: short, adequate and long sleepers n 738, 1350 and 134, respectively; without social jetlag n 1909; with social jetlag n 313.
† Residual data are non-normally distributed. The values presented from these variables are geometric (back log-transformed) means with 95 % CI.
‡ Two-sided P < 0·05 shows a significant difference.
§ Multinominal logistics regression was used adjusted for age, sex, BMI, ethnicity, economic status, smoking status, alcohol intake, number of children below 4 years of age and long-standing illness. CRP values were divided into two groups: < 3 mg/l and ≥ 3–< 10 mg/l.
|| Significant difference using multiple comparison-adjusted FDR P-values using the Benjamini–Hochberg false discovery rate.
Sleep duration and social jetlag interactions
Since NMES (g) intakes were higher in the short sleep and social jetlag groups, and NSP intakes were lower in short sleepers only, interactions between sleep duration and social jetlag were investigated for indicators of carbohydrate quality. There was a significant sleep duration × social jetlag interaction for NSP intake (P = 0·022). Geometric means (95 % CI) for NSP fibre in adequate sleepers were significantly higher in those with no social jetlag (13·2 g/d (12·5, 13·8), n 2596) compared those with social jetlag (12·7 g/d (12·0, 13·5), n 351, P = 0·043), whereas fibre intake was lower overall in short sleepers compared with adequate sleepers with no social jetlag but did not differ within the short sleep group according to social jetlag category (no social jetlag 12·6 g/d (12·0, 13·2), n 1381; social jetlag 12·9 g/d (12·2, 13·6), n 330, P = 0·221). There were no significant interactions between sleep duration and social jetlag for total carbohydrate, NMES or carbohydrate:NSP ratio.
Discussion
This cross-sectional study examined whether both sleep duration and social jetlag were associated with dietary intakes and cardiometabolic risk factors in a representative sample of UK adults, and further investigated whether there were independent effects of social jetlag regardless of sleep duration. Consistent with previous evidence(Reference Jansen, Prather and Leung28,Reference Fatima, Bucks and Mamun42) , we report that approximately one-third of the UK adult population are not achieving recommended sleep durations, and 14 % were experiencing social jetlag, as defined by a difference in weeknight and weekend night sleep duration < 2 h. As expected, we found a higher prevalence of social jetlag in short sleepers in comparison with those achieving adequate sleep(Reference Almoosawi, Palla and Walshe32).
Nutrient intakes in short sleepers suggested a less healthy diet, characterised by higher intake of added sugars and lower intake of NSP fibre, n-3 fatty acids, protein, fruits and vegetables, and specific micronutrients, compared with adequate sleepers. A previous analysis of the NDNS-RP years 1–4 reporting on linear associations of dietary intake and sleep duration without adjustment for total energy intake found no significant associations between sleep and nutrient intakes(Reference Potter, Cade and Hardie43), which might be explained by the relationship between sleep and diet being non-linear(Reference Dashti, Scheer and Jacques19). Whilst habitual sleep deficiency may promote hedonic cravings for sweet, energy-dense foods resulting in poorer health outcomes, populations with average sleep durations > 9 h might sleep longer because of long-standing health conditions, thus confounding associations with diet.
Short sleep was associated with higher carbohydrate intakes and poorer quality carbohydrate intake, evidenced by higher absolute and relative intake of NMES and a higher carbohydrate:NSP ratio, which may lead to greater risk of weight gain. Indeed, short sleep was associated with higher adiposity measures, in agreement with a meta-analysis of twelve prospective cohort studies that followed up from 1 to 12 years showing that short sleep duration was associated with greater risk of obesity(Reference Bacaro, Ballesio and Cerolini44). Short sleepers may be less physically active(Reference Bromley, Booth and Kilkus45) leading to a net positive energy balance. However, it could have also been mediated by higher consumption of energy-dense, fibre-poor foods. Sleep-deprived subjects had alterations in neuronal responses in areas of the brain linked to reward, which would be expected to result in a heightened preference for energy-dense, palatable foods(Reference St-Onge, Wolfe and Sy46,Reference Rihm, Menz and Schultz47) , alongside increased ghrelin secretion(Reference Rihm, Menz and Schultz47,Reference Lin, Jiang and Wang48) . Therefore, extending sleep duration could reduce cravings for energy-dense, low-fibre foods, and in fact we observed a decreased intake in free sugars following a sleep extension intervention in short sleepers(Reference Al Khatib, Hall and Creedon49). Alongside previous observational evidence(Reference Grandner, Jackson and Gerstner21,Reference Martinez, Tschann and Butte23,Reference Kant and Graubard24) , it appears likely that higher dietary sugars and low dietary fibre are the key aspects of diet quality that may predispose to weight gain when sleep duration is habitually inadequate.
Social jetlag was also associated with higher sugar intakes. However, the social jetlag group differed from short sleepers in that they also had lower relative mean intakes of saturated and trans fatty acids and had none of the other significant differences in dietary intake nor cardiometabolic risk factors. A significant interaction between sleep duration and social jetlag revealed that NSP fibre intake was not modified by social jetlag status in short sleepers, but that intakes were lower in adequate sleepers with social jetlag than those without social jetlag. This suggests that both short sleep and sleep inconsistency between week and weekend nights may influence dietary carbohydrate quality independently, although it is also possible that reverse causation was at work and lower fibre intakes might somehow reduce sleep duration.
There are some limitations in this cross-sectional study. Temporal trends cannot be ascertained and no causal inferences or directions of effect can be drawn. Measures of sleep duration and dietary intake rely on self-report, which may be inaccurate. The difference in sleep duration between weeknights and weekend nights was used as a proxy measure for social jet lag, a method applied in observational studies when sleep-onset and wake-up data are not available to calculate difference in sleep midpoint between ‘work nights’ and ‘free nights’(Reference Almoosawi, Palla and Walshe32). Social jetlag was calculated from the self-reported difference in sleep durations between the typical working weeknights and weekend nights, but not all participants would have worked Monday to Friday with weekends off(Reference Wittmann, Dinich and Merrow13). No information was available on shift work status and duration or hours of work; these may implicate circadian disruption via different mechanisms. In individuals not currently in employment, retirement status was not considered, nor menopausal status in women. Finally, later time of eating and a longer eating window have been associated with increased cardiometabolic risk and may impact on sleep duration(Reference Dashti, Gómez-Abellán and Qian50). The present study did not investigate these additional dietary variables but should be a consideration for future research.
Conclusion
In conclusion, the present study reports that short sleep and social jetlag are associated with higher intake of sugar in a representative UK population sample. Furthermore, the association between short sleep and low fibre intake is extended to those with social jetlag even if they have adequate average weekly sleep duration, suggesting that catch-up sleep does not mitigate the effects of irregular sleep durations on diet quality. This study corroborates previous findings that short sleepers exhibit higher markers of adiposity but found no independent effects of social jetlag on body composition in the adjusted analysis. Combined with increasingly sedentary behaviours of the modern lifestyles, poor dietary carbohydrate quality in short sleepers and those with social jetlag may increase the risk of weight gain and cardiometabolic diseases over time. Prospective cohort studies utilising nutritional biomarkers of carbohydrate quality and objective measures of sleep are needed to address the potential lifelong impact of modest circadian misalignments associated with modern working lifestyles, which affect a large proportion of the global population.
Acknowledgements
Acknowledgements:
This paper uses data from the National Diet and Nutrition Survey (NDNS) Rolling Programme. The NDNS is supported by Public Health England and the UK Food Standards Agency.
Financial support:
This research received no specific grant from any funding agency, commercial or not-for-profit sectors.
Conflict of interest:
H.A.K. has been an employee of Zoe Global Ltd. All other authors have none to declare.
Authorship:
The authors’ contributions were as follows: W.L.H. and H.A.K. conceived the idea for the research; V.D., W.L.H., H.A.K. and R.G. designed the research; V.D. and K.M.B. analysed the data; H.A.K. advised on analysis of the data; H.A.K. and V.D. wrote the initial draft manuscript; R.G. and W.L.H. conducted critical revisions and editing; all authors read, commented and approved the final manuscript; W.L.H. had primary responsibility for final content.
Ethics of human subject participation:
This study was conducted according to the guidelines laid down in the Declaration of Helsinki, and all procedures involving research study participants were approved by the National Health Service Local Research Ethics Committee covering each of the postal sectors. Written informed consent was obtained from all participants.
Supplementary material
For supplementary material/s referred to in this article, please visit https://doi.org/10.1017/S1368980022000167


 Open access