


Much research over the past decades has been devoted to long-run economic inequality. In the most recent years, this research has been integrated with a focus on the distribution of income between capital and labor: the classical “functional income distribution.” There are quite different predictions in the current literature as to the connection between functional income distribution and inequality in the personal income distribution. For Thomas Piketty (Reference Piketty2014), the connection appears clear: capital income is more unequally distributed than labor income, so a transfer from labor income to capital income will increase inequality. Discussing Piketty’s work, Peter Lindert (Reference Lindert2015) takes stock with this argument, arguing that in fact functional income distribution is an antiquated measure, related to the research of nineteenth century political economists and the production function research of the 1950s, but irrelevant for understanding inequality.Footnote 1 Branko Milanovic (Reference Milanovic2017), on the other hand, argues that if capital ownership is equally distributed then egalitarians do not have to worry about increasing capital shares.
What is striking about much of this discussion is that it pays little attention to the possibility that the link between factor shares and inequality is not stable, but instead dependent on factors that can change over time.Footnote 2 The theoretical models linking factor shares and income inequality show that the link is contingent on the production technology, the structure of personal incomes or the institutional context, all of which may—and do indeed—change over time.Footnote 3
The importance of time for understanding the link between factor shares and inequality is also emphasized by recent empirical research documenting how the balance between labor and capital varies across historical eras. At the aggregate level, capital-income ratios fluctuate grossly over time, and many Western countries today experience levels not witnessed in over a century (Piketty and Zucman Reference Piketty and Zucman2014, Reference Piketty and Zucman2015; Piketty Reference Piketty2014; Waldenström Reference Waldenström2017). At the micro level, studies of trends in the income distribution show that capital income became less important as an income source over the twentieth century, but is now becoming more important again in several countries, possibly contributing to the observed current secular increase in inequality (Atkinson and Piketty Reference Atkinson and Piketty2007, Reference Atkinson and Piketty2010; Roine and Waldenström Reference Roine and Waldenström2015).
In this article, we make two main contributions to the literature. First, we present a new database on historical wage and capital shares for 21 countries going back to at least the 1930s and in several cases the middle of the nineteenth century. These series are compiled and homogenized from previous studies, for example, Piketty’s (Reference Piketty2014) presentation of long-run data for France, Britain, Germany, and the United States, but also from different countries’ official historical national accounts.Footnote 4 We thereby extend the time span by several decades in comparison with existing cross-national datasets that cover the period since the 1960s or 1970s.Footnote 5
Our second contribution is to analyze empirically the relationship between factor shares and income inequality by matching our new capital shares database with previously available long-run series of top income shares in the World Wealth and Income Database (WID). The specific focus on the long-run association between capital shares and inequality appears to be a specific contribution because, as we have noted, there is disagreement on what this relationship should be: positive, nil, or dependent on context. In addition to estimating the long-run associations, our historical panel of countries also allows us to quantitatively assess whether the link has changed over time and if it differs between institutionally different groups of countries such as Anglo-Saxon, Continental European, and Nordic countries. Furthermore, using evidence on the capital and wage income components in the top income data, we investigate if the alleged link depends on the structure of personal incomes in the income elite; that is, if the link grows stronger when we focus exclusively on the capital returns reaped by the top income earners. Finally, we ask if the link varies with different measures of inequality, both by examining the impact across different groups within the top income decile and when replacing top shares altogether by Gini coefficients that are available for a smaller group of countries.
Our study contributes to several literatures. One is the empirical literature on the link between factor shares and income inequality, which, due to the lack of historical evidence, has been primarily focused on shorter-run correlations in either single countries or at the cross-country level. For example, Paul Ryan (Reference Ryan1996) studies postwar Britain and Martin Adler and Kai D. Schmid (Reference Adler and Schmid2013) study Germany in the 2000s, both finding a positive link between aggregate capital shares and the dispersion of household incomes. Looking across countries, Emilie Daudey and Cecilia García-Peñalosa (Reference Daudey and García-Peñalosa2007) and Daniele Checchi and García-Peñalosa (Reference Checchi2010) examine OECD countries between the 1970s and 1990s and find a robust positive relationship between capital shares and income inequality and attribute some of this to institutional differences in the labor market. Additionally, in micro-based analyses of cross-country data from the late twentieth century, a link has been found between the importance of capital income and overall inequality by, among others, Anna Fräßdorf, Markus M. Grabka, and Johannes Schwarze (Reference Fräßdorf, Grabka and Schwarze2011), Eva Schenkler and Kai Schmid (Reference Schlenker and Schmid2013), and García-Peñalosa and Elsa Orgiazzi (Reference García-Peñalosa and Orgiazzi2013).
Our study also relates to the rather large research in economics and related subjects devoted to understanding the determinants of changes in factor shares; see the seminal contribution by Olivier Blanchard (Reference Blanchard1997) and subsequent analyses of Andrea Bassanini and Thomas Manfredi (Reference Bassanini and Manfredi2012), and Loukas Karabarbounis and Brent Neiman (Reference Karabarbounis and Neiman2014a). Furthermore, we connect to the literature on long-run income inequality trends where much focus has been on the broader association between distribution and economic development and the role of institutional and structural changes. This literature has grown substantially in recent years largely due to the availability of new data on top incomes (for overviews, see Atkinson and Piketty Reference Atkinson and Piketty2007, Reference Atkinson and Piketty2010; Roine and Waldenström Reference Roine and Waldenström2015). Finally, our investigation has direct relevance for the investigation of capital-income ratios and their distributional consequences in the income and wealth distributions. Factor shares represent one of the possible channels through which this process works, and we hope that our new database can spur further efforts to investigate this subject.
Analytical Framework
The capital share is defined as the share of national income distributed as capital income: interest, profits, dividends, and realized capital gains. Together with the wage share—the share going to employees in national income—this adds up to national income, if the incomes of the self-employed are allocated between capital share and wage share (see later).
An accounting-based association between the functional and personal income distributions has been analyzed many times. The results typically depend on the model choice or institutional context and it is fair to say that consensus over the shape of this link—and if it exists at all—has not been reached, as noted earlier the United States (see Piketty Reference Piketty2014; Lindert Reference Lindert2015; Milanovic Reference Milanovic2017). Anthony B. Atkinson and François Bourguignon (Reference Atkinson and Bourguignon2000) and Atkinson (Reference Atkinson2009) approached the issue by using a standard two-factor production function, where total income is made up of either labor income or capital income, and capital’s share of value added is α with wage share being 1 – α.Footnote 6 Expressing income inequality in terms of the coefficient of variation, Vy, it is possible to decompose it into the equivalent inequalities of wages Vw and capital income Vk, the factor shares and the correlation between capital and labor income ρ (recognizing that some income earners earn income from both labor and capital) as follows: $V_y^2 = \left( {1 - \alpha } \right)V_w^2 + \alpha V_k^2 + 2\left( {1 - \alpha } \right)\alpha \rho {V_w}{V_k}.$
In equation (1), it is obvious that there is a link between the capital share α and income inequality, but it is also clear that it is not linear. When, in fact, does a rising capital share spur inequality to rise? Atkinson (Reference Atkinson2009) discusses this question and shows that if one defines λ as the relationship between wage income dispersion and capital income dispersion, that is, λ = Vk/Vw, then a rise in the capital share will raise total income inequality when α > (1 – λρ)/(1 + λ 2 – 2λρ). Assuming that capital income is twice as dispersed as labor income, a rising capital share will increase inequality if the capital share is at least one half. In a pure class society with only workers and capitalists, perhaps close to what many Western countries experienced in the nineteenth century, the correlation may look different depending on how we think about income patterns. With a perfect trade-off between wages and capital income, then the correlation is perfectly negative (ρ = –1) and inequality increases with a rising capital share if α > 1/(1 + λ). But if labor earnings and capital earnings would be uncorrelated (ρ = 0), then inequality increases when the rising capital share rises if α > 1/(1 + λ 2), which is one fifth if capital income is twice as dispersed as wage income. In addition, if the correlation is positive, an even lower capital share is required to make inequality rise under an increasing capital share. The main message is that for plausible levels of the capital share and characterizations of personal incomes, one can expect the capital share and income inequality to be positively correlated.
The relative importance of capital and wage income dispersion for the relationship is also indicated by equation (1), with the main message being that capital income dispersion matters more. To see this most clearly, consider the extreme cases when either capital incomes or wage incomes are not dispersed at all. When wage income dispersion is zero and capital income dispersion positive, a rise in the capital share will increase overall income inequality but when capital income dispersion is zero the same rise will lower overall inequality.
Other models of the link between the capital share and inequality add realism, but typically also complexity to the picture. For example, some models emphasize that workers are heterogeneous, particularly in terms of skill, and this can have implications for how increasing capital intensity affects inequality. Atkinson (Reference Atkinson2009) and Atkinson and Bourguignon (Reference Atkinson and Bourguignon2015) discuss such models. In some of these models, productive capital is a true substitute for unskilled labor and a complement to skilled laborers, for example, in the case where robots and computers crowd out low-skilled workers but make the high-skilled more productive. Although the ultimate distributional pass-through depends on many things, including factor flows, people’s income composition and various institutional constraints (e.g., wage-setting institutions), it would not be extreme to expect that increasing capital shares should eventually imply rising inequality of personal incomes.
Our empirical assessment of the link between capital shares and top income shares is based on panel regressions where we assume a log-linear relationship between the two variables of interest. Such simplistic approach will not capture the full accounting logic of the relationship explained earlier, but it still offers a flexible and transparent way to describe some of its central aspects. We estimate the following regression equation: $\ln {\rm{ }}IncomeIne{q_{it}} = {\beta _0} + {\beta _1}{\rm{ ln }}CapitalShar{e_{it}} + {\varepsilon _{it}},$
where IncomeIneqit denotes income inequality, measured here as top income shares or Gini coefficients, in country i and time period t (either yearly or 5-year average), CapitalShareit is the capital share (i.e., α in equation (1)) in value added and epsilon; it is a random error term. The parameter of interest,  ${\hat \beta _1}$, is the elasticity of income inequality with respect to the capital share, which means that it can interpreted as the percentage increase in inequality associated with a 1-percent increase in the capital share.Footnote 7
In addition to the baseline equation (2), we also amend the projected relationship between the capital share and top income shares by accounting for the influence of other factors, some fixed and specific at the country level and others varying over time: $\ln IncomeIne{q_{it}} = {\beta _0} + {\beta _1}{\rm{ln}}CapitalShar{e_{it}} + {X_{it}}\delta + {\mu _i} + t + {\varepsilon _{it}}.$
In equation (3), we add Xit as a matrix of control variables, μi being country fixed effects that account for time-invariant and unobserved influences and t being a linear time trend common to all countries. The reason that our baseline estimations do not include any of the confounders in X is that we are primarily interested in the correlation between capital shares and income inequality. Including the additional controls shows the relationship when it is contingent on factors that determine either or both of the distributional outcomes in focus. GDP per capita accounts for the overall level of development, whereas the employment share of agriculture reflects how far countries have come in the structural change and industrial transition. Stock market capitalization as share of GDP is a measure of the importance of private capital in the economy. Central government spending, is intended to capture the factors related to the growth of the public sector, which includes institutional development as well as political processes such as redistribution.
We use five-year averages rather than yearly observations because the latter tends to be quite noisy which may affect the estimations of the relationships of interest. In the Online Appendix we present all of the results using annual observations, and generally there is little difference between the two cases. Including fixed country-effects is potentially important because most of the time series are consistent within countries, whereas the comparability across countries is lower. This also implies that the estimated relationship changes to be identified on within-country variation since the fixed effects demean the series.
Data
We introduce a new historical database on similarly calculated capital shares covering 21 countries, thus adding 17 to the four presented in the Piketty and Gabriel Zucman (Reference Piketty2014) dataset. To the data for Britain, the United States, France, and Germany for which Piketty and Zucman present long-run series, we add, based on historical national accounts, capital shares for Denmark and Sweden since the mid-nineteenth century, Finland, Mexico, and Spain since 1900, Japan since 1906, Norway since 1910, Australia and Italy since 1911, Argentina and Austria since 1913, Belgium, Brazil, Canada, and the Netherlands since the 1920s, Ireland since 1938, and New Zealand since 1939. Because we lack top income data for Austria, Belgium, Brazil, Italy (before 1974), and Mexico, these countries are not part of the present study. The full database will be an important resource for further research on factor shares and historical macroeconomics.
There are several measurement issues when estimating factor shares (for a thorough discussion of these and discussion of the sources, see the Online Appendix). The capital share series are calculated using historical national accounts from the income side, including estimates for the income sums of employees and self-employed as well as various forms of capital incomes (corporate profits, rent, interest, dividends). Given the geographical and chronological scope of the database, there exist differences in these data series, two being particularly important. The first concerns how to account for the incomes of the self-employed, a group whose incomes can be considered both as wages and as capital income. Since the share of self-employed among the economically active varies over time (not the least when agriculture’s share of the economy shrinks), calculating factor shares without considering the self-employed can give a quite misleading picture of the factor share developments (see further Kravis Reference Kravis1959; Elsby, Hobijn, and Şahin Reference Elsby, Hobijn and Şahin2013). Factor share estimates must, therefore, be adjusted for incomes of the self-employed by allocating some of it to the labor income sum and the rest to the capital income sum. Typically, the adjustment is made by allowing one third of the self-employed incomes as capital income and the rest as income of their own labor.
The second measurement issue is whether to use estimates of capital shares gross or net of capital depreciation, that is, if capital income should be related to gross value added or the value added net of costs accruing to the consumption of fixed assets. This question has been discussed by several authors, for example, Andrew Glyn (Reference Glyn2009), Benjamin Bridgman (Reference Bridgman2014), Piketty (Reference Piketty2014), and Karabarbounis and Neiman (Reference Karabarbounis and Neiman2014b). A majority argues that the net capital share is a more appropriate measure if one wishes to study income flows reaching the final users, that is, capital-owning households; Glyn (2008, p. 108) calls the net measure the appropriate measure if one wants to understand “who gets what.” However, the estimation of net capital shares requires the estimation of capital depreciation rates, which adds measurement uncertainty to the series. Capital depreciation can vary because of taxation incentives and the like; moreover, during turbulent episodes, capital depreciation can be highly volatile. For these reasons, a key advantage of our dataset is that for all countries but three (Argentina, Brazil, and Mexico) we can present both gross and net measures. This means that we can run all analyses with gross and net capital shares to ascertain that this measurement issue does not change the results.
We merge the historical capital share data with data on income inequality for 16 countries. Evidence on the historical evolution of the personal income distribution is generally scarce for most countries. We use one of the few consistent sources available, namely the recent World Top Incomes Database containing historical top income shares spanning most of the twentieth century for almost two dozen now industrialized countries (Atkinson and Piketty Reference Atkinson and Piketty2007, Reference Atkinson and Piketty2010). A major advantage of using top income shares is that they are based on a similar source material, annual tax returns, and on methods that are specifically aimed at creating long-run comparability of the data series for each country. While the series are primarily consistent within countries, the cross-country comparability is more problematic. However, because we are primarily interested in within-country trends and include country fixed effects in our empirical analyses, we do not think that this problem poses serious problems to us.
A particular problem with these inequality data is that they exclude some of the incomes that are included in the national accounts series from which the capital share is calculated. In particular, companies’ retained earnings do not show up on personal tax returns, and neither do reinvested dividends show up in mutual funds. This means that capital income is underestimated at the individual level. Furthermore, taxable labor earnings are incomplete in the income tax records because they typically do not include social security contributions. It is difficult to determine the impact of this measurement problem, but most likely the problem has grown worse over time. At this point, we lack a full set of macro-consistent distributional income statistics, not least over the long run, but in the analysis later we examine how the results change for two countries, France and the United States, for which we have access to newly compiled historical series over distributional national accounts.
In a few countries (e.g., Canada, France, Sweden, the United States), the top income data contain information about the composition of incomes. Specifically, wages and salaries, rental income and dividends, and self-employment income are reported for different groups at the top of the income distribution. Self-employment income is for the most part included in labor earnings, but there are some deviations between countries in this regard. To the extent that these country-differences are constant over time, they do not affect our findings because they will be accounted for by our country fixed effects.
Measurement of income inequality typically concerns population-wide measures and not top income shares. In fact, top income shares, strictly speaking, do not meet all requirements that an inequality measure should meet; most importantly, Pigou-Dalton transfers from richer to poorer persons always lead to inequality reductions.Footnote 8 Jesper Roine and Daniel Waldenström (Reference Roine and Waldenström2015) discuss this issue and refer to evidence on a fairly large empirical congruence between top income shares and broader measures of income inequality. To address the issue, we have collected data on Gini coefficients available for some countries in Atkinson and Morelli’s (Reference Atkinson2013) “Chartbook of economic inequality.” Unfortunately, these historical Gini coefficients are worse in terms of country-time coverage and their comparability is therefore much lower than in the case of the top income shares. We combine different Gini coefficients from different datasets to create series that are as long as possible, but the final series are uncertain and should be interpreted with some degree of caution.
Finally, in some of the analyses we include other variables, aimed at accounting for relevant macroeconomic influences: GDP per capita, the employment share in agriculture, stock market capitalization as share of GDP, and government spending (central government spending as share of GDP). The sources for these variables are Roine, Jonas Vlachos, and Waldenström (Reference Roine, Vlachos and Waldenström2009) and Roine and Waldenström (Reference Roine and Waldenström2015) and the references therein.
Main Results
Here we present the main analysis of links between the functional and personal income distributions. We present evidence on the overall association, differentiating between different top groups, the role of top capital versus wage incomes and different measures of inequality.
Correlation Evidence
We begin by depicting the long-run evolution of the net capital share and top percentile income shares in the 16 countries for which we have both data series. The patterns are not uniform across countries; there are substantial differences in levels, trends, and in the degree of variability of the series. The net capital share lies mostly between 20 and 30 percent of value added, but one-fifth of values are either below 15 percent or above 40 percent, documenting the large variation. The top 1 percent income share also varies over time, and in most countries there is a clear co-variation (especially Denmark, Sweden, and Japan), but in a few cases this relationship is not at all so strong.
In order to get a more systematic sense of the association between capital shares and top income shares, Table 1 shows Pearson correlation coefficients by country for the entire time period as well as three sub-periods: pre–1945, 1950–1980, and post–1980. The main message is that the functional and personal income distributions are positively correlated. In 14 of the 16 countries, the correlation over the full period is 0.50 or higher and highly statistically significant. Two major outliers are Argentina, which has a negative correlation at –0.38, and Canada where the correlation is roughly zero. Inspecting these two countries more closely does not reveal any obvious explanations. In Argentina, the negative correlation appears to be mainly driven by postwar observations, whereas the opposite is true for Canada, where the correlation is actually robustly positive in the post–1980 period.
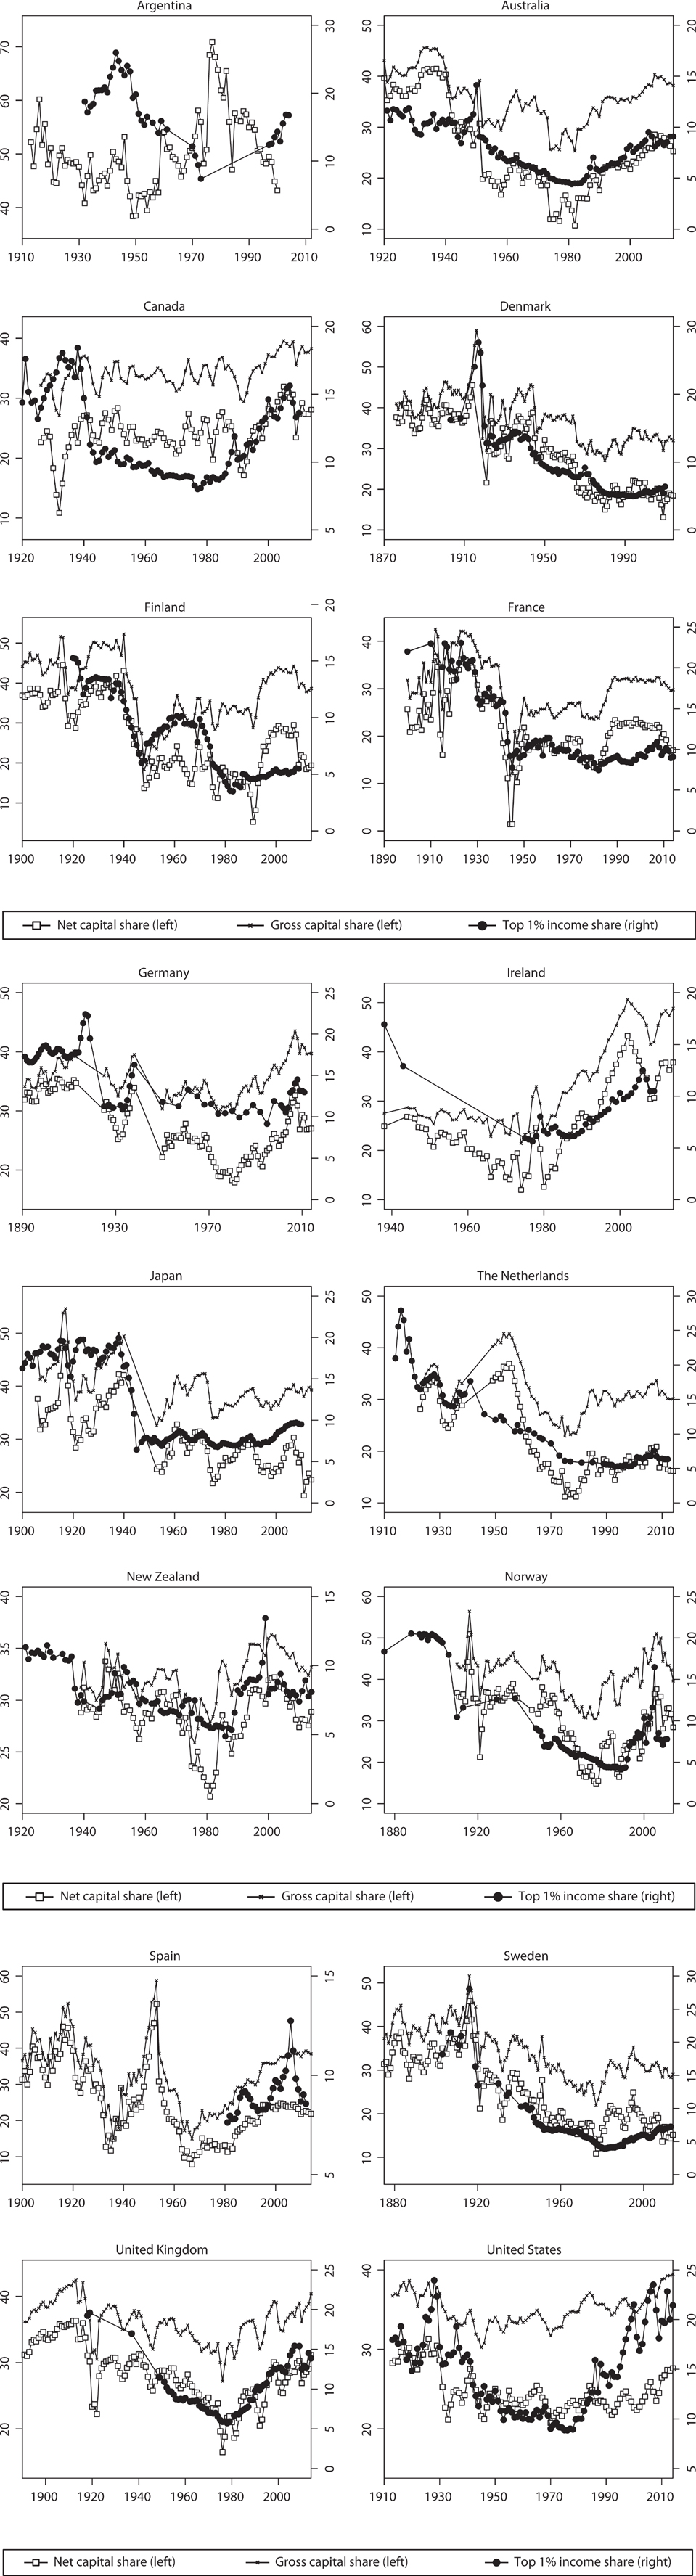
Figure 1 The Capital Share and Top 1 Percent Income Shares in 16 Countries
Table 1 Correlation of Top Incomes and Capital Shares by Country
* = Significant at the 10 percent level.
** = Significant at the 5 percent level.
*** = Significant at the 1 percent level.
Note: Pearson correlations for cases with at least ten observations “Pre-WWII” denotes years before 1939, “Postwar-1979” years 1950–1979, and “1980–present” years since 1980. Number of observations in brackets.
Source: Authors’ calculations.
Panel Regressions: Baseline Results
The next step is to run panel regressions when examining the association between capital shares and top income shares. Regressions give more structure and allow us to hold country-specific influences constant, add constants or common time trends. Table 2 shows the baseline results from panel regressions of equation (2) using annual and five-year averaged observations and separating results for net and gross capital shares.
Table 2 Capital Shares and Top Income Shares: Basic Relationship
* = Significant at the 10 percent level.
** = Significant at the 5 percent level.
*** = Significant at the 1 percent level.
Note: Panel regression of logged top 1 percent income shares on logged capital shares, a constant and a random error (equation (1)). Observations in brackets. Number of included countries: All countries (16), Anglo-Saxon (6), Continental European (4), and Nordic (4). Robust standard errors in parentheses.
Source: Authors’ calculations.
Beginning with the net capital share results (panel a), over the whole country sample there is a positive and statistically significant coefficient between the logged top percentile income shares and logged net capital shares, at 0.76 and 1.01 in the annual and averaged samples, respectively. These coefficients in the log-log model can be interpreted as elasticities, thus suggesting that a 10 percent rise in the net capital share is associated with between 7 and 10 percent increases in the top percentile income share. The coefficients are lower in the sub-periods when we permit average effects to vary, around 0.4 in the pre-WWII era and higher at around 0.5–0.6 in the two postwar eras. In other words, over the century-long perspective, there is a quite robust, almost one-to-one, relationship between the net capital share of value added and the income share earned by the highest-earning percentile.
The table also shows the conditional correlations for three country groups: Anglo-Saxon (Australia, Canada, Ireland, New Zealand, United Kingdom, United States), Continental European (France, Germany, the Netherlands), and the Nordic countries (Denmark, Finland, Norway, Sweden). Long-run coefficients are relatively similar across country groups, being positive and significant between 0.5 and 1.0, that is, in the same neighborhood as the full-sample coefficients. Looking at the sub-periods, the groups appear to differ in their trends, but standard errors are too large for any strong conclusions to be drawn. Continental European and Nordic countries exhibit fairly large and positive correlations in all sub-periods, with a tendency for falling coefficients over time where the lowest estimates are recorded in the post–1980 era. By contrast, Anglo-Saxon countries exhibit an increasing trend with the smallest coefficient recorded in the period before the WWII and largest in the recent era.
Using gross capital shares (panel b) generate largely similar patterns but with larger estimated coefficients. In the full-country sample, the long-term coefficients are above unity, between 1.25 in the annual data and 1.50 in the five-year averaged data. These high elasticities underscore the strong link between the functional and personal income distributions found for the net capital share. The sub-period estimates are also higher. The largest difference is found in the post–1980 era when the gross capital share coefficient in the averaged sample is 1.19 compared to the 0.61 for the net capital share. This is the one case when the difference is statistically significant.Footnote 9 Looking at country groups, we find the same pattern with a stronger association between gross capital shares and top income, but there are few cases where the difference is statistically significant. The main reason for the somewhat higher coefficients found when using the gross capital share is most likely related with the effect of capital depreciation, which makes the net capital share more variable. Overall, the main result from this analysis is that while gross and net capital shares differ in levels, their co-movements imply that their association with top income shares are similar.
Heterogeneity across Top Income Groups
A recurrent finding in the recent top income literature is that top income earners are always similar to each other, as was often believed in the older inequality literature. Instead, there is typically quite large differences in the level of income, the time trends of income shares, and in the composition of income across sources of different earners within the top decile group, and even within the top percentile group. For this reason, we rerun the panel regression analysis replacing the logged top 1 percent income share with the log of the top 10–1 percent income share (i.e., income earners between the 90th and 99th income percentiles), the top 1–0.1 percentile share (i.e., earners between the 99th and 99.9th income percentiles), and the top 0.1 percentile.
In Table 3, we present the results from this analysis. They confirm that the heterogeneity within the income top carries over to the relationship between the capital share and top income shares. The long-term association over the entire twentieth century was 1.01 for the top percentile. For the Top 10–1 it is 0.14, for the Top 1–0.1 it is 0.81, and for the Top 0.1 it is 1.57, all coefficient estimates being significantly different from zero. Across the sub-periods, the pattern is the same, with the top percentile coefficients indicating a stronger relationship than for the lower part of the top decile and even of the top 0.1 percentile, but that the relationship is the strongest in the top 0.1 percentile group.
Table 3 Intermediate Top Income Groups
Note: Panel regressions with logged inequality outcomes on logged capital shares. See Table 2 and the main text for details.
Source: Authors’ calculations.
The table also shows the regression coefficients for different country-groups over the entire century as well as over the sub-periods. Once again, the pattern from the top percentile analysis carries over to the rest of the top groups, but much weaker so for the groups lower down in the top and much stronger in the absolute top. The association is the strongest in Anglo-Saxon countries, especially in the recent era, whereas it is the weakest in the Nordic countries.
Mechanism Analysis
The analysis so far has been concerned with assessing long-term associations between the capital share and top shares of total incomes earned. Little has been said about the mechanisms behind this association. The accounting identity discussed earlier, and, in particular, equation (1), offers hints about these channels. The importance of household capital incomes is potentially large and the institutional context determining the ways in which individual incomes are formed and distributed could also matter. Here, we examine some of the most important mechanisms.
Do Capital Incomes in the Top Explain the Link with the Capital Share?
The composition of top incomes has attracted much attention in the previous inequality literature. A main finding in Piketty (2001) and Piketty and Emmanuel Saez (Reference Piketty2003), and extended to other countries and discussed further in Roine and Waldenström (Reference Roine and Waldenström2015), is that capital incomes are not only more predominant in the incomes of top earners compared to the rest of the population, but that this predominance keeps growing also within the income top. It is therefore possible that there exists a mechanical relationship between the capital incomes earned by top income earners and the capital share of national income. In order to examine this, Figure 2 displays the long-run trend in the share of capital income of the top percentile’s total income for seven countries. The picture shows how the role of capital incomes at the top has varied over time. Up until WWI and WWII it was the largest income source in most countries, but after the geopolitical shocks of the twentieth century and rise of high-taxation welfare states, capital owners have given way to high-paid salaried employees in the very top of the income distribution.Footnote 10 There are, however, notable exceptions if one looks across the Western world. For example, Roine and Waldenström (Reference Roine and Waldenström2008, Reference Roine and Waldenström2012) show that for Sweden, capital income has remained a predominant income source for the top earners and has even become more dominant in the last decades.
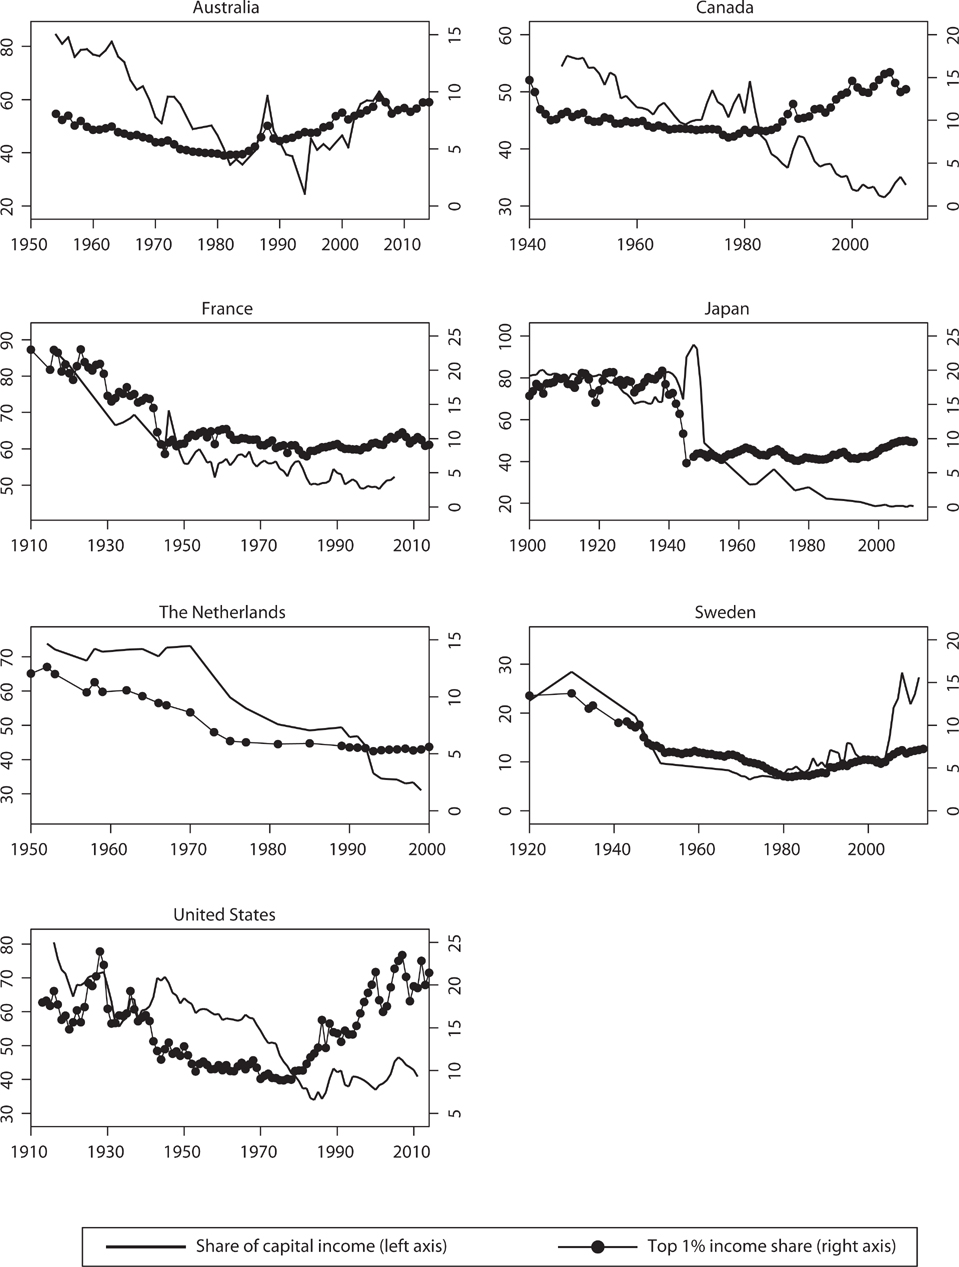
Figure 2 Top 1 Percent Income Share and the Share of Capital Income in the Top 1 Percent Share
We also run panel regressions using different measures of the role of top and wage incomes in the top on the subset of countries for which we have detailed compositional information. The results are presented in Table 4.Footnote 11 The findings indicate an overall stronger relationship when top capital incomes are used than when top wage incomes or top total incomes are used. Comparing the link with the capital share when using only top capital incomes and only top wage incomes, the full-period coefficients are significantly different: 1.69 versus 0.40. The sub-period analyses show the same pattern of a stronger link between top capital incomes and the capital share throughout. We also run the tests using top total incomes on the same subset of countries (i.e., where top capital are observed), and we find once again that capital incomes make the relationship with the capital share stronger. Even though the full-period coefficients are not significantly different, they are different in their level, and when one compares with the baseline coefficient in Table 2, where the standard error is smaller, we find a significant difference with the top capital income estimate. Finally, we examine the relationship when using top total incomes that include realized capital gains, observed for an even smaller sample of countries.Footnote 12 The results indicate no effect from including realized capital gains.
Table 4 How Important Are the Shares of Capital and Wage Incomes in the Top?
Note: Panel regressions with logged inequality outcomes on logged capital shares. See Table 2 and the main text for details.
Source: Authors’ calculations.
Top Income Shares in the Distributed National Accounts (DINA)
The imperfect overlap between the income definitions used in the functional and personal income distributions is potentially one of the key explanations to why the link is not stronger. The functional income distribution refers to shares of national income, that is, the gross domestic product adjusted for cross-border income flows and capital depreciation, and the personal income distribution instead refers to shares of fiscal income, that is, the tax-assessed pre- or post-tax incomes reported to tax authorities and on personal income tax returns. Two recent studies try to overcome this definitional gap by analyzing the distributional national accounts (DINA) over the twentieth and twenty-first centuries: Piketty, Saez, and Zucman (Reference Piketty, Saez and Zucman2018) for the United States and Bertrand Garbtini, Jonathan Goupille-Lebret, and Piketty (Reference Garbinti, Goupille-Lebret and Piketty2017) for France. These studies allocate the entire national income to the adult population by appending the already distributed fiscal incomes with estimated distributions of all other labor and capital incomes that are part of national income but not of tax-assessed income. In the case of top incomes, this addition particularly concerns non-assessed capital income which is primarily non-distributed corporate profits.
In Figure 3, we plot the capital share against the top percentile income share in the fiscal income distribution (our baseline) and the national income distribution (the DINA approach) for France and the United States since the beginning of the twentieth century. The correlation with the capital share is higher for the top national income percentile: 0.78 versus 0.70 for France and 0.50 versus 0.28 for the United States (recall Table 1) over the whole century. In the sub-periods, the DINA top share is in all cases and the largest difference is France post–1980 with 0.70 versus 0.47.
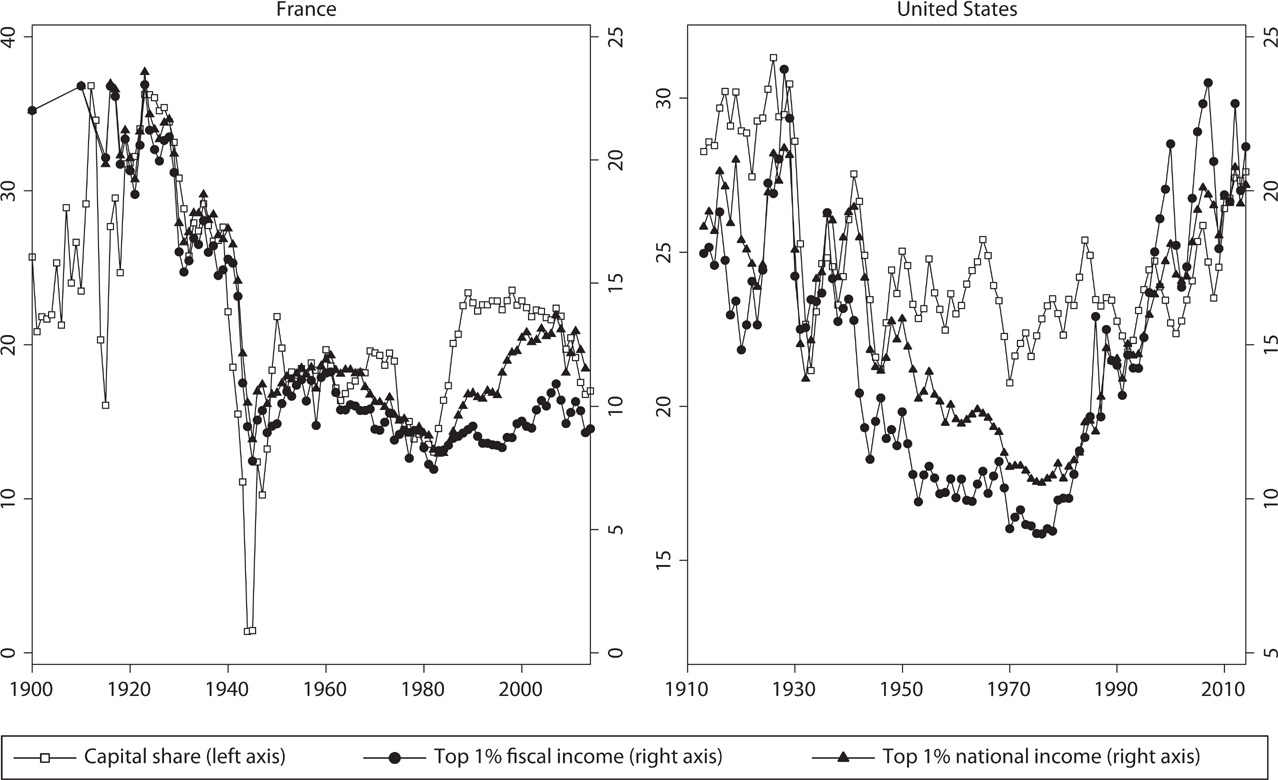
Figure 3 Distributional National Accounts Top Income Shares
Our findings using DINA top shares imply that adding non-assessed capital income to the fiscal incomes strengthens the link between the capital share and inequality, but there is still not a perfect correlation. However, so far only two countries offer long-run DINA top shares and we can therefore not be more precise in the quantification of the effects.
Accounting for Other Determinants
The strong, but still not perfect, connection between the capital share and top income shares indicates that other factors matter in this relationship, thereby confirming what most theoretical models suggest. Table 5 examines how the relationship is affected by including other determinants of inequality. The results show that the estimated coefficient for the capital share falls from 0.99 in the baseline case to 0.47 when all covariates are included, including a common time trend and country fixed effects. This drop is not surprising since we would expect several of the controls to have an influence on both the top income shares and the capital share. For example, transformation from the agrarian to the industrial society could benefit both high-income earners and increase the capital share if we believe that it conveys a higher productivity of capital management. The same reasoning holds for the aggregate importance of stock market capitalization. The size of government measured as central government spending over GDP has little influence on the relationship.Footnote 13 Having said this, it is still noteworthy that the relationship between the capital share and the top percentile income share holds up to all these controls, indicating a deep-seated link between the two income distributions.
Table 5 Controlling for Other Factors
* = Significant at the 10 percent level.
** = Significant at the 5 percent level.
*** = Significant at the 1 percent level.
Note: Panel regressions with logged top income shares as dependent variable on logged capital shares and other logged controls (equation (2)). “Agricultural share” denotes employment share in agriculture, “Stock capital” is total stock market capitalization as share of GDP, and “Gov. spending” is central government spending as share in GDP. Observations are in five-year averages. Robust standard errors in parentheses.
Sources: See the text.
Robustness and Extensions
Using Broader Measures of Income Inequality
A final analysis is to examine the role of measuring income inequality for the correlation. Table 6 shows the fixed-effects regression results when we replace the top income share with Gini coefficients, using the (more problematic) sample of long-run Gini series collected from Atkinson and Morelli (Reference Atkinson2013). The full period correlation using the Gini is a statistically significant 0.26 (panel a), a level that is much lower than what we found previously for the top percentile income share and also what we find in panel b using the exact same sample as in the Gini regressions. Notably, the Gini regression coefficient is in line with what was found when using the bottom of the top decile in Table 5, that is, when analyzing the top groups that consist mainly of high-wage earners with little wealth. Its link in panel c is smaller, which seems to reflect the restricted sample size. Panel d confirms, however, that the sample size restriction does not remove the strong link between top capital incomes and the capital share.
Table 6 Relationship Between the Capital Share and the Gini Coefficient
Note: Panel regressions with logged inequality outcomes on logged capital shares. See Table 2 and the main text for details.
Source: Authors’ calculations.
Looking over the different sub-periods, the Gini results are similar to those found for the top income shares, being lower in the early era and increasing towards the present. The low pre-WWII coefficients could be a result of sample composition because the top income coefficient in Table 5 is notably lower than the same results found earlier using much larger sample sizes.
Predicting Inequality from the Capital Share
Is the capital share a good predictor of inequality? This question has lurked in the background of many capital shares studies, going all the way back to Ricardo’s famous remarks about the prominence of factor shares for distributional analysis.Footnote 14 Despite this, there are few, if any, attempts to examine whether such predictive power has any empirical bearing. We therefore take this question to the data by using our new historical capital shares database. Specifically, we run panel regressions of the top 1 percent share on the capital share with, in some cases, various control variables, but leave out the country whose top income share is to be predicted. Such an “n–1” approach gives us out-of-sample predictions which can be used both to predict or “post-dict” back in time and to test the reliability of the top income shares produced in each of the countries.
Figure 4 displays graphically the result from the prediction regressions (solid lines based on regressions using only the capital share as predicting variables; dashed lines also include other control variables). The overall goodness of fit is a matter of discussion; in most eras the predicted and observed top shares are quite close to each other, which indicates that the capital share is indeed predictive of the top income shares. The yearly variability is larger in the predicted series based only on the capital share whereas it is lower in the case where we also use other controls to predict. Interestingly, adding controls does not notably improve the predictions, which means that even though both the capital share and top income shares are determined by other factors in the economy, this does not seem to matter much for the link between the capital share and the top income shares.
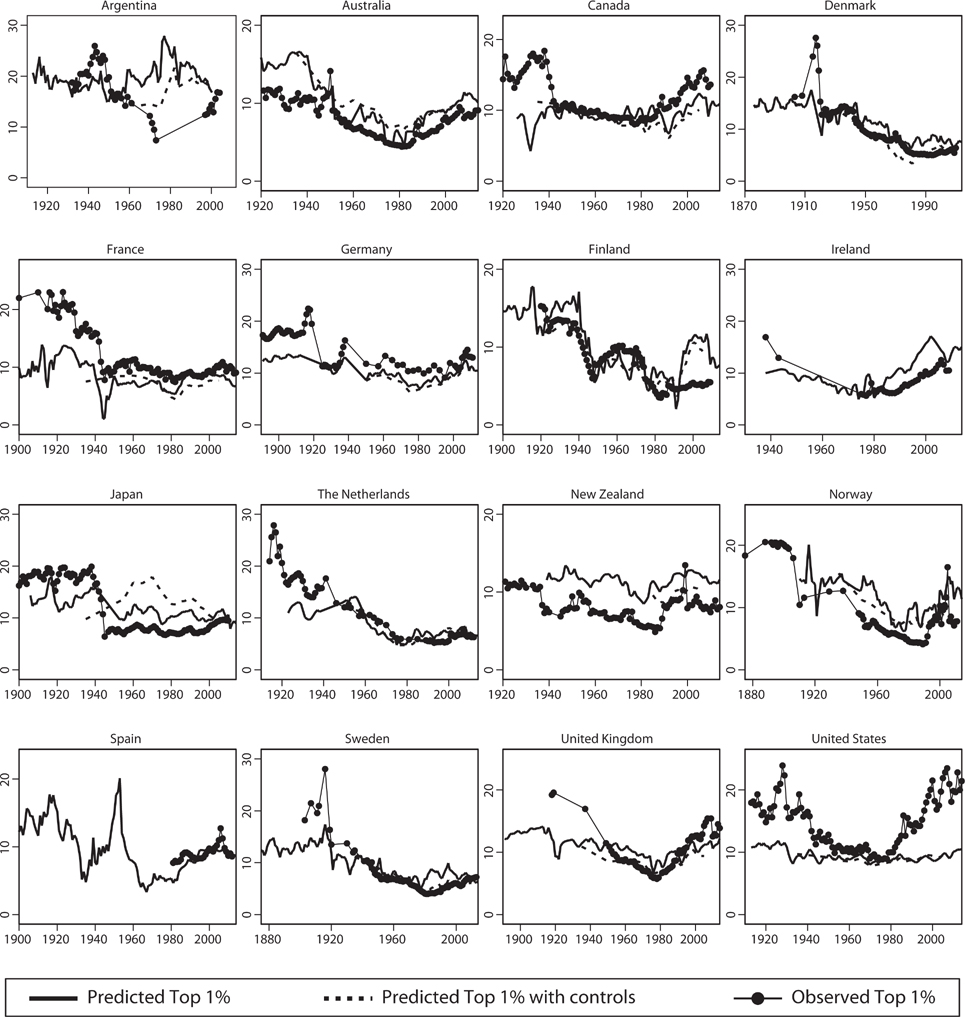
Figure 4 Using the Capital Share to Predict Top Income Shares
There is an interesting pattern in the deviation between the predicted and the observed top shares, and one way to see this is to discuss this pattern separately across historical sub-periods. First, looking at the pre-WWII era, eight of the 16 countries have predicted top shares that are lower than the observed top shares in WID. The difference is largest in France, Germany, Sweden, the United Kingdom, and the United States, where observed top shares are almost twice as large as the predicted ones. For example, the top 1 percent share in France in 1900 was 10 percent according to the actual data, but almost 22 percent when “post-dicted” from the capital share. Second, in the early postwar era the predicted and observed shares are similar except in four countries where predicted shares are higher: Argentina, Australia, Japan, and New Zealand. In four other countries, the predicted and observed shares are at the same level. Third, in the post–1980 era, predicted shares are lower in three countries (Australia, Finland, and New Zealand), higher in two (Canada and the United States), and at about the same level in the other countries.
The interpretation of these prediction results is a matter for discussion and, to some extent, in the eye of the beholder. Almost every country has some period where the observed and predicted series diverge, which suggests that the capital share is not a perfect predictor of top income shares. On the other hand, the capital-share based predictions can be seen as an out of sample check of the validity of the estimated top income shares. We know that the fiscal statistics on which the top income shares rest leaves out some notable income flows, not least reinvested capital income, and the systematic deviations could, therefore, indicate systematic under- or overestimations of national top income shares. Interpreted in this way, our analysis indicates a need to revisit some of the presently used top income shares.
Concluding Remarks
With our newly compiled long-run dataset, we have shown that capital shares and income inequality are correlated, even if this relationship varies by region as well as between different time periods. Overall, the results yield support to assertions that the capital-labor split is an important determinant of inequality.
At the same time, we need to develop our understanding of the mechanisms through which this relationship comes about. One particularly interesting aspect is the exogenous shocks that jointly determine the functional income distribution and the personal income distribution.Footnote 15 These shocks work through wealth inequality and the distribution of different types of assets, pointing to the connections between financial markets, wages, and economic inequality (as in Greenwald, Lettau, and Ludvigson Reference Greenwald, Lettau and Ludvigson2014; Lettau, Ludvigson, and Ma Reference Lettau, Ludvigson and Ma2015). We intend to pursue these questions and extensions in future research. The new historical Capital Shares Database will be a useful resource in these endeavors and other related research on factor shares, income distribution and historical macroeconomics.


