


Introduction
According to the WHO, the proportion of adults above 60 years of age is expected to increase exponentially worldwide(Reference Ho, Chen and Merchant1). Frailty and sarcopenia, which are associated with morbidity and mortality in older adults(2), have considerable overlap in characteristics, including decrease in grip strength, gait speed, muscle mass and functional mobility(Reference Anders, Dapp and Laub3). These characteristics are associated with adverse health outcomes such as an increased risk of falls, institutionalisation and mortality(Reference Liu, Hao and Hai4,Reference Zhang, Zhang and Wang5) .
The European Working Group on Sarcopenia in Older People (EWGSOP) and the Asian Working Group for Sarcopenia (AWGS) have recommended cut-off values for hand grip strength (HGS), physical performance and muscle mass measurements as screening tests of sarcopenia, but there is no consensus on the age range for sarcopenia screening(Reference Chen, Woo and Assantachai6,Reference Cruz-Jentoft, Baeyens and Bauer7) . Since WHO’s Framework for healthy ageing recommends that early-stage interventions are crucial to delaying frailty(8), it is worth examining populations younger than the current recommended guidelines (> 60 years) because loss of muscle mass and strength is pronounced even around the age of 50 years(Reference Bernabei, Landi and Calvani9).
HGS is a convenient and reliable measure of strength capacity and is recommended by both EWGSOP and AWGS for the assessment of muscle strength(Reference Chen, Woo and Assantachai6,Reference Cruz-Jentoft, Baeyens and Bauer7) . HGS weakness, defined as HGS lower than specific cut-off values, has been verified to be associated with chronic diseases, disabilities and mortality(Reference McGrath, Kraemer and Snih10). Moreover, HGS asymmetry, determined by asymmetric grip strength between hands, has also been shown to be a potential predictor of future accumulating morbidities(Reference Klawitter, Vincent and Choi11), falls(Reference McGrath, Clark and Cesari12) and mortality(Reference McGrath, Tomkinson and LaRoche13).
Poor nutrition, especially inadequate intake of energy and protein, plays a key role in the pathogenesis of muscle atrophy, leading to a decrease in muscle strength and mass(Reference Chen, Woo and Assantachai6). Interventions focusing on nutrition assessment may be feasible and cost-effective for maintaining muscle strength and mass at a population level.
The measure of dietary quality, which reflects overall dietary patterns, may be better in capturing the health effects of diet than single nutrients or foods(Reference Kim, Haines and Siega-Riz14). The Dietary Quality Index – International (DQI-I) includes both nutrient and food groups, considering the variety, adequacy, moderation and balance of individuals’ diets(Reference Kim, Haines and Siega-Riz14). Higher DQI-I scores have been associated with better health outcomes such as a lower prevalence of sarcopenia, a decreased prevalence of obesity and a reduced risk of metabolic syndrome(Reference Chan, Leung and Woo15,Reference Abdurahman, Bule and Fallahyekt16) .
While most research on the association between nutrition and HGS has been conducted in Western countries, only a few studies have focused on Asian populations(Reference Chan, Leung and Woo15,Reference Chan, Leung and Woo17,Reference Kim and Kwon18) . However, these results were all based on single East Asian populations and are therefore non-representative of the ethnic diversity in Southeast Asian countries. Furthermore, these studies were restricted to older adults. Therefore, large-scale observational studies are needed to assess the effect of nutrition on HGS in a multi-ethnic Southeast Asian population with a wider adult age range.
In this study, we aim to investigate the association between diet, using DQI-I as an indicator, and HGS (including HGS weakness and asymmetry) in a multi-ethnic population in Singapore. We hypothesise that individuals with high dietary quality have increased HGS as well as lower odds of HGS weakness and asymmetry in this multi-ethnic population.
Methods
Study design and participants
This study used cross-sectional data from the follow-up of the Singapore Multi-Ethnic Cohort (MEC)(Reference Tan, Tan and Sim19). The cohort was followed up between 2011 and 2016, comprising 6101 participants (aged 21–75 years and consisting of Chinese, Malay, and Indian ethnicities). During this revisit, FFQ and HGS measurements were conducted.
Of the 6101 participants, those aged 50 years or over were enrolled in this study (n 3743). Further exclusion criteria included individuals with missing data for HGS (n 1835), FFQ (n 253) and covariates (n 75). Individuals with extreme energy intakes ( < 500 kcal or > 8000 kcal; n 33) were also excluded, leaving 1547 participants for final analysis (Fig. 1).

Fig. 1. The flow chart of eligible and excluded Singapore Multi-Ethnic Cohort (MEC) participants in this study. HGS, hand grip strength.
Calculation of Dietary Quality Index – International scores
Dietary intake was assessed using a semi-quantitative 169-item FFQ, developed from a 2-d 24-h dietary recall survey. This recall survey covered dietary habits on both a working day and a non-working day in the local population(Reference Neelakantan, Whitton and Seah20,Reference Whitton, Ho and Tay21) . Each participant’s FFQ recorded the frequency of consuming one serving of each item over the past year, along with a description of the standard portion size for each item. The recorded frequency for each item was then converted into the number of servings per d and totalled within five food groups, including vegetables, fruits, grains, meat/poultry/fish/egg and dairy products/beans. To estimate daily energy intake and daily consumption of macronutrients and micronutrients for each participant, we utilised the Singapore Food Composition database (accessible at https://focos.hpb.gov.sg/eservices/ENCF/)(Reference Tan, Tan and Sim19). This database provided information on energy content and the amounts of various macronutrients and micronutrients per serving of each food item.
Dietary data from the FFQ were converted into DQI-I, which has four components: variety, adequacy, moderation and balance (online Supplementary Table 1). Based on predefined scoring criteria, each component of DQI-I is awarded a score and DQI-I is calculated by adding the four scores together, generating a score ranging from 0 to 100. A higher score represents better diet quality(Reference Kim, Haines and Siega-Riz14). In this study, Na and cholesterol calculations were omitted because Na intake remained difficult to quantify in Singapore, and dietary cholesterol was indicated as an inaccurate predictor of health outcomes by recent studies(Reference McLean, Farmer and Nettleton22,Reference Soliman23) . Therefore, the possible maximum DQI-I score in this study was 88. DQI-I was used as both a continuous and categorical variable (divided into quartiles, with the 1st quartile having the lowest diet quality). Moreover, DQI-I component scores were divided into tertiles with the 1st tertile having the lowest score. Of note, the numbers of participants across tertiles of DQI-I components were not equal because usually more than one-third of participants had the same score and were divided into the same tertile.
Measurement of hand grip strength
HGS was measured using a hand dynamometer (TAKEI A5401), and three readings were recorded for each hand. HGS (kg) was calculated as the maximum value of six measurements from both hands. HGS (kg) was firstly treated as a continuous outcome variable. Thereafter, to examine the association of DQI-I with HGS weakness and asymmetry, three binary outcomes were assessed separately, including HGS weakness alone, HGS asymmetry alone, and both HGS weakness and asymmetry. The cut-off values for HGS weakness were defined as < 28 kg for males and < 18 kg for females according to the AWGS 2019 consensus(Reference Chen, Woo and Assantachai6). Based on the ‘10 % rule’, HGS asymmetry was defined as the ratio of maximum HGS for non-dominant hand to that for dominant hand below 0·90 or over 1·10(Reference Klawitter, Vincent and Choi11). HGS weakness and asymmetry were treated as a composite outcome if the criteria for both HGS weakness and HGS asymmetry were met.
Assessment of covariates
Smoking status was coded as a binary variable (never smoking or ever smoking). Diabetes was defined based on any of the following criteria: 1. formerly diagnosed by a physician; 2. taking anti-diabetic medication; 3. fasting blood glucose ≥ 7·0 mmol/l; 4. random blood glucose ≥ 11·1 mmol/l.
A physical activity questionnaire was used to record the type, frequency and duration of various activities performed by participants in different domains, including transportation, occupation, leisure time and household activities. The daily physical activity level (MET-h/d) was calculated using the 2011 Compendium of Physical Activity based on the responses provided in the questionnaire(Reference Ainsworth, Haskell and Herrmann24). The physical activity questionnaire was validated for use in the local population and demonstrated good to modest agreement with accelerometer measurements(Reference Tan, Tan and Sim19). However, given the potential for error in assessing low-intensity activities, only activities of moderate-to-vigorous activity (MVPA), defined as activities over 3·0 metabolic equivalents (MET), were considered in the analysis.
Statistical analysis
Baseline characteristics of participants were expressed as mean (sd) or median (25th and 75th percentile) for continuous variables based on data distribution and as count (percentage) for categorical variables. To compare differences in baseline characteristics across DQI-I quartiles, Pearson’s χ 2 test, Kruskal–Wallis test, and ANOVA were conducted for categorical, non-normally distributed, and normally distributed variables, respectively.
Multivariable linear regression was used to estimate the regression coefficients (β) and 95 % CI for the association between DQI-I and HGS (kg). The association between each DQI-I component and HGS (kg) was also examined using linear regression. Collinearity of covariates with DQI-I was evaluated by generalised variance inflation factor of each covariate using package Car in R. Multivariable logistic regression was used to estimate the OR and 95 % CI for the association between DQI-I and odds of HGS weakness, HGS asymmetry, or both. The dose–response relationship between the quantiles of DQI-I or DQI-I components and HGS was evaluated using P for linear trend.
Multivariable regression model building was performed using a forward stepwise approach, and the entry criterion for covariates was set as a P-value of < 0·1 in the simple regression model. Furthermore, covariates that could be on the causal pathway between DQI-I and HGS (e.g. total energy intake, BMI and diabetes) were excluded. Model 1 was an unadjusted model. Model 2 adjusted for age (years), sex, ethnicity, total MVPA (MET-h/d) and smoking status.
To determine whether age, sex, ethnicity and physical activity modified the association between DQI-I and HGS, multiplicative interaction terms of DQI-I with these factors were added in the fully adjusted model(Reference Dan, Kim and Kim25,Reference Yumuk, Tsigos and Fried26) .
To control for the oversampling strategy employed in the MEC study, which means the Malay and Indian participants were oversampled as compared with the general population, a weight of 1·637, 0·625 and 0·237 was assigned to Chinese, Malay and Indian participants, respectively, based on the ethnic distribution. Subsequently, weighted regression analyses were conducted which showed similar relationship of DQI-I with HGS (online Supplementary Table 2–4).
Statistical analysis was performed using R (version 4.2.1, R Foundation for Statistical Computing, Vienna, Austria). Statistical significance was defined as a P-value of < 0·05.
Results
Characteristics of study participants
Table 1 shows the baseline characteristics of study participants in each quartile of DQI-I scores. The mean (sd) age of participants included in our study was 59·2 (7·5) years, and 58·9 % of participants were female. The mean (sd) DQI-I score was 35·8 (12·3) out of 88, and the mean (sd) HGS was 25·1 (8·1) kg. Participants with higher DQI-I scores were more likely to be female, of Chinese and Indian ethnicities, and have higher physical activity, total energy intake, and higher HGS. BMI, smoking status and proportions of diabetes were not significantly different across DQI-I quartiles.
Table 1. Baseline characteristics of study participants by dietary quality (DQI-I) score*

DQI-I, Dietary Quality Index – International; MET, metabolic equivalents of task.
* Values are expressed as mean (sd) or median (25th, 75th percentile) for continuous variables based on data distribution and as n (%) for categorical variables. Pearson’s χ 2 test, Kruskal–Wallis test and ANOVA were conducted for categorical, nonnormal and normally distributed variables, respectively.
Due to a large proportion of participants with missing HGS data, we compared baseline characteristics between participants with and without HGS data (online Supplementary Table 5). The results suggest that these two groups are largely comparable.
Associations of Dietary Quality Index – International with hand grip strength (kg)
As shown in Table 2, each sd increment in DQI-I was associated with an increase in mean HGS by 0·51 (95 % CI 0·26, 0·76) kg in the fully adjusted model. Higher quartile of DQI-I was significantly associated with higher HGS (P for trend < 0·001), and highest quartile showed 1·11 (95 % CI 0·41, 1·82) kg higher HGS than the lowest quartile after adjustment.
Table 2. Association of dietary quality (DQI-I) with hand grip strength (kg) as a continuous variable*
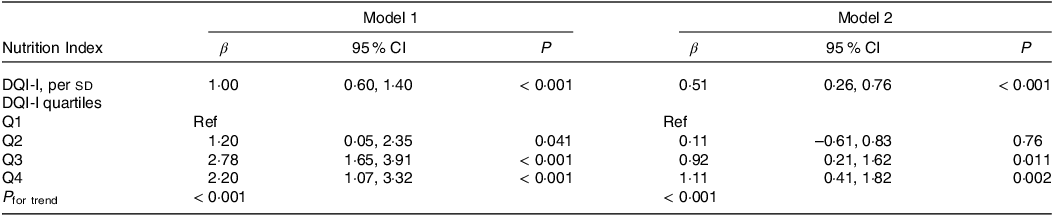
DQI-I, Dietary Quality Index – International; MVPA, moderate-to-vigorous physical activity; MET, metabolic equivalents of task.
* Model 1: unadjusted model. Model 2: adjusted for age (years), sex, ethnicity, total MVPA (MET-h/d) and smoking status.
Associations of Dietary Quality Index – International with hand grip strength weakness and asymmetry
After adjustment for covariates, each sd increment in DQI-I was associated with 15 % lower odds of HGS weakness (OR = 0·85, 95 % CI 0·75, 0·95), 10 % lower odds of HGS asymmetry (OR = 0·90, 95 % CI 0·81, 0·99) and 23 % lower odds of both HGS weakness and asymmetry (OR = 0·77, 95 % CI 0·66, 0·90) (Table 3).
Table 3. OR for the association of dietary quality (DQI-I) with hand grip strength weakness and asymmetry*

DQI-I, Dietary Quality Index – International; MVPA, moderate-to-vigorous physical activity; MET, metabolic equivalents of task.
* Hand grip strength weakness was defined as maximum hand grip strength below sex-specific cut-offs (< 28 kg for males and < 18 kg for females). Hand grip strength asymmetry was defined as the ratio of maximum hand grip strength for non-dominant hand to that for dominant hand below 0·9 or over 1·1. HGS weakness and asymmetry was treated as a composite outcome if the criteria for both HGS weakness and HGS asymmetry were met. Model 1: unadjusted model. Model 2: adjusted for age (years), sex, ethnicity, total MVPA (MET-h/d) and smoking status.
Compared with the lowest quartile, the highest DQI-I quartile observed 31 % lower odds of HGS weakness (OR = 0·69; 95 % CI 0·50, 0·97; P for trend = 0·023), 29 % lower odds of HGS asymmetry (OR = 0·71; 95 % CI 0·53, 0·94; P for trend = 0·035), and 50 % lower odds for both HGS weakness and asymmetry (OR = 0·50; 95 % CI 0·32, 0·76; P for trend = 0·004), in the fully adjusted model.
Association of hand grip strength with individual Dietary Quality Index – International components
Table 4 displays the association of each DQI-I component included in this study with HGS (kg) and HGS weakness and asymmetry. Compared with the lowest tertile, a mean increase of 1·47 (95 % CI 0·66, 2·28) kg in HGS was observed in the highest tertile of adequacy and the dose–response relationship across the tertiles was significant (P for trend < 0·001), after adjusting for demographics and lifestyle factors. Moreover, the highest tertile of adequacy showed 51 % lower odds for both HGS weakness and asymmetry (OR = 0·49; 95 % CI 0·29, 0·81; P for trend = 0·006) compared with the lowest tertile. However, associations of HGS with other components of DQI-I (variety, moderation and balance) were not significant.
Table 4. Association of dietary quality score (DQI-I) components with hand grip strength*

DQI-I, Dietary Quality Index – International; MVPA, moderate-to-vigorous physical activity; MET, metabolic equivalents of task.
* Model adjusted for age (years), sex, ethnicity, total MVPA (MET-h/d) and smoking status. Hand grip strength weakness was defined as maximum hand grip strength below sex-specific cut-offs (< 28 kg for males and < 18 kg for females). Hand grip strength asymmetry was defined as the ratio of maximum hand grip strength for non-dominant hand to that for dominant hand below 0·9 or over 1·1. HGS weakness and asymmetry was treated as a composite outcome if the criteria for both HGS weakness and HGS asymmetry were met.
Assessment of effect modifiers in the association between Dietary Quality Index – International and hand grip strength
There was no significant interaction between DQI-I and HGS by age, sex, and physical activity. However, the association between DQI-I and HGS (kg) was significantly different across ethnicity (P for interaction = 0·011).
We further stratified the data by ethnic groups (online Supplementary Table 6). We found that there was no significant relationship between DQI-I and HGS (kg) in the Malay, while a significant association was observed between DQI-I and HGS (kg) in Chinese and Indian ethnicities (for Chinese, β = 0·57, 95 % CI 0·16, 0·98; for Indian, β = 0·95, 95 % CI 0·47, 1·43). Moreover, there was a significant association of DQI-I with HGS weakness (OR = 0·73, 95 % CI 0·59, 0·89), HGS asymmetry (OR = 0·81, 95 % CI 0·67, 0·96), and both HGS weakness and asymmetry (OR = 0·66, 95 % CI 0·51, 0·85) in the Indian ethnicity.
Discussion
In this multi-ethnic Southeast Asian population, higher adherence to a healthy dietary pattern measured by DQI-I was associated with higher HGS and lower odds of HGS weakness and asymmetry, independent of demographics and lifestyle factors. Sufficient consumption of vegetables, fruits, protein and other beneficial foods and nutrients might be the most critical factor of a healthy diet that could help improve HGS.
Nutrition has long been considered important for maintaining muscle strength. In a cross-sectional study of a US adult population, the highest quartile of Healthy Eating Index-2015 (HEI-2015) was associated with a 24 % lower risk of having low HGS compared with the lowest quartile of the study population(Reference Bigman and Ryan27). Another US study used three indices to evaluate diet quality and found that those in the highest quintile of diet scores had 53 % lower odds of frailty and 25 % lower odds of pre-frailty compared with the lowest quintile(Reference Ward, Orkaby and Chen28). A UK study in an elderly population indicated that poor diet quality was significantly related to lower HGS at baseline and follow-up(Reference Bloom, Pilgrim and Jameson29). Besides the aforementioned studies which were performed in Western countries, some other studies have explored the relationship between nutrition and muscle strength in single East Asian populations. A prospective cohort study in a Chinese elderly population in Hong Kong indicated a 50 % reduction in the risk of sarcopenia (only for men) in the highest quartile of DQI-I compared with the lowest(Reference Chan, Leung and Woo15) and a 31 % reduction in the risk of frailty per 10-unit increase in DQI-I scores(Reference Chan, Leung and Woo17). Another study in a Korean elderly population found that higher scores of dietary quality indices were associated with lower odds of low HGS(Reference Kim and Kwon18). Therefore, the direct association between diet quality and HGS (kg) and the inverse association between diet quality and odds of HGS weakness in our study are consistent with previous findings.
The previous studies that examined the relationship between diet and muscle strength usually focused on dietary patterns because this could help assess the overall influence of the diet and take into account potential interactions between dietary constituents(Reference Robinson, Granic and Sayer30). This approach was illustrated by a systematic review of prospective cohort studies, which showed that high adherence to the Mediterranean and Nordic diet was associated with a lower risk of sarcopenia(Reference Jang, Han and Jang31). The Mediterranean and Nordic diet are both characterised by a high consumption of vegetables, fruits, wholegrain products, and plant oils, a low consumption of red meat, and low to moderate intake of alcohol(Reference Bigman and Ryan27).
The association between the consumption of specific foods and nutrients with muscle strength has been investigated in observational and intervention studies(Reference Ten Haaf, Nuijten and Maessen32,Reference Veronese, Stubbs and Punzi33) . Dietary protein intake, as an important nutrient to promote muscle protein synthesis, is crucial for the maintenance of muscle mass and strength(Reference Celis-Morales, Petermann and Steell34). In the prospective Framingham Offspring Cohort, increased protein intake was significantly associated with higher HGS, regardless of the protein source(Reference McLean, Mangano and Hannan35). Another study using UK Biobank data also found a direct association between protein intake and HGS(Reference Celis-Morales, Petermann and Steell34). Other food groups such as vegetables and fruits are considered beneficial for maintaining muscle function, because they contain a wide range of antioxidants (e.g. vitamin C, vitamin E and polyphenols). Oxidative damage of muscle proteins may be a key pathological mechanism leading to muscle strength loss, especially in elderly populations(Reference Howard, Ferrucci and Sun36). A cross-sectional study in Korean older adults showed that a higher consumption of vegetables and fruits was inversely associated with the risk of sarcopenia(Reference Kim, Lee and Kye37). Another study in the UK using increased consumption of vegetables and fruits as an intervention indicated that higher intake of vegetables and fruits could improve muscle strength in healthy older adults(Reference Neville, Young and Gilchrist38). Interestingly, both studies took into account the total amount of daily intake of vegetables and fruits rather than the diversity of vegetables or fruits consumed.
Our study showed a similar pattern when we further investigated the impact of each DQI-I component on HGS. Among the four components comprising DQI-I (variety, adequacy, moderation and overall balance), only adequacy was found to be significantly associated with HGS as well as odds of HGS weakness and asymmetry. This suggests that sufficient consumption of vegetables, fruits, protein and other beneficial foods and nutrients is important to maintain muscle strength in this study population. Eight dietary variables are considered in the adequacy component of the DQI-I: vegetables, fruits, grains, fibre, protein, Fe, Ca and vitamin C(Reference Kim, Haines and Siega-Riz14). Each dietary variable is given a score of 5 or 0 based on a cut-off value, which indicates sufficient intake for a healthy diet. As discussed above, previous studies support that higher intakes of vegetables, fruits, protein and vitamin C are beneficial for maintaining muscle strength. A higher intake of these nutrients will reflect as a higher score for the DQI-I adequacy component. In our study, dietary variety was not significantly associated with HGS, neither overall variety across food groups nor variety for protein source. These findings suggest that sufficient intake of beneficial foods and nutrients may matter more than variety for the maintenance of HGS. This finding is consistent with previous studies which showed the benefits of adequate consumption of protein, vegetables and fruits for muscle strength regardless of diversity within these food groups(Reference McLean, Mangano and Hannan35,Reference Kim, Lee and Kye37,Reference Neville, Young and Gilchrist38) .
Furthermore, our study was the first to examine the association between diet quality and HGS asymmetry and the results showed a probable quadric relationship with the second quartile of DQI-I having the lowest odds of HGS asymmetry. We cannot fully exclude the possibility that some covert confounders could have biased this relationship, leading to a non-linear association. This speculation requires further verification.
In this study, we did not find the association between DQI-I and HGS in the Malay. This might be attributed to genetic differences across ethnicities. Moreover, dietary patterns differ vastly across ethnic cultures(Reference Huang, Tan and Tan39), and these differences may be difficult to capture and evaluate in diet questionnaires. No previous studies have compared the association between diet quality and HGS across ethnicities, and therefore our study sheds light on a possibility that ethnicity may influence the effect of diet on muscle strength, which requires investigation in large-scale and multi-ethnic observational studies in the future.
This study has some limitations worth mentioning. As a cross-sectional study, we can only confirm an association between diet quality and HGS rather than causality. Only HGS was collected in this cohort without measurements on physical performance or muscle mass, so only the relationship of diet quality with muscle strength rather than sarcopenia could be investigated. Dietary information was collected via self-reported questionnaires, which might lead to some misclassification. Furthermore, two categories (i.e. cholesterol and Na) were omitted when calculating moderation scores (6 points for each) in this study, and it might slightly alter the measures of association between overall DQI-I scores and HGS. Another limitation of this study is residual confounding, which is common in an observational study. However, we adjusted for a wide range of potential confounders in regression models, including demographics and lifestyle factors. Although we find an association between muscle strength and adequate intake of beneficial foods and nutrients, we cannot examine the individual components (e.g. protein) and provide a recommendation for their daily intake. Therefore, further studies focusing on the consumption of certain foods and nutrients may be of concern.
This study used data from a health screening cohort, including three major ethnic groups in Singapore with a broad age range, which provides a high degree of generalisability for the results and thus is one of the most important strengths of this study. This study is also a complement to current findings regarding the association between diet quality and HGS in Southeast Asian populations. Our dataset included many covariates related to diet quality and muscle strength, facilitating adjustment for confounders. Moreover, HGS is considered a convenient measure of assessing sarcopenia owing to its low cost, ease of use, and its association with leg strength(Reference Lim, Yew and Tay40) and therefore can be implemented as part of a comprehensive screening tool in primary care settings. Likewise, DQI-I can be used widely to assess nutrition status using a short screener with good reproducibility and relative validity(Reference Whitton, Ho and Tay21). These features make it feasible and practical to use DQI-I as a dietary criterion to guide people how to follow a healthy diet and prevent sarcopenia.
Conclusion
In a multi-ethnic Southeast Asian population, higher dietary quality was associated with better muscle strength measured by HGS and lower odds of HGS weakness and asymmetry. In particular, sufficient consumption of vegetables, fruits, protein, and other beneficial foods and nutrients was associated with higher HGS and also lower odds of HGS weakness and asymmetry. Our findings support that DQI-I, an indicator of overall diet quality, can be used to evaluate nutrition status of people and provide dietary guidelines for prevention and management of muscle wasting, sarcopenia, and frailty.
Acknowledgements
The authors thank all the participants and investigators of the Singapore Multi-Ethnic Cohort study.
This work was supported by NUS start-up grant (R-608-000-257-133), National Medical Research Council Singapore, Transition Award (R-608-000-342-213) and Ministry of Education, Academic Research Fund Tier 1 (A-0006106-00-00).
J. H. analysed and interpreted data and drafted and revised paper; A. S. analysed and interpreted data and drafted paper; X. H. analysed and interpreted data; R. M. v. D. revised paper critically for important intellectual content; S. H. designed the study, revised paper critically for important intellectual content and obtained funding; and all authors have read and approved the final manuscript.
All authors report no conflicts of interest.
This study was conducted according to the guidelines laid down in the Declaration of Helsinki, and all procedures involving research study participants were approved by the Institutional Review Board (IRB) of the National University of Singapore. Signed informed consents were obtained from all participants by bilingual study coordinators, in participants’ preferred language prior to recruitment.
Data described in the manuscript, code book and analytic code will be made available upon request pending application and approval from the corresponding author.
Supplementary material
For supplementary material accompanying this paper visit https://doi.org/10.1017/S0007114523002647


 Open access