


Introduction
Unhealthy patterns of food consumption, including excess energy intake, are major contributors to high and rising rates of obesity leading to increasing deaths worldwide (Global Burden of Disease Obesity Collaborators, 2017; Steel et al., Reference Steel, Ford, Newton, Davis, Vos, Naghavi, Glenn, Hughes, Dalton and Stockton2018; Swinburn et al., Reference Swinburn, Kraak, Allender, Atkins, Baker, Bogard, Brinsden, Calvillo, De Schutter and Devarajan2019; Lindberg et al., Reference Lindberg, Hagman, Danielsson, Marcus and Persson2020). Increasing rates of obesity are largely attributable to food environments (Swinburn et al., Reference Swinburn, Sacks, Hall, McPherson, Finegood, Moodie and Gortmaker2011; Tyrrell et al., Reference Tyrrell, Wood, Ames, Yaghootkar, Beaumont, Jones, Tuke, Ruth, Freathy and Davey Smith2017; Brandkvist et al., Reference Brandkvist, Bjørngaard, Ødegård, Åsvold, Sund and Vie2019). Factors such as the increasing availability of unhealthy foods and the increasing portion size of foods contribute to these unhealthy food environments and are therefore key targets for intervention (Marteau et al., Reference Marteau, Hollands and Fletcher2012). There is growing evidence that targeting these aspects of the food environment, namely replacing higher calorie foods with lower calorie alternatives and reducing portion sizes, are effective interventions for reducing energy intake (Zlatevska et al., Reference Zlatevska, Dubelaar and Holden2014; Hollands et al., Reference Hollands, Shemilt, Marteau, Jebb, Lewis, Wei, Higgins and Ogilvie2015, Reference Hollands, Carter, Anwer, King, Jebb, Ogilvie, Shemilt, Higgins and Marteau2019; Pechey et al., Reference Pechey, Cartwright, Pilling, Hollands, Vasiljevic, Jebb and Marteau2019; Reynolds et al., Reference Reynolds, Ventsel, Kosīte, Rigby Dames, Brocklebank, Masterton, Pechey, Pilling, Pechey, Hollands and Marteau2021). However, relatively low public support for policies that aim to limit the availability and size of less health food products (Petrescu et al., Reference Petrescu, Hollands, Couturier, Ng and Marteau2016; Reynolds et al., Reference Reynolds, Archer, Pilling, Kenny, Hollands and Marteau2019a) limits the likelihood that they will implement (Burstein, Reference Burstein2003; Cullerton et al., Reference Cullerton, Donnet, Lee and Gallegos2016, Reference Cullerton, Donnet, Lee and Gallegos2018; Sevenans, Reference Sevenans2021).
There are many factors that explain why the public support or oppose government policies (e.g. increasing tax on fossil fuels, mandating warning labels on foods high in sugar and fat). These factors include beliefs about the problem that the policy is trying to address (Hilbert et al., Reference Hilbert, Rief and Braehler2007; Barry et al., Reference Barry, Brescoll, Brownell and Schlesinger2009), perceived fairness of the policy (Eriksson et al., Reference Eriksson, Garvill and Nordlund2008), personal outcome expectations (Schade & Schlag, Reference Schade and Schlag2003; Schuitema et al., Reference Schuitema, Steg and Rothengatter2010) and – key to the current study – the perceived effectiveness of the policy (Lam, Reference Lam2014; Storvoll et al., Reference Storvoll, Moan and Rise2015; Huber et al., Reference Huber, Wicki and Bernauer2020). One approach to increase support for policies is to communicate evidence that the policy is effective (Reynolds et al., Reference Reynolds, Stautz, Pilling, van der Linden and Marteau2020a). This systematic review synthesised results from 35 studies across multiple policies domains including health, environmental and immigration policies and concludes that communicating evidence of policy effectiveness can increase support by approximately four percentage points, e.g. from 50% to 54%. Given that the key mediating variable is the belief that the policy is effective (Reynolds et al., Reference Reynolds, Pilling and Marteau2018), maximising the degree to which this belief is changed should subsequently lead to greater increases in public support. One study attempted to change this belief by comparing asserted and quantified evidence (‘this policy will reduce tobacco use by 10%’) against asserted evidence (‘this policy will reduce tobacco use’), but this had no detectable impact on beliefs about policy effectiveness (Reynolds et al., Reference Reynolds, Archer, Pilling, Kenny, Hollands and Marteau2019a). A second study successfully changed beliefs about policy effectiveness by communicating ‘enhanced evidence’ against ‘basic evidence’ but the latter comprised multiple components making it unclear which component(s) was key (Reynolds et al., Reference Reynolds, Pilling and Marteau2018). Visualisation of evidence – using graphs or infographics – has been shown in other contexts to increase attention and recall of information (Lipkus, Reference Lipkus2007; Borkin et al., Reference Borkin, Vo, Bylinskii, Isola, Sunkavalli, Oliva and Pfister2013) and has been shown to change beliefs, yet it is unclear whether these benefits would translate into greater belief and attitude change within the context of healthy eating policies. Many studies that investigate influences on policy support have communicated various types of information in images, visualisations or infographics (Niederdeppe et al., Reference Niederdeppe, Roh and Dreisbach2016; Young et al., Reference Young, Hinnant and Leshner2016; Zhou & Niederdeppe, Reference Zhou and Niederdeppe2017; McGlynn & McGlone, Reference McGlynn and McGlone2018; Reynolds et al., Reference Reynolds, Pilling and Marteau2018, Reference Reynolds, Vasiljevic, Pilling, Hall, Ribisl and Marteau2020b). However, of these, only one visualised evidence of policy effectiveness (Reynolds et al., Reference Reynolds, Pilling and Marteau2018) and none tested this against the same information in non-visual (i.e. text-based) form. Despite a large number of studies using visualisations to communicate information within this field, it is still unclear whether visualising evidence would be more effective at changing the perceived effectiveness of policies.
The effectiveness of specific food policies is often described in terms of the reduction in calories that are consumed or purchased (Zlatevska et al., Reference Zlatevska, Dubelaar and Holden2014; Hollands et al., Reference Hollands, Cartwright, Pilling, Pechey, Vasiljevic, Jebb and Marteau2018; Pechey et al., Reference Pechey, Cartwright, Pilling, Hollands, Vasiljevic, Jebb and Marteau2019). Effectively communicating this information requires that the target audience understand calorie content, yet previous research has shown that the public either over- or underestimate the calorie content of food and drink products (Taksler & Elbel, Reference Taksler and Elbel2014; Horne et al., Reference Horne, Palermo, Neumann, Housley and Bell2019). Re-expressing calorie content into more familiar terms could increase the impact of providing information about the effectiveness of food policies that reduce energy intake. This is illustrated in PACE (Physical Activity Calorie Equivalent) food labels in which calorie information (e.g. a bag of crisps; 150 Calories) is re-expressed as the amount of physical activity needed to expend the energy (e.g. 47 minutes walking). A recent systematic review suggests that re-expressing calories within PACE labels may be more effective at changing behaviour than calorie labels alone (Daley et al., Reference Daley, McGee, Bayliss, Coombe and Parretti2019). The current study builds on this approach by investigating whether re-expressing calorie information in terms of the equivalent energy content of a familiar food (Mars® bars) can change perceived effectiveness of a policy targeting energy intake.
The current study aims to investigate whether communicating evidence of policy effectiveness can change perceptions of intervention effectiveness and support for policies. We first hypothesise that communicating evidence of policy effectiveness will increase perceptions of policy effectiveness. We also hypothesise that visualising evidence and re-expressing evidence of policy effectiveness will both increase perceptions of policy effectiveness. We investigate these hypotheses within the context of two food policies that target out-of-home eating establishments: (i) replacing some higher energy foods with lower energy foods and (ii) reducing the portion size of some higher energy foods.
Methods
The study was preregistered with the Open Science Framework (DOI: https://doi.org/10.17605/OSF.IO/KMFPG). There were no deviations from the protocol or statistical analysis plan. All study materials, sample size calculation, data and code can be found in the same OSF folder.
Participants
A research agency (www.onepoll.com) recruited 4500 participants that were representative of the English population based on quotas for age, gender, geographic region and educational attainment. Data collection occurred from October to November 2020. The mean age of the sample was 47.50 (SD = 16.70) and 51% were female. See Table S1 in the Supplementary Material for the full demographic characteristics of the sample. All participants passed the attention check and so none were excluded. Participants took a mean of 4 minutes and 6 seconds (SD = 12 m 22 s) to complete the questionnaire. 335 (7%) of eligible participants dropped out and recruitment continued until the target number of completed surveys was reached.
Sample size calculation
We aimed to recruit 4500 participants (900 per group) to ensure that we would have at least 90% power to test all three primary hypotheses. Testing the first hypothesis required combining all four evidence groups into one, which was then compared against the control group. To maintain 90% power for detecting effect sizes larger than d = 0.13 (Reynolds et al., Reference Reynolds, Pilling and Marteau2018), with α = 0.05, we needed to recruit at least 755 participants into the control group. The second and third hypotheses were to be tested in a 2 × 2 design using Groups 2–5. To have 90% power for detecting effect sizes larger than d = 0.13, with α = 0.05, we needed to recruit at least 2924 participants for the four groups that receive evidence (731 in each).
Design
We conducted an online study using a between-participants design, with five groups varying in: their visualisation of evidence (text only vs infographic) as well as their use of re-expression (no re-expression vs re-expression), with one control group given no evidence (see Figure 1). Participants were randomly allocated to one of the five groups, using the research agency's software.
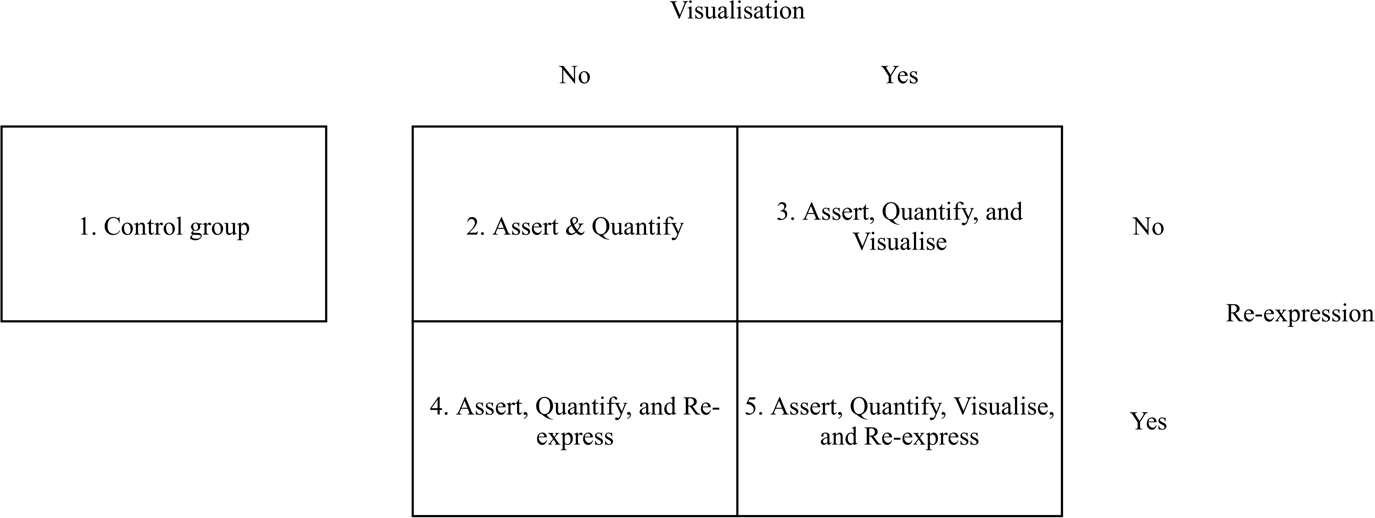
Figure 1. Study design.
Interventions
Participants in all five groups received the same background information about obesity and a description of the two policies to encourage healthy eating (see Supplementary Material B for all interventions). Four of the five groups received further information which described the effectiveness of the two interventions at reducing calorie intake. The evidence that was presented in these interventions was obtained from a study (Reynolds et al., Reference Reynolds, Ventsel, Kosīte, Rigby Dames, Brocklebank, Masterton, Pechey, Pilling, Pechey, Hollands and Marteau2021) that tested (i) replacing some higher energy foods with lower energy foods (Availability; product × availability intervention in the TIPPME typology (Hollands et al., Reference Hollands, Bignardi, Johnston, Kelly, Ogilvie, Petticrew, Prestwich, Shemilt, Sutton and Marteau2017)) and (ii) reducing the portion size of some higher energy foods in cafeterias (Size; product × size intervention (Hollands et al., Reference Hollands, Bignardi, Johnston, Kelly, Ogilvie, Petticrew, Prestwich, Shemilt, Sutton and Marteau2017)).
1. Control group: Provided with background information on obesity and description of two policies with no information on policy effectiveness.
2. Assert and Quantify: Provided with background information on obesity, description of two policies, and an additional sentence that asserted and quantified the effectiveness of the two policies.
3. Assert, Quantify and Visualise: Provided with background information on obesity, description of two policies, and the same information as Group 2, however this information was integrated into an infographic and presented visually.
4. Assert, Quantify and Re-express: Provided with background information on obesity, description of two policies and the same information as Group 2, however a further sentence was added that converted the number of calories into the equivalent amount of a familiar food (Mars bars).
5. Assert, Quantify, Visualise and Re-express: Provided with background information on obesity, description of two policies and the visualised information as Group 3 with the addition of the re-expression used in Group 4 (see Figure 2).

Figure 2. The infographic used in Group 5. See the Supplementary Material for all other infographics.
Measures
Primary outcome
Perceived effectiveness of Availability plus Size. This was measured with the mean of two items (α = 0.88) on a seven-point scale (1 = Strongly disagree, 7 = Strongly agree) (Adapted from Reynolds et al. (Reference Reynolds, Pilling and Marteau2018)): ‘Making these two changes in cafes and restaurants will reduce the number of calories that people eat’; and, ‘England's problem with people eating too many calories can be helped by making these two changes in cafes and restaurants’. See the OSF folder for the full questionnaire and materials.
Secondary outcomes
Perceived effectiveness of the policies individually. Each variable was measured with two items (Availability: α = 0.85 and Size: α = 0.86) on a seven-point scale (1 = Strongly disagree, 7 = Strongly agree) (Reynolds et al., Reference Reynolds, Pilling and Marteau2018): ‘[Replacing some higher calorie products with lower calorie products/reducing the portion size of some higher calorie products] in cafés and restaurants will reduce the number of calories that people eat’; and, ‘England's problem with people eating too many calories can be helped [replacing some higher calorie products with lower calorie products / reducing the portion size of some higher calorie products] in cafes and restaurants’.
Acceptability of policies. We define acceptability as how people think and feel about the implementation of a policy and consider it synonymous with public support (Sekhon et al., Reference Sekhon, Cartwright and Francis2017). Acceptability of the Availability plus Size policy, and the two policies individually was assessed using a single item on a seven-point scale (1 = Strongly oppose, 7 = Strongly support) for each (Reynolds et al., Reference Reynolds, Pilling and Marteau2018): ‘Do you support or oppose [making both of these two changes / replacing some higher calorie products with lower calorie alternatives / reducing the portion size of some higher calorie products] in cafes and restaurants?’.
Subjective comprehension of the intervention content. The subjective comprehension of the interventions was measured with two items (α = 0.89) on a seven-point scale (1 = Strongly disagree, 7 = Strongly agree) (Reynolds et al., Reference Reynolds, Pilling and Marteau2018): ‘I found the information about these two changes to be clear’; and, ‘I found the information about the two healthy eating changes easy to understand’.
Recall of the intervention content. The participants’ recall of the information provided in the infographics was assessed with two items that were adapted from a previous study (Reynolds et al., Reference Reynolds, Pilling and Marteau2018): ‘Below are seven changes that could be made in cafes and restaurants. Select two of these to show which were described at the beginning of this survey’ and ‘What was the effect of the two changes that were described?’. Each item had multiple-choice response options with seven possible options. There was a total of three possible correct answers from the two questions and recall was therefore was scored from 0 to 3.
Numeracy. Numeracy was assessed with a single item (Wright et al., Reference Wright, Whitwell, Takeichi, Hankins and Marteau2009). There are three response options of which one is the correct answer. This variable was converted to a dichotomous variable: high numeracy (correct answer) or low numeracy (incorrect answer).
Other outcomes
Demographic data were collected, including: age, gender, geographic region, educational attainment and ethnicity. Body mass index (BMI) was calculated from participants’ self-reported height and weight. See Supplementary Material C for the full questionnaire.
Analyses
Quantitative analyses
The main analyses used ordinary least squares regression to test the main effects of the experimental group on the primary and secondary outcomes. The exception was the recall outcome, which was analysed using ordered logistic regression as the recall outcome only has four discrete categories (scored 0–3 correct answers). Model diagnostics (residual plot, Normal p-p plot of residuals) showed that the regression modelling assumptions were satisfied. Continuous variables were examined to detect the presence of outliers (±3SDs from the median), however none were removed for the primary analyses as the 1–7 scales make it unlikely that any outlier is due to error. However, sensitivity analyses reported in Supplementary Material D re-ran the same models after removing outliers to determine if the main results are robust to the presence of outliers.
For any analysis involving the primary outcome we used the standard α = 0.05 threshold to determine statistical significance. However, for all analyses involving a secondary outcome we used a Bonferroni adjustment according to the total number of primary and secondary outcomes. With eight total outcomes, the threshold was set at α = 0.05/8 = 0.00625. Bayes factors were calculated for analyses involving the primary outcome (Morey & Rouder, Reference Morey and Rouder2018).
Qualitative analysis
An inductive thematic analysis was conducted on the responses (n = 249) to the open text box which had the instruction: ‘Do you have any further thoughts or comments that you would like to add?’. The analysis was conducted according to the methods laid out by Braun and Clarke (Reference Braun and Clarke2006). Two authors (AH and MV) generated initial codes and considered potential themes separately for 20% of the dataset. They then collaboratively discussed the codes ideas about potential themes. The purpose of this was to generate discussion about ideas for codes and themes. One researcher (AH) then performed all six steps of Braun and Clarke's thematic analysis phases in relation to the remaining 80% of the dataset, adapting and updating codes and themes originally discussed between the two authors, as well as generating new codes and themes as necessary.
Results
Communicating evidence of policy effectiveness
Communicating evidence of Availability plus Size effectiveness (four evidence groups combined vs control group) increased perceptions of the effectiveness of Availability plus Size for reducing energy intake, B = 0.19, 95% CIs [0.09–0.29], p < 0.001, d = 0.14 (see Table 1 for descriptive stats). This was supported by the Bayesian analysis, Bayes Factor (BF) = 60.5, which found very strong evidence in favour of the experimental hypothesis.
Table 1. Descriptive (mean [SD]) statistics by group

Note. The maximum possible recall score for the control group was two correct answers. The recall data represent count (percentage).
There was no evidence that communicating evidence of the effectiveness of the two interventions combined increased acceptability of the Availability plus Size policy after a Bonferroni adjustment (α = 0.006), B = 0.12, 95% CIs [0.01–0.20], p = 0.034, d = 0.08 (see Table 2 for full models).
Table 2. Regression models depicting the effect of communicating, visualising and re-expressing evidence of policy effectiveness on perceptions of effectiveness and acceptability of the policy

Note. The criterion for significance was 0.05 for the Primary outcome (Perceived effectiveness of Availability plus Size) and α = .006 for all other outcomes following a Bonferroni adjustment.
Visualising evidence of policy effectiveness
There was no evidence that visualising the information on policy effectiveness changed perceptions of effectiveness for the Availability plus Size policy, B = 0.02, 95% CIs [−0.06 to 0.11], p = 0.605, d = 0.02 (see Table 2 for full models). This was consistent with a Bayesian analysis, BF = 0.04, which found strong evidence in favour of the null hypothesis.
There was also no evidence that visualising the information on policy effectiveness changed the acceptability of the Availability plus Size policy, B = 0.08, 95% CIs [−0.02 to 0.18], p = 0.121, d = 0.05.
Visualising the evidence did not a have a significant effect on recall of the evidence content after Bonferroni adjustment (α = 0.006), OR = 0.85, 95% CIs [0.76 to 0.95], p = 0.007, however visualising the evidence reduced the subjective comprehension of the information, B = −0.11, 95% CIs [−0.18 to −0.05], p = 0.001, d = −0.11 (see Table 3 for full models).
Table 3. Regression models depicting the effect of visualising and re-expressing evidence of policy effectiveness on recall and comprehension of intervention content

Note. The Bonferroni-adjusted criterion for significance was α = 0.006.
Re-expressing evidence of policy effectiveness
There was no evidence that re-expressing the information on policy effectiveness changed perceptions of effectiveness for the Availability plus Size policy, B = −0.03, 95% CIs −0.11 to 0.06], p = 0.507, d = −0.02. This was supported by the Bayesian analysis, BF = 0.04, which found strong evidence in favour of the null hypothesis.
There was no evidence that re-expressing the information on policy effectiveness changed the acceptability of the Availability plus Size policy, B = 0.02, 95% CIs [−0.08 to 0.12], p = 0.674, d = 0.01.
There was no evidence that re-expressing the information on policy effectiveness changed recall of the evidence content, OR = 0.92, 95% CIs [0.83 to 1.02], p = 0.168, or changed the subjective comprehension of the information, B = 0.01, 95% CIs [−0.06 to 0.08], p = 0.814, d = 0.01.
Further outcomes
Each of the hypotheses regarding evidence communication, visualising, and re-expressing were also tested using the individual policies and are reported in Supplementary Material E. The results are similar but attenuated compared to the effects on the combined policy of Availability plus Size.
Interactions with numeracy
Further analyses were conducted to determine if visualising or re-expressing improved subjective comprehension and recall for people with lower numeracy. There was no evidence that this was the case as the interaction between numeracy and visualising the evidence did not have a significant association with subjective comprehension, B = −0.03, 95% CIs [−0.17 to 0.10], p = 0.622, or recall, OR = 1.00, 95% CIs [0.89 to 1.13], p = 0.981. There was also no evidence that the interaction between numeracy and re-expressing was related to subjective comprehension, B = 0.06, 95% CIs [−0.08 to 0.20], p = 0.379, or recall, OR = 0.95, 95% CIs [0.84 to 1.07], p = 0.687.
Baseline support
The results also show that a majority support the policies (see Figure 3). Among the control group, 74% supported reducing the portion size of some higher energy products in cafes and restaurants, 79% supported replacing some higher energy products with lower energy options and 71% supported implementing both policies together.
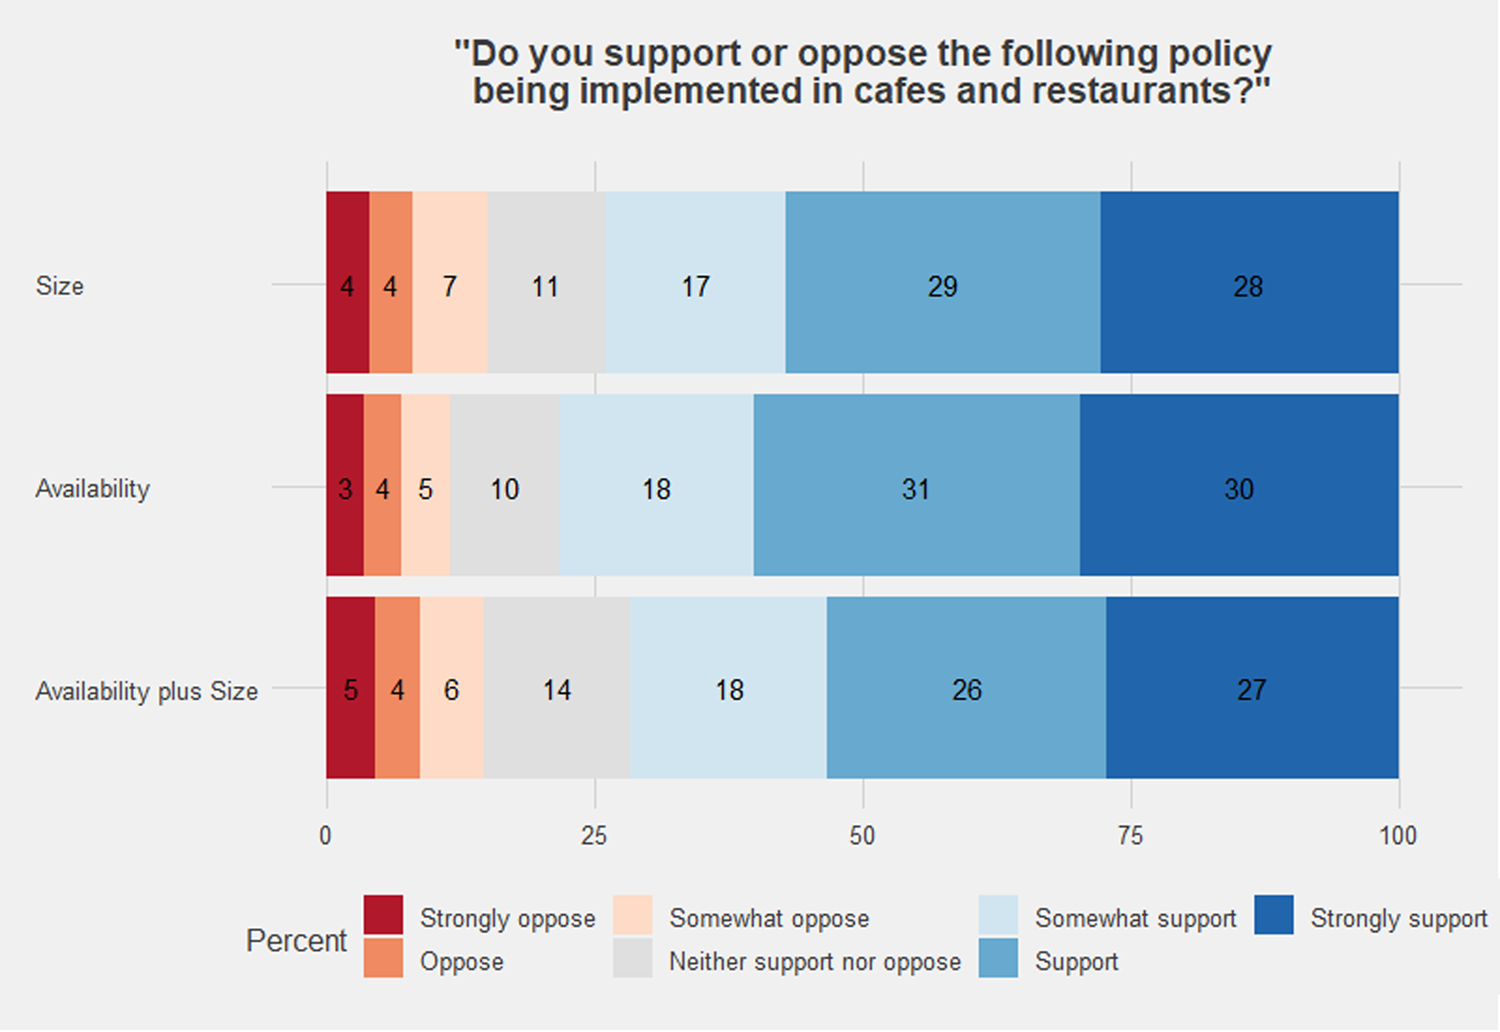
Figure 3. Support and opposition of each policy for the control group only. See Supplementary Material F for the full table containing the estimates and confidence intervals for these data.
Qualitative analysis
Four themes were identified in the qualitative analysis. See Box 1 for a summary of the themes and see Supplementary Material G for further analysis.
Box 1. Themes identified from a Thematic Analysis of open text responses. See Supplementary Material G for further analysis.
Four themes were identified:
1. Effectiveness: whether the Size and Availability interventions were perceived capable of reducing levels of obesity, and why.
‘These interventions, which are simple to implement, make a significant difference to the total calories that are consumed when eating out. This would lead to a major health gain for obese individuals’. (participant 3469, intervention 5)
‘I think encouraging healthier eating is the way forward as surely if portion sizes are reduced then people will just order more, which would be even worse for them’. (participant 535, intervention 5)
2. Acceptability: whether the Size and Availability interventions were supported or opposed, and why.
‘I look forward to hopefully seeing these new changes in cafes and restaurants in the future’. (participant 713, intervention 4)
‘Hope this proposal is abandoned’. (participant 235, intervention 3)
3. Presentation of information: whether the information presented during the study was accurate and well-presented.
‘I think that it is important to judge the equivalent calorie reduction based on hypothetical Mars bar consumption, which provides greater insight on the benefits of eating more responsibly’. (participant 3595; assert, quantify, visualise and re-express)
‘I thought the original info and graphics were too complicated, [sic] taking time to read it all and digest it’. (Participant 773; assert, quantify, visualise and re-express)
4. Other solutions for obesity: approaches to reducing obesity levels that participants deemed more effective and/or acceptable.
‘I don't believe that people can or should be forced to change their eating habits. The only way to change eating habits so they are “healthier” is by education and information/labelling’. (participant 1395; control group)
‘banning the sale of cola and the like to under 18 s would be more effective’ (participant 842; assert, quantify and re-express)
Discussion
The current study was a large population-based survey experiment that tested three hypotheses on the role of evidence communication at changing perceived policy effectiveness. The results suggest that asserting and quantifying evidence of policy effectiveness increases perceptions about the effectiveness of the policies. However, Bayesian analyses suggest that visualising and re-expressing the evidence confer no additional effect on perceived effectiveness or support for the policies. Furthermore, there was a decrease in subjective comprehension of the interventions when they were visualised (compared to text-only). The results of this study therefore suggest that while communicating evidence of policy effectiveness can be used to increase perceptions of effectiveness, visualising and re-expressing the information may confer no additional benefit.
The effect of evidence on perceived policy effectiveness supports the existing evidence from a range of domains (Reynolds et al., Reference Reynolds, Pilling and Marteau2018, Reference Reynolds, Archer, Pilling, Kenny, Hollands and Marteau2019a) but extends this to a novel and important policy context, namely interventions to reduce out-of-home consumption of food. These results, therefore, suggest that this effect generalises across a wide range of policies, interventions and populations. It also supports the results of a larger literature which demonstrates that some people – but not everyone – update their beliefs when given evidence that conflicts with their existing beliefs (for review, see Chan et al., Reference Chan, Jones, Hall Jamieson and Albarracín2017). In the present study, despite successfully changing the target belief, there was no statistically significant increase in support for the policies. However, there are at least two reasons to think that the result reported here is consistent with the recent systematic review that showed that communicating evidence of policy effectiveness increases policy support (Reynolds et al., Reference Reynolds, Stautz, Pilling, van der Linden and Marteau2020a). First, the effect size on support for the Availability plus Size policy in the current study was d = 0.08, a small effect that we were not powered to detect. However, this effect size was in the same direction as, and within the confidence intervals of, the meta-analysis: d = 0.11 95% CI [0.07–0.15]. Second, the effect in the current study was significant prior to applying a conservative Bonferroni adjustment. It therefore remains plausible that participants did increase their support for the policies in the current study, but the study was underpowered to detect this relatively small effect. This small and statistically non-significant effect could be partly explained by the relatively small increase in perceived effectiveness (d = 0.14) which was insufficient to reliably change attitudes. Changing people's prior beliefs using educational information such as in this study requires both that the participants are motivated for accuracy and believed that the evidence was credible (Druckman & McGrath, Reference Druckman and McGrath2019). If either of these two requirements were not commonly met in our sample, then this could account for the small degree of belief change, and thus the lack of a statistically significant effect on policy support.
Neither of the two methods of altering the evidence – visualising and re-expressing –improved any primary or secondary outcomes. Although much research in this field has used visuals or infographics in an attempt to influence policy beliefs and attitudes (Niederdeppe et al., Reference Niederdeppe, Roh and Dreisbach2016; Young et al., Reference Young, Hinnant and Leshner2016; Zhou & Niederdeppe, Reference Zhou and Niederdeppe2017; McGlynn & McGlone, Reference McGlynn and McGlone2018; Reynolds et al., Reference Reynolds, Pilling and Marteau2018, Reference Reynolds, Vasiljevic, Pilling, Hall, Ribisl and Marteau2020b), none have explicitly tested whether visualising evidence improves perceptions of policy effectiveness. The current study is therefore the first to provide evidence that visualising evidence does not change perceptions of effectiveness, at least within the context that the current study was conducted. This also supports some evidence that pie charts are no better than text alone at communicating information about the existence of climate change (van der Linden et al., Reference van der Linden, Leiserowitz, Feinberg and Maibach2014). While there is considerable evidence that visualisation has other benefits, such as improving attention and comprehension of the information (Lipkus, Reference Lipkus2007; Borkin et al., Reference Borkin, Vo, Bylinskii, Isola, Sunkavalli, Oliva and Pfister2013), in this case we found no effect on recall, and it diminished subjective comprehension. While there may be a common tacit expectation that visual images will benefit any communication – indeed, the concept of seeing is commonly conflated with that of knowledge (Jenks, Reference Jenks1995) – these results suggest that this should not be assumed and needs to be tested in any given context. A further consideration is that although visualisation did not confer any additional belief or attitude change here, in certain settings such as social media using images increases the number of people who will stop and read the content (Dudley, Reference Dudleyn.d.). Therefore by increasing attention, changes to beliefs could still be achieved.
The second method of altering the evidence – re-expressing – is a less common approach to framing evidence. In the current study, we re-expressed the policies’ effectiveness (11.5% reduction in calories consumed per day) in relation to a familiar food product that contains the same number of calories (76 Mars bars per year). The Bayesian analyses suggest that this re-expression did not affect perceptions of effectiveness, and there was also no evidence that the re-expression influenced policy support, comprehension or recall. While there is some evidence that similar re-expressions of calorie information – in the form of PACE labels – can change behaviour (Daley et al., Reference Daley, McGee, Bayliss, Coombe and Parretti2019), the current study suggests that re-expressing calories into food content is not similarly effective at changing any of the outcomes that were measured in the current study. While there is an open question about whether this approach could improve communication in other contexts, our results are consistent with there being no effect. The null effects of both visualising and re-expressing may in part reflect the high baseline level of perceived effectiveness and policy support that were observed in the control group (ranging from 5.24 to 5.61 on a 7-point scale). Due to these high baseline levels, it may not have been possible to generate detectable increases. It would be prudent for future research to focus on increasing support for policies deemed less effective and acceptable, such as taxes on less healthy foods or any meat reduction policies (Reynolds et al., Reference Reynolds, Archer, Pilling, Kenny, Hollands and Marteau2019b; Pechey et al., Reference Pechey, Reynolds, Cook, Marteau and Jebb2022).
Strength, limitations and future research
The current study recruited a large, nationally representative sample of the English population to investigate the effects of communicating evidence of policy effectiveness. The existing research suggested that evidence of policy effectiveness may increase perceptions of policy effectiveness and the current research confirms these findings and shows that this generalises to new policy domains. We also investigated two methods of improving evidence communication in the form of visualising the evidence and re-expressing the evidence. While the current study provides evidence in favour of a null effect for these two methods, it does so within the specific domain of healthy eating policies, and it is unclear how this would generalise to other policy domains. Furthermore, we used specific approaches of visualising and re-expressing information, and other approaches which could vary in format and content should be tested to confirm whether they are more or less effective. For example, this could include changing the visualisation of the results from a downward arrow to a bar graph that visualises energy consumed before and after the intervention. This could also involve changing the re-expression from Mars bars to a different product.
The infographics used in the current study were developed by the authors in collaboration with a graphic design company. Multiple iterations of the infographics were created, evaluated by the research team, other health researchers, and members of the public, and subsequently improved. Despite this process which aimed to generate a clear and effective means of communicating the policy effectiveness, the results showed that visualising the evidence lowered subjective comprehension, while not benefiting other key outcomes. The effect size was very small, but detectable. The qualitative analysis of comments did not shed further light on this as only one participant (out of 249 that provided comments) addressed this issue and suggested there was too much information to easily understand. Future research should investigate under what conditions evidence visualisation can be a useful communication tool. Future research could also investigate how to incorporate other messaging strategies to improve the communication of evidence of policy effectiveness. This could include combining evidence with narratives that describe how an intervention can change an individual's behaviour (Niederdeppe et al., Reference Niederdeppe, Shapiro and Porticella2011), including evidence of multiple benefits of the policy (Mantzari et al., Reference Mantzari, Reynolds, Jebb, Hollands, Pilling and Marteau2022), or altering the wording using linguistic agency assignment (i.e. assigning agency to either the threat or the person) (McGlynn & McGlone, Reference McGlynn and McGlone2018).
Policy implications
There was high support for replacing some high calorie products with lower calorie products in cafes and restaurants (79%), high support for reducing the portion size of some higher calorie products in cafes and restaurants (74%) and high support for implementing both of these policies together (71%). Support was higher than has been previously reported for Availability and Size policies. For example, reducing the portion size of sugar-sweetened beverages was supported by 60% (Petrescu et al., Reference Petrescu, Hollands, Couturier, Ng and Marteau2016) and reducing the portion size of high calorie snacks was supported by 57% (Reynolds et al., Reference Reynolds, Archer, Pilling, Kenny, Hollands and Marteau2019a) of UK samples. Support for restricting sales of high calorie snacks in local shops and reducing meat availability in cafeterias are supported by 33% and 52% of the public, respectively (Reisch et al., Reference Reisch, Sunstein and Gwozdz2017; Reynolds et al., Reference Reynolds, Archer, Pilling, Kenny, Hollands and Marteau2019a). The current study, therefore, suggests that Size and Availability interventions applied to high energy foods in out-of-home eating settings are particularly acceptable to the English public and therefore may be more politically viable than other applications of these interventions. The current study also suggests that communicating evidence of the effectiveness of these policies can increase perceptions of their effectiveness in the general public which may subsequently increase support for the policies beyond (relatively high) baseline levels. Ensuring that the policies are perceived as effective and maintaining high levels of public support is crucial to the implementation and continued existence of food policies that can meaningfully improve the population's diets (Cullerton et al., Reference Cullerton, Donnet, Lee and Gallegos2016, Reference Cullerton, Donnet, Lee and Gallegos2018).
Conclusion
The current study finds further evidence that communicating evidence of the effectiveness of a policy can increase perceptions of its effectiveness. While public support for the policies also increased in the predicted direction, the current study was not sufficiently powered to detect the effect. We found no evidence that visualising and re-expressing evidence added to the effect of simply reporting it in text form.
Supplementary material
To view supplementary material for this article, please visit https://doi.org/10.1017/bpp.2022.32.
Acknowledgements
This research was funded in whole, or in part, by the Wellcome Trust [ref: 206853/Z/17/Z]. For the purpose of Open Access, the author has applied a CC BY public copyright licence to any Author Accepted Manuscript version arising from this submission. The authors are grateful for comments on the protocol from Jonathon McPhetres and Matthew Goldberg.


 Open access