


The prevalence of obesity was estimated as 36·5 % among US adults in 2011–2014( Reference Ogden, Carroll and Fryar 1 ). Obesity continues to be a significant public health problem in the USA due to the associated co-morbidities and complications. As such, the wide range of associated co-morbidities includes several chronic diseases such as type 2 diabetes, metabolic syndrome, CVD, sleep apnoea, arthritis and some types of cancers( Reference Guh, Zhang and Bansback 2 ). Although obesity is a multifactorial disease with modifiable and non-modifiable risk factors, a large body of literature documents that environmental factors, behavioural modification and a healthy lifestyle play a significant role in the prevention or reduction of obesity( Reference Schroer, Haupt and Pieper 3 – Reference Regev-Tobias, Reifen and Endevelt 11 ). Therefore, the primary interventions that are considered beneficial encompass health education, counselling and behaviour modification, to raise awareness to the negative consequences of obesity and to promote the development of healthy lifestyle programmes. Furthermore, legislation at the state and federal levels, including the Affordable Care Act, provides incentives to promote healthy work environments and encourages participation in wellness programmes to improve health and reduce health-care spending( 12 ).
Several studies have shown that increased consumption of vegetables and fruits, as well as intake of whole grains, are positively associated with reducing obesity and CVD( Reference Hayden 13 – Reference Boeing, Bechthold and Bub 16 ). Nevertheless, the Centers for Disease Control and Prevention’s State Indicator Report on Fruits and Vegetables 2013 reveals that the US national median intake of vegetables and fruits in adults is 1·6 and 1·1 times/d, respectively. Moreover, in adolescents, the median intake of vegetables and fruits is 1·3 and 1·0 times/d, respectively( 17 , 18 ). These values are lower than the recommendations of the 2015–2020 Dietary Guidelines for Americans (2015–2020 DGA) which are consumption of 3–4 servings of vegetables and 2–2·5 servings of fruits daily for adult males, and 2·5–4 servings of vegetables and 2–2·5 servings of fruits daily for adolescent males( 19 ).
The availability of workplace wellness programmes is of crucial importance for both organizations’ corporate cost–benefit and employees’ well-being and attaining healthy lifestyles( Reference Schroer, Haupt and Pieper 3 , Reference Chapman 20 , Reference Mills, Kessler and Cooper 21 ). Employees spend most of their day at the workplace; thus the work environment is a suitable setting to promote healthy lifestyles and encourage employees to seek health screenings. The introduction of wellness and health promotion programmes is significantly associated with improving employees’ health, work performance and productivity and decreased health-care costs( Reference Schroer, Haupt and Pieper 3 , Reference Chapman 20 , Reference Mills, Kessler and Cooper 21 ). In this regard, various wellness programmes, including dietary education, counselling and physical activity promotion, are offered at the workplace. These programmes prioritize behaviour modification as a tool to achieve dietary change and promote healthy lifestyles for participants( Reference Schroer, Haupt and Pieper 3 , Reference Beresford, Locke and Bishop 22 ).
Furthermore, a well-designed evaluation of employer-based programmes is crucial for several reasons: (i) evaluation provides valuable information to the employers and wellness programme coordinators regarding the effectiveness of the programme in improving the health and well-being of employees; (ii) evaluation helps to improve the design and implementation strategies of the programme according to the clients’ specific needs; (iii) it yields scientific evidence of the impact of the wellness programme on worker productivity and performance; and (iv) programme evaluation can inform and shape future wellness policies in the workplace. Therefore, the present study was undertaken to determine the effectiveness of such programmes in improving health behaviour and health indicators. Workplace wellness programmes offer great opportunities to empower employees to establish and maintain a balanced and healthy lifestyle.
In the present study, we evaluated the effectiveness of a wellness programme on employees’ eating behaviours towards health-oriented dietary change, such as increasing intakes of fruits, vegetables, whole grains and dairy, as well as decreasing intakes of saturated fat and sugar-sweetened beverages. As a framework, the predictive model used for the study was the Health Belief Model and the Transtheoretical Model (Stages of Change) was employed in constructing the nutrition counselling and evaluation of the health behaviour change( Reference Glanz, Rimer and Viswanath 23 , Reference Becker 24 ). Similar programmes have achieved success in inducing dietary change at the workplace( Reference Perez, Phillips and Cornell 25 ). Based on longitudinal data (2004–2013) from a Nebraska-based employee wellness programme, we compared participants’ choices of food groups (fruits, vegetables, whole grains, protein, dairy) between the first and the last year they participated in the wellness programme. We also determined the correlations between intakes of fruits, vegetables, grains, dairy and health indicators, namely BMI, cholesterol and TAG levels. Findings from this work are important as they provide evidence of the effectiveness of a wellness programme model in the workplace as well as lending value to the development of a sustainable, personalized programme. The basic components of the wellness programme are adaptable to dissemination in the context of the interdisciplinary approach to health and wellness.
Methods
Data source and study sample
The present study used secondary data collected from a workplace wellness programme offered by a personalized health-care management company, SimplyWell LLC (Omaha, NE, USA)( Reference Ly, Chan and Aarabi 26 ). The physician-operated programme encompassed both onsite as well as online components. The total participants were 22 885 employees from more than 100 organizations who participated in the wellness programme between years 2004 and 2013. The employees’ organizations included health-care sectors, marketing, businesses, factory workers, agriculture and information technology.
In the current study we investigated a cohort of participants who completed the wellness programme for three years, with a sample size of 16 153 out of the total 22 885 employees enrolled. The data were further streamlined to include only those participants who completed three consecutive years in the wellness programme between years 2004 and 2013 (n 12 636). We selected this cohort to determine the impact of adherence to the wellness programme and the value of maintenance for three consecutive years on the dietary changes and the correlation of such changes with health indicators. The exclusion criteria included any participants with less than three consecutive years in the programme. The rationale for including only those who completed three consecutive years was to address the importance of sustainability of the dietary behaviour and to determine the impact of commitment to a healthy lifestyle over time on people’s health outcomes. It is commonly known that people can lose weight and be healthy for a defined period. However, weight loss maintenance is always hard to achieve. Thus, our study design was to select people who sustained and maintained a healthy schedule to determine how this healthy behaviour was sustainable. All data were de-identified from existing Simplywell LLC data sets before analysis. The programme included onsite health screening and tailored the education programme based on identified health risk. The wellness services included nutrition education, health coaching and counselling programmes targeting behaviour modification and promoting healthy lifestyles. The programmes were tailored based on data from the annual health screening indicators such as blood cholesterol, TAG and cholesterol, as well as BMI. The Institutional Review Board determined that the study does not constitute human subjects research as defined at 45CFR46-102.
Wellness programme
The SimplyWell programme is a centralized, Nebraska-based, wellness, lifestyle balance and integrated health programme in a collaborative partnership with employers and organizations to support individuals in their quest to adopt a healthier lifestyle. The SimplyWell programme is designed to provide an integrated personalized plan to reduce health risk and promote a balanced and healthy lifestyle. The programme is administered via a web-based, user-friendly portal. The components of the programme include a regular health screening scheduling tool (annually or every six months), a health and risk assessment tool, a comprehensive health questionnaire and healthy living resources. Health information is available on the portal that allows the participants to select the topics that best meet their needs. The healthy resources include nutritious recipes and exercise tips, educational health modules, health maintenance self-tracking in addition to integrating wearable health and physical activity apps. The programme offers onsite health screenings administered by health and wellness professionals and evidence-based health coaching practices. Together, the health coaches and individuals engage and identify health risks, and develop goals and self-motivation aspects towards achieving change in health behaviour and adopting a healthier lifestyle. As an incentive, personalized health reports can be generated to keep track of the health-related outcomes.
Assessment of the health risk questionnaire
The individual’s health information was collected through a secure, self-reported, web-based health risk questionnaire (the Employee Health Risk Questionnaire). The health risk questionnaire comprised questions regarding personal history data, exercise, physical activity status, dietary intake, alcohol consumption, smoking, stress and feelings, job description, women’s health and doctor visits, in addition to demographic data. The programme allowed participants to navigate the health questionnaire, health screening, wellness events, health trackers and education modules. By completing the assigned tasks, the participants earned incentive points based on the activity fulfilled.
The participants completed a web-based health risk questionnaire every year of participation. The survey questions included the number of servings on a Likert-type scale from 1 to 5, where 1=0 serving and 5=5+servings.
Outcome measures
Dietary intake
In the present study, we dichotomized analysis of the self-reported variables regarding the intake of food groups (grains, fruits, vegetables, protein, dairy), discretionary energy from fat and added sugar, and following the dietary guideline recommendations. Adherence to the dietary guideline recommendations was assessed based on participants’ self-reported intakes of grains, protein, fruits, vegetables (including dark green leafy vegetables) and dairy (Table 1). Table 1 describes how we coded and dichotomized the variables. As such, low intake of grains, protein or dairy was considered if the response on the survey was 0–2, while low intake for fruits and vegetables was considered if the response was 0–1.
Table 1 Description of the variables used for analysis of the Employee Health Risk Questionnaires
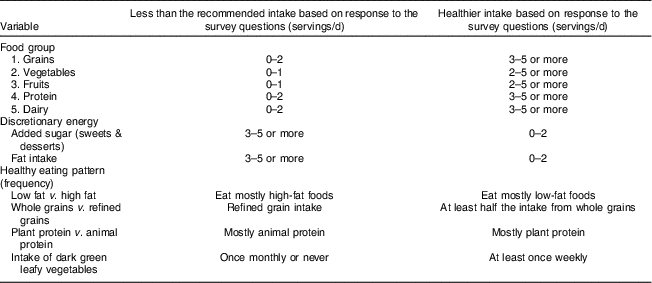
Grain intake was quantified on a 5-point Likert scale (1=‘nearly always eat refined grains’, 2=‘mostly refined grains’, 3=‘same amount of refined and whole grains’, 4=‘eat primarily whole grains’, 5=‘eat only whole grains’). The participants were given information about quantities of grains as defined in the 2015–2020 DGA and the Healthy Eating Index to help them to identify the correct portion and serving size to self-report in the survey( 19 , 27 ).
Examples of animal protein were provided to facilitate the selection of the accurate food items (meat, poultry, fish, cheese and eggs), as were examples of plant protein (legumes such as lentils, peas and beans, soyabeans, nuts and vegetarian burgers). Participants were asked to rate their intake of protein on a 5-point Likert scale (1=‘nearly always eat animal protein’, 2=‘eat mostly animal protein’, 3=‘eat the same amount of animal and plant protein’, 4=‘eat primarily plant protein’, 5=‘eat only plant protein’) and to record their rating in the survey.
Intake of vegetables as one cup of raw or half a cup of cooked vegetables was counted as one serving. Additionally, intake of dark green leafy vegetables such as spinach, kale, broccoli, turnips and collards was quantified as 1=‘5 or more times per week’, 2=‘2–4 times per week’, 3=‘1 time per week’, 4=‘1–3 times per month’ and 5=‘seldom or never’. For the intake of fruits, one serving was quantified as one medium apple, orange or banana, or half a cup of cooked fruit. The participants were given a choice to indicate their fruit intake on the same 5-point Likert scale as for vegetable intake.
Consumption of fat servings was quantified on a 5-point Likert scale (1=‘nearly always eat high-fat food’, 2=‘eat mostly high-fat food’, 3=‘eat the same amount of high-fat and low-fat food’, 4=‘eat primarily low-fat food’, 5=‘eat only low-fat food’).
Health indicator variables
Onsite health screening data included measurements of participants’ height (in centimetres) and weight (in kilograms) by trained personnel using standard protocols. BMI was calculated based on the formula weight/height2 (kg/m2). Laboratory blood analysis included blood glucose, total cholesterol, LDL-cholesterol, HDL-cholesterol and TAG levels. Once the participants enrolled in the SimplyWell programme, these health indicators were measured annually to construct a wellness profile and to personalize the associated education and counselling modules.
Demographic data
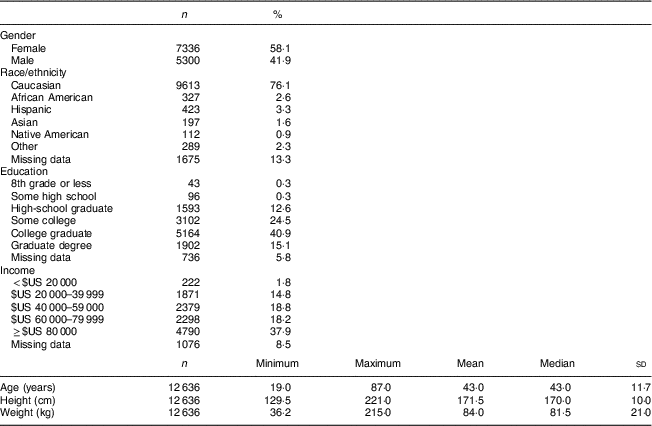
The participants completed a web-based questionnaire which included the demographic parameters shown in Table 2. The demographic data encompassed the following variables: self-reported age (years); ethnicity/race (Native American, Asian, African American, Caucasian, Hispanic, Other); medical history; family income (<$US 20 000, $US 20 000–39 999, $US 40 000–59 000, $US 60 000–79 999, ≥$US 80 000); education level (8th grade, high school, some college, college graduate, graduate degree); and smoking.
Table 2 Demographic characteristics of the study participants: employees (n 12 636) who participated in a workplace wellness programme intervention for three consecutive years during years 2004 to 2013, Midwest USA
Statistical analysis
Pearson correlations were computed for paired food and health measurements. Significance was determined at a two-sided P<0·01 as a measure of type 1 error. Responses from the Likert scales were recoded into two levels (e.g. low intake or improved intake) and evaluated with McNemar’s test to estimate the percentage of respondents who changed behaviour from the first to the third year. Statistical analyses were conducted using the statistical software package SAS/STAT version 9.4 (© 2002–2012).
Results
The Employee Health Risk Questionnaire used in the present study encompassed data regarding the consumption of food groups, intake of discretionary energy, as well as a healthy eating pattern, as shown in Table 1. To facilitate the analysis, we dichotomized the data into two sets of responses to the survey: as either ‘healthier intake’ or ‘less than the recommended intake’ of the food group items (Table 1). The term ‘healthier’ was used to indicate that dietary intake is meeting the 2015–2020 DGA recommendations to increase intakes for fruits, vegetables and whole grains, and limit intake of discretionary energy from added sugar and saturated fat, as part of a healthy eating pattern. Healthier dietary intake was coded if the response to the survey was ≥3 servings/d for grains, protein or dairy, or ≥2 servings/d for fruits or vegetables. Less than the recommended dietary intake was coded if the participants’ response to the survey questions was 0–2 servings/d for grains, protein or dairy, or 0–1 serving/d for fruits or vegetables (Table 1).
For the intake of discretionary energy, participants’ healthier dietary intakes were coded as 0–2 servings/d for added sugar in sweets and desserts as well as for solid fat. Less than the recommended intakes were noted if the respondents indicated intakes of 3–5 or more servings/d. The healthy eating pattern designation was based on 2015–2020 DGA and Healthy Eating Index scoring. In this manner, eating mostly low-fat foods (4–5 servings/d), consuming at least half of grain intake as whole grains (3–5 servings/d), consuming mostly plant protein (4–5 servings/d) and intake of dark green leafy vegetables at least once weekly were considered part of a healthy eating pattern. The less than recommended consumption was coded if the survey response was eating mainly high-fat foods, refined grains or mostly animal protein, or once monthly or never intake of dark green leafy vegetables (Table 1).
Table 3 presents the participants’ behavioural changes in consumption of the five food groups, namely grains, vegetables, fruits, dairy and protein. Participants showed improved intake of two of these five food groups, mainly intakes of vegetables and fruits. More specifically, the percentage of employees who increased their consumption of fruits (16·88 %) was significantly greater than the percentage who decreased their intake (12·08 %, P<0·001). Additionally, the percentage of participants who showed a healthy behavioural change in vegetable intake (15·20 %) was significantly greater than the percentage of participants who showed a less healthy intake change (11·44 %, P<0·001). Behavioural changes of participants regarding food groups that are known to be healthier dietary choices included the following: intakes of whole grains, plant protein, dark green leafy vegetables and low-fat foods. All these four healthier food choices showed significant increases in behavioural changes. Paired data analysis of 12 343 participants revealed that 69·28 % of participants had a consistently high intake of dark green leafy vegetables in both the first- and third-year surveys (Table 3). Additionally, the percentage of participants who increased their consumption of dark green leafy vegetables (12·03 %) was also significantly greater than those who decreased their intake (7·27 %, P<0·001). There was a slight decrease in the percentage of participants who had improved intake of grains as a food group (5·31 v. 6·23 %, P<0·001). However, the percentage of participants who increased their intake of whole grains (12·17 %) was significantly greater than the percentage of participants who consumed mainly refined grains (8·37 %, P<0·001). Along the same line, the percentage of participants who changed their behaviour from consuming high-fat foods to low-fat foods was significantly higher than the percentage who changed to undesirable consumption of high-fat foods (15·46 v. 10·05 %).
Table 3 Effects of programme completion on intake of food groups among employees (n 12 636) who participated in a workplace wellness programme intervention for three consecutive years during years 2004 to 2013, Midwest USA
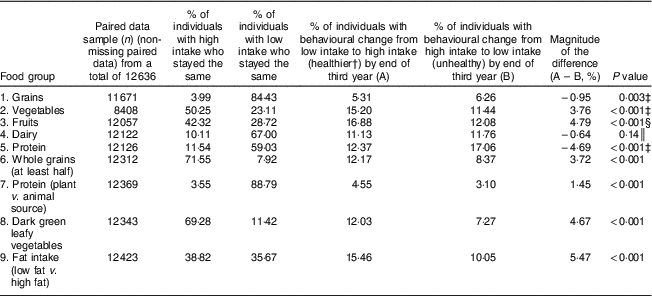
Workplace wellness health risk questionnaires were collected from employees who participated in Nebraska-based workplace wellness programmes across several organizations for three consecutive years during 2004 to 2013. Consumption of food groups was quantified as servings/d in the health risk questionnaires. Differences between participants who changed behaviour from unhealthy to healthy v. participants who changed behaviour from healthy to unhealthy were calculated using McNemar’s test to compute the P values for the paired data. Significance was determined at P<0·05.
† The term ‘healthier’ is used to indicate that the dietary intake is following the recommendations of the 2015–2020 Dietary Guidelines for Americans to increase intakes for fruit, vegetables and whole grains, and limit intakes of added sugar and saturated fat, as part of a healthy eating pattern.
‡ Significance was maintained (P<0·01 to 0·03) for intake of grains, vegetables and protein after adjusting for age, income and education level.
§ Regarding fruit intake, significance was maintained (P<0·01) for gender and education but was non-significant when adjusted for income (P=0·37).
║ Intake of dairy remained non-significant after adjusting for gender (P=0·08) but was significant for education level (P<0·01) and income (P=0·01).
To minimize the effects of confounders, the data in Table 3 were adjusted using education level, gender, family income and BMI as covariates, and showed the same outcome. Significance was maintained at P<0·01 to 0·03 for intake of grains, vegetables and protein after adjusting for age, income and education level. Regarding fruit intake, significance was maintained at P<0·01 for gender and education but was non-significant when adjusted for income (P=0·37). Intake of dairy remained non-significant after adjusting for gender (P=0·08) but was significant for education level (P<0·01) and income (P=0·01). For BMI, significance at 0·01 level was maintained for intakes of fruits, dairy, protein, grains, plant protein, dark green leafy vegetables, low-fat foods, and sweets and desserts.
To determine the association of the favourable changes in eating behaviour on health indicators and outcomes, we performed correlation analysis between food groups, discretionary energy and healthy eating pattern with BMI, cholesterol and TAG (Table 4). There was a significant negative correlation between consumption of grains (−0·032, P<0·001), dairy (−0·033, P<0·001), vegetables (−0·057, P<0·001) and fruits (−0·071, P<0·001) and BMI at the third-year follow-up as determined by Pearson correlation analysis (Table 4). Consumption of protein (0·037, P<0·001) was found to be positively associated with BMI at the third year. A similar outcome was observed when participants limited their intake of discretionary energy from added sugar and fat. These participants displayed a healthy eating pattern including intake of low-fat foods, increased intake of whole grains, and high dark green leafy vegetable intake. The correlation coefficients were the highest for low fat intake v. high fat intake (−0·199, P<0·001). However, consumption of protein was found to be positively associated with BMI over the course of the three years (0·037, P<0·001).
Table 4 Correlation between food groups, healthy eating pattern and BMI, cholesterol and TAG levels at the third year among employees (n 12 636) who participated in a workplace wellness programme intervention for three consecutive years during years 2004 to 2013, Midwest USA
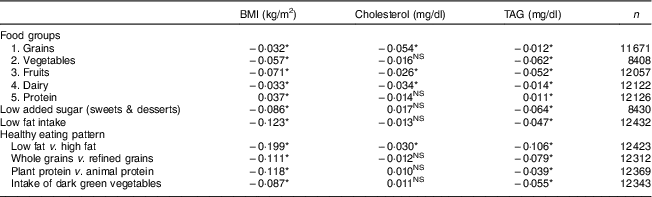
Workplace wellness health risk questionnaires were collected from employees who participated in Nebraska-based workplace wellness programmes across several organizations for three consecutive years during 2004 to 2013. Consumption of food groups was quantified as servings/d in the questionnaires. Pearson’s correlation test was used to compute the P values for the paired data (non-missing pairs). Significance was determined at P<0·001.
*P<0·001.
All food groups, food choices for limiting energy and foods for a healthy eating pattern were negatively correlated to BMI and TAG. The exception was protein, which was not significantly correlated with cholesterol levels in the third year. Indicators of chronic heart diseases such as cholesterol were also negatively correlated with the intakes of grains, fruits and low-fat foods. Interestingly, vegetable intake was not significantly correlated with cholesterol level. Other food choices regarding discretionary energy and healthy eating pattern showed inconsistent results. TAG levels were also negatively correlated to the intake of grains (−0·012, P<0·001), vegetables (−0·062, P<0·001), fruit (−0·052, P<0·001) and dairy (−0·014, P<0·001), as well as low consumption of added sugar (−0·064, P<0·001) and fat (−0·047, P<0·001). Moreover, TAG levels were negatively correlated with intake of low-fat v. high-fat foods (−0·106, P<0·001), intake of whole v. refined grains (−0·079, P<0·001), intake of plant v. animal protein (−0·039, P<0·001) and high consumption of dark green leafy vegetables (−0·055, P<0·001), as shown in Table 4.
Discussion
The Healthy People 2020 goals( 28 ) include worksite wellness objectives and encourage work establishments to institute committees to promote and implement wellness programmes. The Final Rule (Federal Register 2013) made participation in wellness programmes available regardless of an individual’s medical history or health status. Due to the increased incidence of chronic disease, which is associated with increased health-care costs, several employers have initiated wellness programmes in the workplace for their employees. These wellness programmes include screening for health indicators, wellness questionnaires, individualized wellness coaching and annual physical examinations. The current study aimed to evaluate a worksite wellness programme and determine the impact on dietary choices for participants who completed three consecutive years in the programme.
We used the Employee Health Risk Questionnaire to collect data regarding consumption of the food groups and discretionary energy. The questionnaire was also used to inquire about the intake of low-fat dairy, whole grains, dark green leafy vegetables and plant protein as indicators of a healthy eating pattern, as informed by the 2015–2020 DGA and as shown in Table 1. The demographic data revealed a workforce comprised of 58·1 % females and 41·9 % males. Their mean age was 43 (sd 22·7) years and their mean BMI was 28·6 (sd 6·5) kg/m2. Analysis of the first- and third-year surveys revealed that 50·25 % of employees had an improved intake of vegetables, and an additional 15·20 % changed their behaviour towards a healthy increase in vegetables; compared with only 11·44 % who changed behaviour to an unhealthy, decreased intake outcome (Table 3). Similarly, intake of fruits followed a similar pattern with 16·88 % of employees adopting a favourable behaviour of including two or more servings of fruit daily compared with 12·08 % who changed to undesirable eating behaviour. Conversely, the unfavourable change in the behaviour of participants towards the intake of grain, dairy and protein was significantly higher than in those employees who increased servings of grains, dairy and protein. We speculate that improvement of participants’ consumption of vegetables and fruits only, but not dairy, grains and protein, occurred because of the following reasons. First, the wellness programme emphasizes fruits and vegetables rather than the other three food groups. Second, fruits and vegetables are possibly more flexible options to change than other food groups and can be consumed uncooked, thus being more readily accessible. Third, there is a general trend of decreasing intakes of grain, dairy and protein but increasing intakes of fruits and vegetables. These findings are in agreement with a study by Perez et al., who found increased fruit and vegetable consumption due to a wellness programme for state health employees in Arkansas( Reference Becker 24 ).
Our wellness programme also had a positive impact on changing behaviour towards intake of plant protein: 4·55 % of participants increased the number of servings of plant protein compared with 3·10 % who changed behaviour towards more consumption of animal protein (Table 3). A similar pattern was observed regarding consumption of half of grain intake from whole grains (12·17 v. 8·37 %, P<0·001), dark leafy vegetables (12·03 v. 7·27 %, P<0·001) and low fat consumption (15·46 v. 10·05 %, P<0·001; Table 3). When encouraging a dietary protein change to prevent high sodium intakes, Landry et al. cautioned that they found meat (animal protein) and bean (plant protein) preparations often included higher amounts of salt in these recipes. These authors suggested that it may be more appropriate to advocate for decreased intake of discretionary energy v. a variety of dietary food groups to improve diet, as their study resulted in a positive effect on the intake of other dietary food groups when discretionary energy was targeted. Additionally, sodium intake may increase with consumption of low-fat dairy foods because they typically contain higher salt content in an attempt to mimic the fat ‘texture’ in higher-fat dairy foods( Reference Landry, Thomson and Huye 29 ).
To determine the effectiveness of the workplace wellness programme intervention on improving health indicators, we conducted Pearson correlation analysis of the impact of the changed dietary intakes on BMI, cholesterol and TAG. Our data showed that BMI was negatively correlated with consumption of grains, vegetables, fruits and dairy, and with decreased intake of sugar and fat (Table 4). These data suggest that consumption of low-fat foods, whole grains, dark green leafy vegetables and plant protein is associated with lower energy intake, as evidenced by decreased BMI and blood lipid profile including TAG levels. Similarly, Lemon et al. reported that participation in a worksite wellness programme for employees of Massachusetts public high schools led to decreased BMI: a decrease of 0·48 kg/m2 ( Reference Lemon, Wang and Wedick 30 ). Lemon et al.’s programme included healthy lunch options, a reduction of soda available to teachers, healthy food sampling and other wellness activities. However, Linde et al.( Reference Linde, Nygaard and MacLehose 31 ) did not find a reduction in BMI in their programme, which focused on environmental factors similar to our SimplyWell study including the promotion or increased intake of fruits and vegetables and decreased intake of foods high in fat. This is possibly due to differences in the study design and length of follow-up. Our results also revealed negative correlations between the participants’ intakes of fruits, grains, dairy and healthy eating pattern, and health indicators such as BMI, cholesterol and TAG (Table 4). Based on our findings, we provide evidence-based recommendations for employees and their families to participate in employer-sponsored wellness programmes to help achieve a healthy lifestyle.
The strengths of the present study include large sample size, follow-up for several years, multiple institution participation, medical assessment for participants, follow-up on health care, personalized nutrition counselling and accessibility of the wellness programme. The large sample size was a strength that enabled us to verify the impact of counselling on improved consumption of healthy options and decreased intake of discretionary energy. Limitations of the study include lack of control variables, such as participant demographics and socio-economic status, as well as classification of the employees according to the type of work performed (e.g. office v. farm workers). Although we followed a cohort for three consecutive years, some of these behavioural changes require a longer time frame to assess long-term sustainability and maintenance. Additionally, the dietary intake was based on self-reported data, which are subject to recall bias and the possibility of under-reporting and underestimating portion sizes( Reference Gemming, Jiang and Swinburn 32 ). Another limitation is the lack of a control group to accurately assess the impact of the wellness programme on changes in dietary behaviour. Therefore, findings from the present study apply to individuals who chose to participate in the wellness programme. It would be worthwhile to address the barriers that prevent others from engaging and participating in the wellness programme. It is possible that other confounders, such as changes in community resources, could have influenced the overall increases in fruit and vegetable consumption.
The significance of our study is that it provides a model for a successful wellness programme in the workplace that could be tailored to a specific client. As noted earlier, a well-designed evaluation of the employer-based programme is crucial for the wellness of employees. While several organizations have instituted wellness programmes in the workplace, these programmes have not been fully evaluated yet( Reference Smith, Visram and O’Malley 33 ). As such, our evaluation programme provides valuable information to the employers and wellness programme regarding the effectiveness of such a programme in improving health and well-being of employees. The dissemination of the wellness programme may help to improve the design and implementation strategies and tailor them to the clients’ specific needs. Furthermore, these findings provide scientific evidence of the impact of the wellness programme and, as such, can inform and shape future wellness policies in the workplace.
In summary, our data indicate that the wellness programme had a positive impact on increasing the number of participants who select healthier food choices, including increased intakes of vegetables, fruits and whole grains. The data also indicate that intakes of fruits, vegetables, grains, dairy and the healthy eating pattern were correlated with improved health indicators such as BMI, cholesterol and TAG in the third-year follow-up of the programme. Future directions will include follow-up with individuals who participated in the wellness programme for additional years beyond the three consecutive years to determine the sustainability of the outcome measures.
Acknowledgements
Acknowledgements: Wellness data SAS files of SimplyWell were supplied by J.C. Financial support: This research received no specific grant from any funding agency in the public, commercial or not-for-profit sectors. Conflict of interest: G.A.S., J.K., J.-M.L., R.H., S.H., Y.K. and N.K.W. have no conflict of interest. J.C. is the Founder and President of SimplyWell LLC, as well as a Board Member. Authorship: J.C provided Wellness data of SimplyWell. All authors contributed ideas and suggestions to the study design and data analysis. R.H. performed the statistical analyses. G.A.S. wrote the first draft of the manuscript. J.K., J.-M.L., R.H., S.H., Y.K., N.K.W. and S.W. revised the manuscript. Ethics of human subject participation: The Institutional Review Board at the University of Nebraska Medical Center determined that the study does not constitute human subjects research as defined at 45CFR46-102.


