Causing more than 8·9 million fractures worldwide every year and responsible for 5·8 million disability-adjusted life years lost annually, osteoporosis takes an enormous economic toll on individuals and healthcare systems alike(Reference Johnell and Kanis1). Major economic and demographic transitions in Asia have increased the incidence of osteoporosis in this region by two- to threefold over the past 30 years(Reference Mithal, Dhingra and Lau2), prompting rapidly growing public health concern. It is estimated that by 2050, half of the fractures worldwide will occur in Asia(Reference Cooper, Campion and Melton3), accounting for 25 billion USD healthcare costs in China alone(Reference Si, Winzenberg and Jiang4).
At the same time, individuals living with HIV are among vulnerable populations that are of particular concern for developing bone disease. Multiple studies in different countries have found that they experience decreased bone mineral density independent of sex, age and comorbidities(Reference Güerri-Fernandez, Vestergaard and Carbonell5–Reference Yin, Dobkin and Brudney9). These patients may have higher rates of traditional osteoporosis risk factors, including tobacco and alcohol use, chronic inflammatory state, increased basal metabolism, and weight loss(Reference Powderly10). Additionally, it has been suggested that viral infection itself and exposure to antiretroviral treatment (ART) potentially alter bone metabolism and directly contribute to the pathogenesis(Reference Mallon11). HIV-infected individuals are 3·7 times more likely to develop osteoporosis relative to HIV-negative individuals, and those on protease inhibitors as part of ART have an additional 1·6-fold risk of osteoporosis compared to those receiving other therapies(Reference Brown and Qaqish12). Furthermore, increased effectiveness and accessibility of ART has transformed HIV from an acute, life-threatening condition to one with near-normal life expectancy in many parts of the world(Reference Brown and Qaqish12). As a result, people living with HIV represent a high-risk subpopulation for bone disease that is growing in number and increasingly reaching old age.
Adequate intake of Ca and vitamin D attenuates the risks of developing bone disease(Reference Rizzoli13), with dietary Ca providing greater benefits for bone building and maintenance than supplemental Ca(Reference Booth and Camacho14). Though individuals living with HIV do not necessarily have different dietary habits than the general population, they remain marginalized members in many societies with limited social support and lower socio-economic status(Reference Anema, Fielden and Castleman15), for whom food sufficiency and quality are much more challenging to achieve. In addition, patients with HIV may not be aware of their increased risk for bone disease as public health messages regarding osteoporosis and fracture prevention often focus on traditional risk groups such as post-menopausal women. As a result, it is important for providers to understand their patients’ dietary Ca intake status in outpatient HIV care. While multiple elaborate dietary Ca intake assessment instruments are available(Reference Magkos, Manios and Babaroutsi16–Reference Vernia, Loizos and Di Giuseppantonio18), they serve poorly under the context of everyday clinical screening, which often needs to incorporate the Ca intake screening questions into a longer questionnaire surveying multiple risk factors. The few Ca intake screening tools available in the literature are based on specific food items(Reference Vernia, Loizos and Di Giuseppantonio18–Reference Blalock, Norton and Patel21), prohibiting cross-cultural comparisons.
To address this gap, we sought to examine the validity and reproducibility of a six-item dietary Ca screening tool (the six-item tool), previously developed as part of a study that explored behavioural risk factors for osteoporosis prevention in a group of Chinese individuals living with HIV(Reference Hsieh, Fraenkel and Bradley22). The tool was designed to elicit frequency of consumption of Ca- and vitamin-D-rich food categories with example food items easily modified to tailor different dietary habits. China serves as an ideal setting for this screening validation as it has a growing number of people living with HIV and receiving ART due to rapidly increasing access to treatment in recent years(23). Despite prior studies reporting varying, yet consistently insufficient levels of daily Ca intakes(Reference Fang, Li and Shi24–Reference Zhuang, Yuan and Lin26) among the general population, comprehensive prevention programmes for long-term comorbidities of HIV, particularly osteoporosis, remains scarce in this country(Reference Carter27). A validated brief dietary Ca screening tool can serve as an effective screening instrument to identify individuals with low dietary Ca intake within the context of the Chinese diet. Convenient to use in an outpatient setting, it can help prompt timely referral for further nutritional evaluation and in turn facilitate the understanding of the role of Ca and vitamin D intake in bone health among individuals living with HIV.
Methods
Study design and sampling
We conducted a validation study of the six-item tool among a cohort of Chinese individuals with HIV in Beijing and Shenzhen, China. The study cohort was recruited from patients presenting to the HIV/AIDS Centers in Peking Union Medical College Hospital (PUMCH), Beijing, China and Shenzhen Third People’s Hospital (STPH), Shenzhen, China. All eligible patients were invited to participate in the study by their provider or nurse case manager during their regular follow-up appointments at the centres between June and August 2018. The inclusion criteria for this study were 18 years of age or older and HIV infection confirmed by Western blot. In addition, patients with a history of HIV-associated neurocognitive impairment or who expressed unwillingness to complete the follow-up survey were excluded from this study.
A validated Mandarin-language 107-item FFQ developed by the National Institute of Nutrition and Food Safety, Chinese Center for Disease Control and Prevention (CDC) was used concurrently with the six-item tool to evaluate dietary Ca intake levels among the study sample. We compared the ability of the six-item tool to categorise patients into high- and low-Ca intake groups against the reference FFQ. In addition, we collected demographic data, history of HIV diagnosis and treatment, and anthropometric measures for each patient to evaluate the relationships between baseline characteristics, dietary Ca intake and musculoskeletal clinical outcomes.
Data collection and measures
Data were collected at two time points: at enrolment in person (baseline) and 1 month later via mobile app or phone (follow-up). At enrolment, participants first self-administered the six-item dietary screening tool via the Chinese mobile app Yiyantong. Then, under the guidance of research personnel, they completed the validated national FFQ designed by the Chinese CDC and a short survey on patient characteristics and risk factors for fracture. At 1-month follow-up, participants again self-administered the six-item tool for a second time via the Chinese mobile app Yiyantong. For patients (n 2) who were illiterate or visually impaired, the baseline survey instruments were read to and their answers recorded by a trained, local study coordinator, and the follow-up evaluation was completed by the same coordinator via telephone interview.
Survey instruments
Six-item dietary calcium intake screening tool
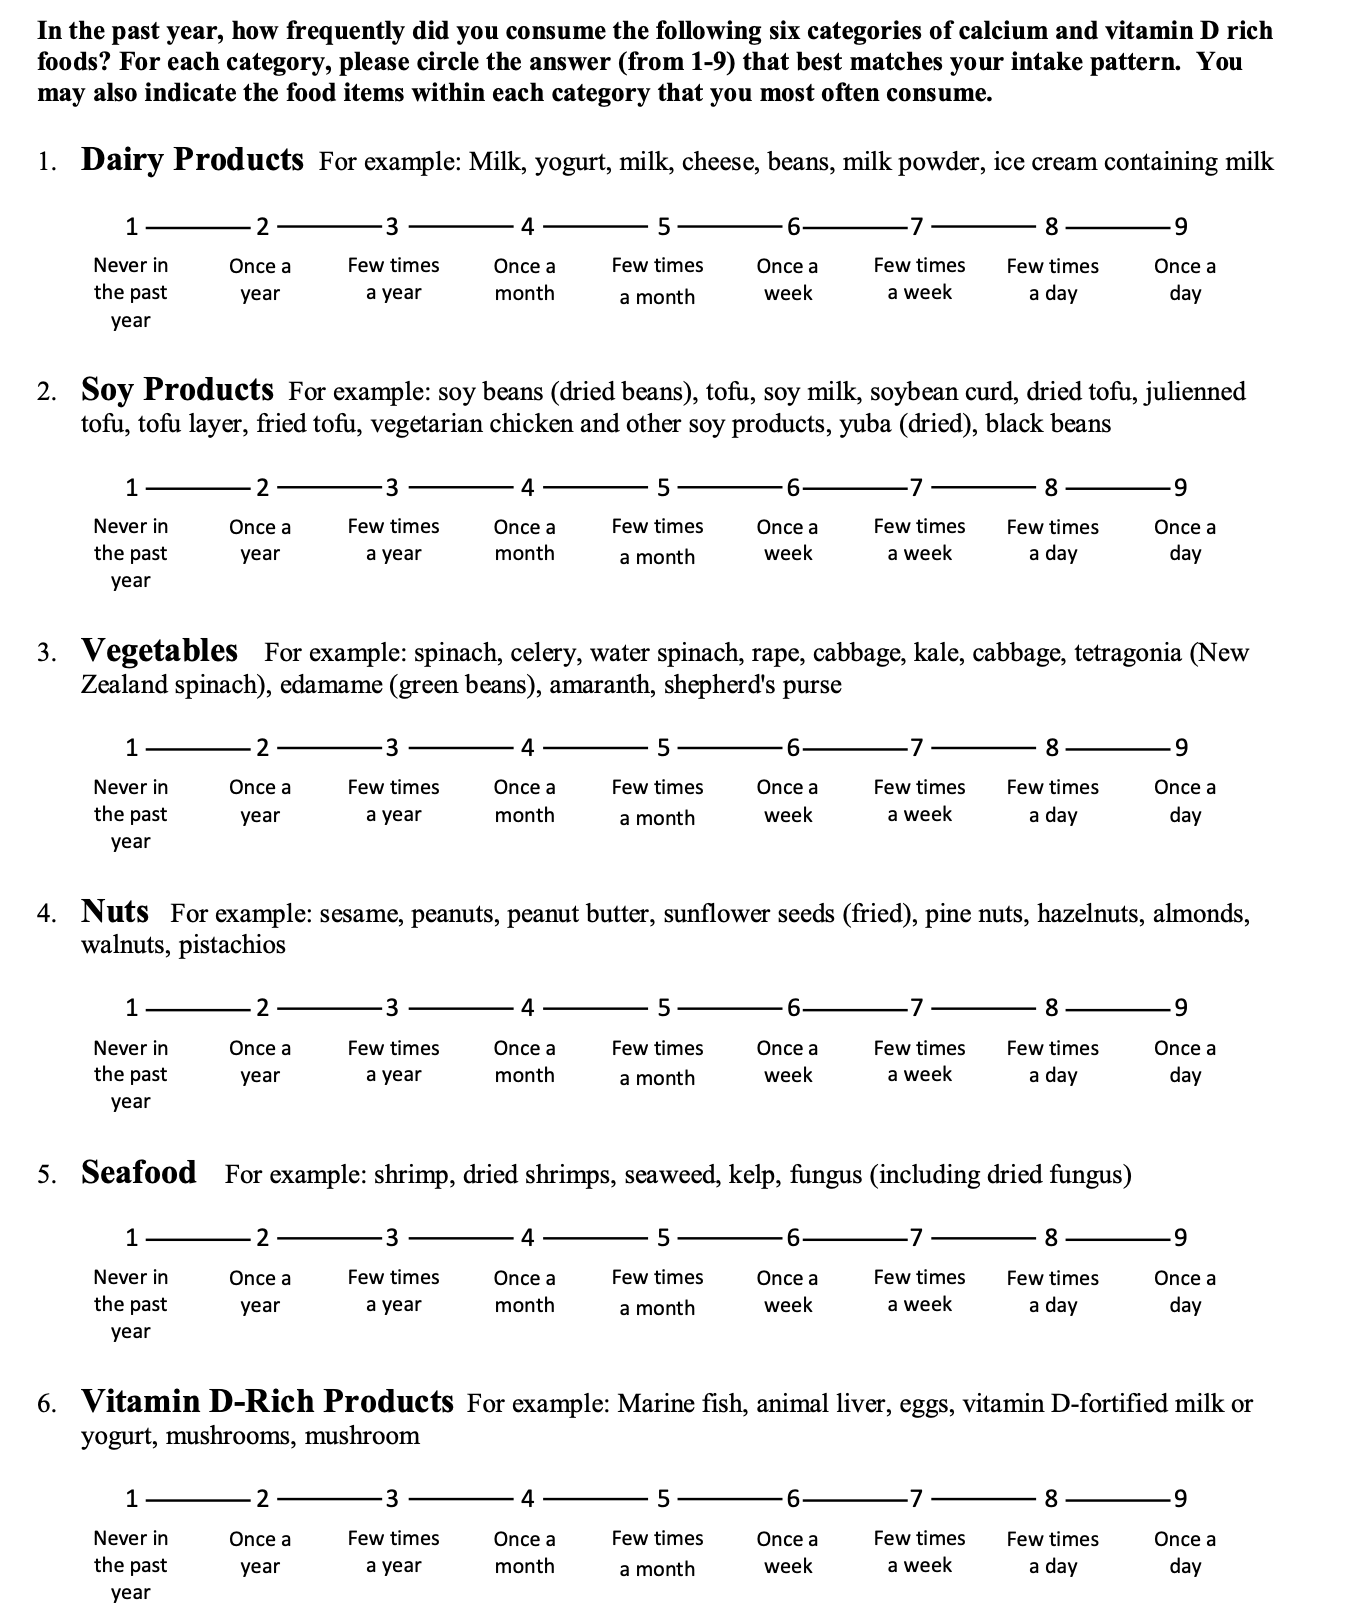
The investigators at the Chinese CDC had previously developed a Ca-and-vitamin D-focused 49-item FFQ as part of the Chinese Children and Families Cohort Study(Reference Potischman, Fang and Hao28). The original questionnaire identified 49 Ca- or vitamin-D-rich food items from existing dietary nutrient database(Reference Yang, Wang and Pan29) and grouped the food items into six food categories: dairy products, soya products, leafy green vegetables, nuts, seafood and vitamin D-rich products (Table 1). The lead investigators of this study (E.H. and W.C) extracted the example food from each food category and condensed each food category into a single question with a Likert-type scale for consumption frequency (see Supplemental Material). Specifically, patients were asked to indicate the frequency with which they consume foods from each category using a Likert-type scale (1 = never in past year, 2 = once a year, 3 = several times a year, 4 = once a month, 5 = several times a month, 6 = once a week, 7 = several times a week, 8 = once a day and 9 = several times a day). A total intake score was calculated for each participant by summing the responses for all six categories (range: 6–54), which describes the frequency of Ca-rich foods consumption semi-quantitively. The questionnaire was piloted in a previous study(Reference Hsieh, Fraenkel and Bradley22), as part of a multi-centre evaluation of osteoporosis preventive health behaviours among Chinese individuals with HIV.
Table 1 List of the food items included in the six-item dietary calcium screening tool

FFQ
The Mandarin-language 107-item FFQ was developed by the investigators at the Chinese CDC in 2006(Reference Li, Song and Pan30). The authors assessed the concordance between the classification of individual based on Ca intake (a 3-d weighed food record) and the Ca intake rate (the FFQ) and demonstrated a correlation coefficient of 0·38 for Ca consumption measured by the two methods. The FFQ was later validated against a 24-h dietary recall in another region of China and was shown to have a crude correlation coefficient of 0·31(Reference Song, Zang and Tang31). The FFQ has been adopted in multiple studies since its development(Reference Li, Jia and Chen32–Reference Zhang, Wang and Meng34), as well in a study specifically investigating Ca and bone health(Reference Meng, Man and Yuan35). The FFQ consists of a list of 107 most frequently consumed food and beverage items, classified into 17 categories: staple foods, meats and products, fish and products, milk and products, eggs, legume and products, salted vegetables, snack and nuts, alcoholic beverages, fungi and mushroom, fresh vegetable, fruits, tea and non-alcoholic beverages, sugar and starch, edible oil, spices, and food supplementations. For each food item, participants were asked to choose a time unit (daily, weekly, monthly, yearly or never) based on their consumption frequency, then estimate the number of times they consumed that item in the chosen time unit. Seasonal items were weighted to reflect the annual average. Finally, the typical portion sizes was asked separately for each food and beverage with visual aids of selected food models in different portion sizes provided by the research team. Annual consumption of each food item was calculated using the reported frequency and portion size. Average daily consumption of macro- and micronutrients was then calculated based on annual consumption and existing dietary nutrient database(Reference Yang, Wang and Pan29).
Sociodemographic and clinical characteristics
We collected sociodemographic information regarding age, sex, ethnicity (Han v. Chinese ethnic minority), marital status (single, divorced, separated, widowed v. Married and cohabitant), education level (less than high school v. high school and beyond), occupation (manual labour: farmer or labourer v. non-manual labour: civil servant, self-employed, service profession, unemployed, student and other); osteoporosis risk factors including BMI, body fat percentage, grip strength, smoking history (ever v. never), current alcohol use (yes or no), parental history of fracture (yes v. no/don’t know/don’t remember), personal history of prior fracture (yes v. no/don’t know/don’t remember), prior bone density test (yes v. no/don’t know/don’t remember), use of assistive walking device (yes or no), fall within the last year (yes or no), history of hormone treatment (ever or never), current glucocorticoid treatment (yes or no), age at first menstrual bleeding, last menstrual bleeding (<12 months v. ≥12 months ago) and prior removal of one or both ovaries (yes or no); and HIV-related factors such as time since diagnosis, route of infection (sexual, v. other/don’t know), baseline HIV viral load and CD4+ cell count.
In the pilot phase of the study, we distributed the preliminary version of all instruments to ten patients living with HIV and ten staff members at the PUMCH HIV/AIDS Center to pre-test the instruments. Minor revisions were made to the format and language of the survey instruments based on their feedback. Data collected from the pre-test phase were not included in the data analysis.
Statistical analysis
We described the sample characteristics using standard frequency analyses, means and standard deviations, medians and interquartile range for all variables, as appropriate. Independent t tests and χ2 tests were used to further investigate the differences between male and female participants, as well as participants recruited from the two different study sites. Further, we adopted independent t tests to describe the differences in energy and Ca intake profile of the study participants, stratified by sex, site of enrolment and clinical HIV status (CD4+ cell count and HIV viral load).
To examine the validity of the six-item tool, we used Spearman’s rank order, cross-classification and weighted kappa statistics (к w ) to assess the correlations between the intake data obtained from the reference FFQ and two administrations of the six-item tool, baseline and follow-up, respectively. We performed similar analyses between the two administrations of the six-item tool to calculate the agreement between their total scores and the subscores of each food category to demonstrate the reproducibility of the six-item tool. The Spearman’s rank order was performed with the results of both the six-item tool and the FFQ as continuous variables, while the cross-classification and the weighted kappa statistics analyses were performed with the results of both instruments divided into quartiles.
Because we were interested in identifying factors contributing to the lowest dietary Ca intake that could potentially require clinical intervention, we dichotomised participants into low (<800 mg/d) or sufficient (≥800 mg/d) dietary Ca intake as reported by the reference FFQ. Using this dichotomy, we subsequently determined the corresponding cut-off point for low (<35) or sufficient (≥35) dietary Ca intake measured by the six-item tool with univariate linear regression. Sensitivity and specificity were calculated with a cut-off score of 35 produced by the six-item tool compared to the reference FFQ for classifying participants in the same category of Ca intake. Finally, we performed receiver operating characteristic (ROC) analyses against the baseline and follow-up six-item tool scores and their average. For the ROC curves, the AUC was numerically calculated with the use of trapezoids. The Youden’s J statistic was calculated to determine the optimal cut-off score produced by the six-item tool that yields the highest sensitivity and specificity for each ROC analysis(Reference Youden36). All statistical analyses were performed using SPSS Statistics version 27 (IBM, Armonk, New York, USA).
Results
Sociodemographic and clinical characteristics of sample
A total of 127 participants agreed to participate in the study on the day of enrolment, of whom 83 participants completed the follow-up study, yielding a retention rate of 65·4 %. The participants had a mean age of 35·2 (sd 9·3) years, a mean BMI of 22·8 (sd 3·8) kg/m2 and 89 % were men (Table 2). The majority of the participants were of Han ethnicity (89·0 %), received high school education or beyond (80·3 %), and contracted HIV from sexual contact (93·7). As most patients seen at the two enrolment sites are on active ART regimens, the majority of the study participants had a CD4+ cell count above 350 cells/mm3 (64·6 %) and a current HIV viral load below 80 copies/ml (85·0 %). Sex differences were observed for some characteristics measured in this study: men were more highly educated (P ≤ 0·001) and had lower body fat percentage (P ≤ 0·001), higher bone mineral content (P ≤ 0·001), and larger grip strength (P ≤ 0·001). Moreover, participants recruited from Shenzhen were more likely to work in manual labour occupations (P ≤ 0·01), had a lower average BMI (P ≤ 0·05), as well as lower average grip strength (P ≤ 0·05).
Table 2 Sociodemographic and clinical characteristics of the study sample

IQR, interquartile range.
* Data collected and calculated by InBody S10 BIA body composition analyser.
† Average of three consecutive testing.
‡ Viral load detection limit: 20 copies/ml at PUMCH and 50 copies/ml at STPH.
Energy and calcium intake profiles of sample
The results of the FFQ reported an average of 11311·0 (sd 4654·7) kJ of daily energy intake and an average of 800·3 (sd 446·0) mg of daily Ca intake for study participants. Higher daily energy consumption was reported by participants with a CD4+ cell count higher than 350 cells/mm3 (P ≤ 0·05) and an HIV viral load lower than 80 copies/ml (P ≤ 0·05), respectively (Table 3). They also reported higher daily Ca intake, though the difference between groups did not reach statistical significance. The six-item tool presented a Ca intake profile for the study sample. Overall, men reported more frequent intake of Ca-rich foods than women (P ≤ 0·05), as well as more frequent intake of foods under the ‘Nuts’ category (P ≤ 0·05). Participants from Beijing reported more frequent intake of nuts than those from Shenzhen (P ≤ 0·01). Patients with a CD4+ cell count higher than 350 cells/mm3 reported more frequent overall Ca intake (P ≤ 0·05), particularly in the categories of dairy products (P ≤ 0·05), vegetables (P ≤ 0·05) and vitamin-D-rich products (P ≤ 0·05).
Table 3 Energy and calcium Intake levels, entire study sample and stratified by CD4 + cell count, and HIV viral load

* Outliers that fell more than 1·5 times the interquartile range above the third quartile or below the first quartile were excluded.
† Average of the baseline and follow-up scores for each food category.
‡ Independent t test used to derive the P-values.
Validity and reproducibility of the six-item tool
The mean dietary Ca intake of the study sample was 800·3 (sd 446·0) mg/d by the FFQ, and 54·7 % of the study participants fell below the Estimated average requirement of 800 mg/d for adults 19–50 years old as recommended by the Institute of Medicine(Reference Del Valle, Yaktine and Taylor37). The reported consumption frequency of foods from each category averaged between multiple times per month to multiple times a week (Table 3) and did not vary significantly by sex. Men received a higher Ca intake score as measured by the six-item tool at baseline (P ≤ 0·05), although this difference was not significant during the follow-up.
Validity
The six-item tool was tested for validity against the reference FFQ (Table 4). Fair (0·20–0·39) and moderate (0·40–0·69) Spearman’s rank-order correlation coefficients were found between the reference FFQ and the two administrations of the six-item tool, respectively. While adjusting energy by calculating nutrient density as intake/4184 kJ is thought to be able to mitigate systematic error in FFQ(Reference Willett, Howe and Kushi38), energy adjustment to the FFQ results did not improve the correlations between the six-item tool and the reference FFQ. The degree of misclassification associated with intakes assessed by the six-item tool compared with the reference FFQ was examined as the proportion of participants classified in the same, adjacent or opposite quartiles. The proportion of participants classified in the same quartile was 40·0 % for the six-item tool during follow-up and unadjusted Ca measured by the FFQ. Extreme misclassification into the opposite quartiles did not exceed 9·9% for any of the analyses performed. In addition, results from the weighted κ statistic showed fair agreement (0·20–0·39) for the six-item tool and the FFQ both at baseline and 1-month follow-up, as characterised by Landis and Koch(Reference Landis and Koch39).
Table 4 Validity and reproducibility of the six-item dietary calcium screening tool

Reproducibility
The six-item tool was administered twice to the same study sample (at baseline, then at 30 d’ follow-up) to test for reproducibility, and its estimates of nutrient intake were validated (Table 4). Moderate (0·40–0·69) Spearman’s rank-order correlation coefficients between the two administrations of the six-item tool were found for the total score and each of the six individual food categories. Cross-classification of the total score (at baseline v. follow-up) into quartiles showed that 49·4 % of the participants were in the same quartile, and only 4·8 % were classified into opposite quartiles in the two administrations. Given that it was not mathematically possible to rank each individual food category score into quartiles because more than 25 % of the participants could receive the same score for some categories (in which case the second quartile and the third quartile would share the same cut-offs), the participants were regrouped into four intake frequency groups for each food category: never in past year/once or several times a year, once or several times a month, once or several times a week, and once or several times a day. The degree of discordant classification into intake frequency groups between administrations of the six-item tool was assessed. The proportion of participants classified into the same frequency group ranged from 39·3 % to 55·4 % for each food category, and extreme discordance in classification did not exceed 4·8 %. Finally, results from the weighted κ statistic showed moderate agreement (0·40–0·59) for the total score, dairy products and nuts, and fair agreement (0·20–0·39) for soya products, vegetables, seafood and vitamin-D-rich foods.
Sensitivity and specificity
We first created a univariate regression model to predict each participant’s daily Ca intake using their baseline six-item tool score. Participants were dichotomised into low or sufficient dietary Ca intake groups with Ca intake of 800 mg/d as measured by the FFQ or a six-item tool score of 35 as cut-off points (Fig. 1). The six-item tool has a sensitivity of 55·6 % in identifying participants who consumed inadequate amount of dietary Ca as defined by the estimated average requirement, and a specificity of 28·8 % in identifying participants who do meet the dietary Ca intake recommended estimated average requirement for their age group.

Fig. 1 Scatter plot of the daily Ca intake assessed by the FFQ v. the calcium-specific six-item score on the day of study enrolment. EAR, estimated average requirement (800 mg/d). The cut-off score for sufficient calcium intake = 35
Cut-off score for future application
Furthermore, ROC analyses showed that the AUC for the baseline six-item score as a predictor of low v. sufficient Ca intake as measured by the FFQ was 0·709 (95 % CI 0·614, 0·804) (Fig. 2), yielding sensitivity and specificity estimates of 61·9 % and 30·8 %, respectively, using an optimised cut-off level of >35·5. The AUC for the follow-up six-item score as a predictor of low v. sufficient Ca intake as measured by the FFQ was 0·719 (95 % CI 0·603, 0·835), yielding sensitivity and specificity estimates of 91·3 % and 55·9 %, respectively, using an optimised cut-off level of >38·5. Finally, the AUC for the average of the baseline and follow-up six-item score as a predictor of low v. sufficient Ca intake as measured by the FFQ was 0·724 (95 % CI 0·602, 0·846), yielding sensitivity and specificity estimates of 87·0 % and 39·4 %, respectively, using an optimised cut-off level of >36·75.

Fig. 2 ROC curves of the baseline (a), follow-up six-item score (b) and their average (c) as a predictor of low v. sufficient calcium intake as measured by the FFQ. ROC, receiver operating characteristic
Discussion
In this study, we sought to understand the performance characteristics of a six-item dietary Ca intake screening tool designed for Chinese individuals living with HIV. The results demonstrated fair-to-moderate relative validity (Spearman’s correlation coefficient = 0·39 and proportion of subjects classified in the same or adjacent quartiles = 75·7 %) and moderate-to-good reproducibility (Spearman’s correlation coefficient = 0·60 and proportion of subjects classified in the same or adjacent quartiles = 83·1 %) for the six-item tool when comparing its semi-quantitative outcome to the dietary Ca intake measured by a validated FFQ. The average score of the two administrations of the six-item tool yielded sensitivity and specificity of 87·0 % and 39·4 % for identifying low v. sufficient Ca intake, with an optimised cut-off level of 36·75. The results are comparable to prior Ca intake survey validation studies(Reference Nordblad, Graham and Mughal19,Reference Söderberg, Lind and Karlsland Åkeson40,Reference Rasch, de van der Schueren and van Tuyl41) , and a higher sensitivity is desired over specificity a screening tool when further testing (FFQ or other dietary evaluations) poses minimal risks(Reference Herman, Gill and Eng42). Overall, the results of the study suggest that the six-item tool used in the present study has adequate validity and reproducibility to categorise dietary Ca intake in this specific population and help identify individuals with low Ca intake for further dietary evaluation.
Several underlying factors could weaken the correlation observed in this study. Notably, while energy underreporting has been found to be common in high-income countries(Reference Tooze, Subar and Thompson43), energy overreporting may be more common in other countries due to cultural and psychosocial differences(Reference Harrison, Galal and Ibrahim44). In this study, we observed a large number of outliers in the FFQ outcomes, in accordance with previous findings. In attempt to account for energy misreporting, adjustment for energy led to a decrease in correlation coefficients for most non-energy-bearing nutrients such as vitamins and minerals, which has been noted in several other studies(Reference Deschamps, de Lauzon-Guillain and Lafay45,Reference Affret, Wagner and El Fatouhi46) . This is thought to be a result of systematic errors of under/overestimation of non-energy-bearing nutrients as they contribute to relatively small portion of the total energy intake when compared to energy-bearing nutrients such as lipids and carbohydrates(Reference Kipnis, Freedman and Brown47). As a result, we opted to exclude participants that reported a daily energy intake more than 1·5 times the interquartile range above the third quartile or below the first quartile from the final analysis(Reference Hoaglin, Mosteller and Tukey48).
Furthermore, reactive bias extending beyond participants who were identified as outliers could weaken the correlation as well. Though the semi-quantitative outcome of the six-item tool does not allow us to directly compare the absolute Ca intake level measured by the two instruments, it was observed that follow-up or average of the baseline and follow-up six-item tool results had higher predictive values of the FFQ outcome compared to the baseline results alone. We hypothesise that reactive bias contributing to this result stems from two desires: to simplify the reporting process (i.e. leave out food items) and/or to comply with socially desirable norms (i.e. appear to have a Ca-rich diet). While the guided administration of the FFQ provided little flexibility for participants to simplify the reporting, the self-administration of the six-item tool allowed more room for social desirability bias. It was possible that the participants’ baseline six-item tool reporting was more heavily influenced in the presence of study personnel, as commonly reported by other dietary self-report studies(Reference Hebert, Clemow and Pbert49).
Several limitations emerged in the course of this study. First of all, the six-item tool was tested for validity against an FFQ, both of which are frequency-based instruments and share similar error structure, namely systematic errors. In designing the study, we have considered short-term instruments such as 24-h dietary recall or weighted food record as alternative reference choices. However, short-term instruments are subject to random errors, such as the day-of-the-week effect(Reference Thompson, Larkin and Brown50), which can be further magnified in micronutrient intake assessment(Reference Poslusna, Ruprich and de Vries51). Though the excessive within-person variation in data from short-term dietary instruments does not affect our understanding of dietary patterns for a group, they pose significant challenges in testing a screener tool that seeks to capture the habitual daily intake of a micronutrient. In an ideal study design, this limitation can be overcome by multiple, non-consecutive administrations of dietary recall or weighted food records, which was, unfortunately, not attainable in this current study.
On the other hand, the sample size of this study is relatively small compared to typical survey validation studies, due to the fact that the study was designed to focus on a specific population, namely Chinese individuals living with HIV, for whom the tool was designed as a result of pragmatic necessity. To improve generalisability, we enrolled patients from two separate study sites located in different regions of the country. Consistent patient enrolment and survey protocols across the two study sites ensured minimal difference in overall survey performance characteristics, as observed in data analysis, despite observed differences between the two patient samples in terms of occupation (more manual labour occupation reported in Shenzhen) and dietary preferences (more frequent nuts intake reported in Beijing). Finally, we observed that the reproducibility of the six-item tool had better performance than its relative validity against the FFQ. While we cannot predict if a larger sample size would yield stronger analysis, our observation may be attributable to the inherent weakness of brief dietary intake screening tools, as several other studies with larger sample sizes have drawn similar conclusions(Reference Martela, Kuźniewicz and Pluskiewicz52–Reference Fujiwara, Murakami and Sasaki54).
Consistent with the population-based data reported by several previous studies from China(Reference Huang, Wang and Zhang55–Reference Wang, Wang and Ouyang57), the majority of study participants reported a dietary Ca intake lower than the recommended Ca requirement of 800 mg/d. International studies have found that compared to the general population, individuals with HIV have lower bone mineral density(Reference Bruera, Luna and David58,Reference Jones, Restrepo and Kasowitz59) , higher prevalence of osteoporosis if receiving ART(Reference Wandeler, Johnson and Egger60) and higher fracture rates(Reference Triant, Brown and Lee7). Compounded with both biological and socio-behavioural risk factors, HIV-infected individuals are particularly vulnerable to bone diseases. These findings together underscore the role of dietary Ca intake screening in this population. However, patients with HIV tend to have multiple competing medical concerns, and labour-intensive assessments such as FFQ are unattainble in the outpatient setting. Developed of out a need-based context as part of a larger study looking at behavioural risk factors in osteoporosis prevention among HIV population, the six-item tool was first validated in its target population. We acknowledge that the screener can theoretically be used in any individual following a typical Chinese diet, though further, larger-scale validation would be needed.
The results of this study are also informative to potential future studies seeking to evaluate the performance characteristics of the six-item tool in a broader context. While many short dietary questionnaires and brief nutritional screenings have been developed for populations in higher-income countries(Reference Affret, Wagner and El Fatouhi46,Reference Zhang and Reicks61–Reference Khalesi, Doshi and Buys64) , very limited data exist in validated short-form nutrition screening in many low- and middle-income settings and particularly in disadvantaged populations. As economic growth, urbanisation, demographic transition and globalisation influence nutritional epidemiology globally, the double burden of malnutrition is increasingly characterised by the coexistence of undernutrition along with overweight and obesity on both a societal and an individual level(Reference Kolčić65). This highlights the necessity and urgency of developing effective and efficient tools that enable dietary intake screening to be adopted in routine healthcare settings.
The six-item tool was designed to gather consumption frequency of Ca- and vitamin-D-rich food categories with example food items easily modified to tailor different dietary habits. With further validation, not only will it be possible for the six-item tool to be applicable to the general Chinese population, it can be adapted and applied to different geographical areas. These screening results will in turn provide invaluable information on nutrients and outcome relationships for many diseases influenced by dietary behaviours. Furthermore, in an outpatient setting, the short dietary screening tool is also a feasible and interactive starting point for educating patients about dietary intake. It is possible that such dietary screening tools carry educational value on top of their primary evaluative roles, and that they could serve as a hands-on way to engage patients in thinking about their own nutrition in routine clinical encounters.
In summary, the six-item tool in our study provided a reasonable estimation of dietary Ca intakes in Chinese individuals living with HIV as compared to a validated Mandarin-language FFQ published by the Chinese CDC. This study is the first to validate a short-form dietary Ca intake screening tool catered towards local dietary habits in China, conducted in a sample at increased risk for secondary osteoporosis and fracture. The scientific validation of this tool offers researchers and healthcare providers a convenient and practical instrument for evaluating dietary Ca intake as a risk factor for bone diseases. Findings from this screening validation also provide insights into targeted tools development for dietary Ca intake screening. Future studies exploring the applicability of the six-item tool to the general population or other groups of patients at increased risk for osteoporosis and fracture are warranted.
Acknowledgements
Acknowledgements: We would like to thank Xiaodong Shi, Yuxin Yao and Tingxia Lyu for their extensive help during data collection. We would also like to thank Leslie Curry and Amanda Brewster for their invaluable input during the conception of this project. Financial support: This study was funded by the Yale Global Health Scholars: Seed Funding Award, Yale College Fellowship for Research in Global Health Studies and Jonathan Edwards College Richter Summer Fellowship Award. Dr Hsieh is supported by NIH/Fogarty International Center K01TW009995, and the Yale Center for Clinical Investigation/Doris Duke Foundation Fund to Retain Clinical Scientists. Conflict of interest: None. Authorship: Conceptualisation: L.Y.T., W.C., T.L. and W.H.; data curation: L.Y.T., H.L., Z.Y. and W.S.; formal analysis: L.Y.T. and E.H.; funding acquisition: L.Y.T. and E.H.; investigation: L.Y.T. and E.H.; methodology: L.Y.T., W.P., W.C. and E.H.; project administration: L.Y.T., W.X., W.P., H.L., Z.Y., W.S. and W.H.; resources: W.X., W.P., H.L., Y.H., T.L. and E.H.; supervision: W.X., Y.H., W.C., T.L. and E.H.; writing – original draft: L.Y.T.; writing – review and editing: W.X., W.C., T.L. and E.H. Ethics of human subject participation: This study was conducted according to the guidelines laid down in the Declaration of Helsinki, and all procedures involving research study participants were approved by the institutional review boards of both the Yale School of Medicine (ID: 2000023377) and the Peking Union Medical College Hospital (ID: S-K485) prior to initiation. The study was also reviewed and exempt by the ethics committee of the Shenzhen Third People’s Hospital (ID: 2018–009). Written informed consent was obtained from all subjects.
Supplementary material
To view supplementary material for this article, please visit https://doi.org/10.1017/S1368980021001427