


Citizens living under authoritarian rule are thought to engage in preference falsification, voicing support for their governments in public but harboring disdain in private. In aggregate, this behavior makes it difficult to gauge the level of support for a given regime (Kuran Reference Kuran1991; Kuran Reference Kuran1997). When we observe positive attitudes towards authoritarian governments, it may be because that support is authentic, or it may be because citizens are adept at ‘living within the lie’, to use Havel's (Reference Havel2009) phrase.
Despite the influence of the concept, the empirical evidence for preference falsification in authoritarian systems is limited. In China, Jiang and Yang (Reference Jiang and Yang2016) show that citizens’ assessments of the regime using sensitive and nonsensitive questions diverge after a local political purge, which is taken as evidence of falsification.Footnote 1 In rich ethnographic accounts, Wedeen (Reference Wedeen2015) provides detail of Syrian citizens behaving ‘as if’– engaging in regime-affirming rituals and displays, despite being more critical in private. Other studies reach the opposite finding. Frye et al. (Reference Frye2017) conduct a list experiment to assess the popularity of Vladimir Putin and find little evidence of falsification, concluding that, ‘Putin's approval ratings largely reflect the attitudes of Russian citizens’. Combined, these single-country studies suggest that preference falsification may exist, but that it is likely context dependent.
It is difficult to directly measure falsification, but we may readily measure a related behavior – self-censorship. This article proposes a simple test for assessing the likelihood of self-censorship at scale, using existing cross-country survey datasets. The test involves calculating the difference in item nonresponse rates (‘Don't Know’ and ‘No Answer’ responses) for regime assessment questions and nonsensitive political questions (Berinsky Reference Berinsky1999; Berinsky Reference Berinsky2004; Berinsky and Tucker Reference Berinsky and Tucker2006). This gives a rough indicator of the number of citizens that choose reticence when they assess the regime (Kuran Reference Kuran1997). This index can be replicated across samples and population subgroups, allowing us to directly compare different authoritarian systems.
We implement this test using data from the most recent waves of the World Values Survey (WVS). While the WVS is not beyond criticism (King et al. Reference King2004), it represents the largest-scale survey effort in human history, covering 100 countries over three decades. The WVS core questionnaire contains a set of direct regime assessment measures, including questions on confidence in government, democracy and respect for human rights. The WVS has been implemented in fifty-nine country-year samples in political systems that would be considered authoritarian by conventional standards.
Our core findings are as follows. First, a simple bivariate regression shows that the self-censorship index is indeed associated with regime type. In general, citizens living under authoritarian rule refuse to answer questions about confidence in government, democracy and human rights at slightly higher rates than their counterparts in democracies.
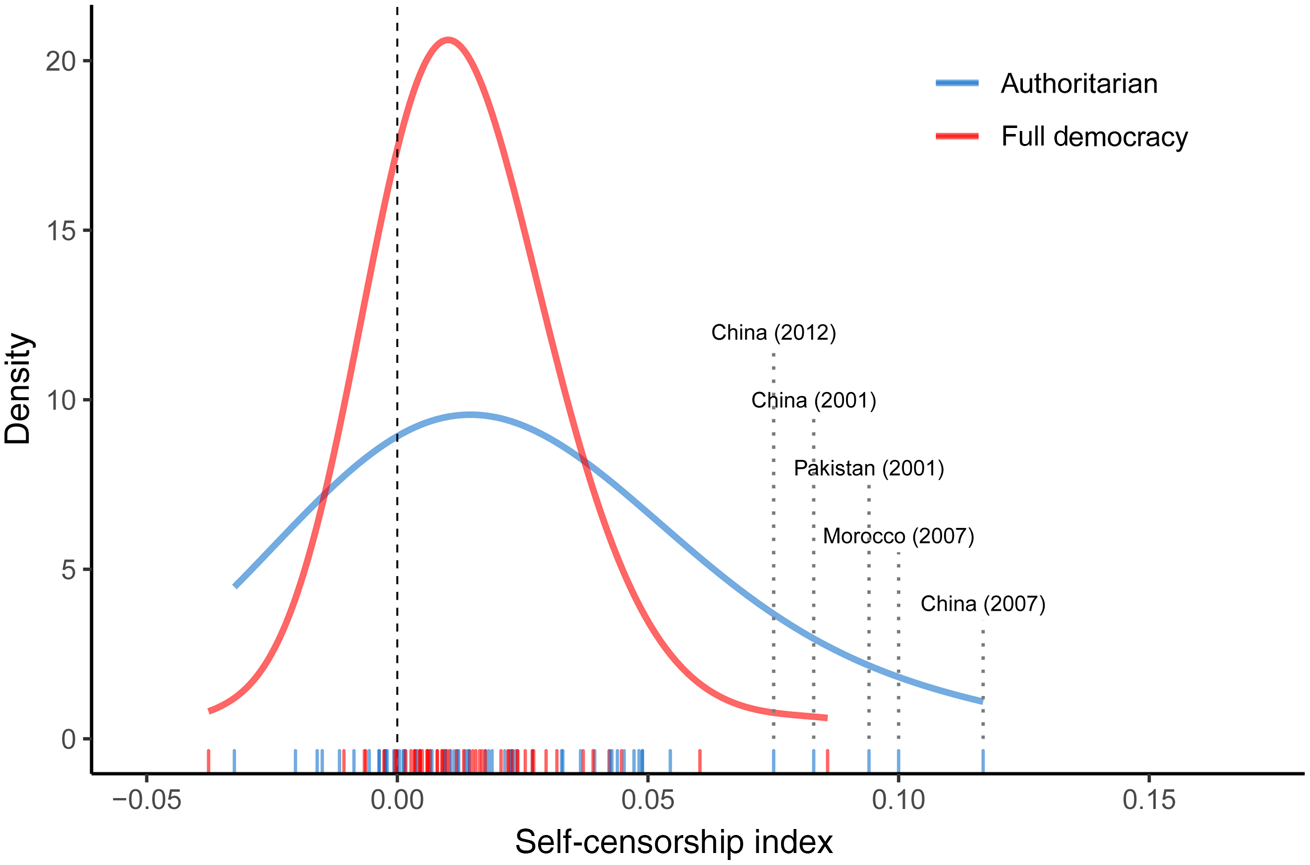
Secondly, there exists important variation in self-censorship within the authoritarian world. The standard deviation of the index in authoritarian country-years is substantially greater (0.031 vs. 0.018) than in democratic country-years. The distribution for democracies is roughly normal, while for authoritarian countries it is right-skewed. In fact, most of the authoritarian samples in the WVS data do not show evidence of substantially inflated item nonresponse rates on the regime assessment questions. China is a notable exception, with consistently high scores on the self-censorship index across country samples. This suggests that self-censorship may be more prevalent in some authoritarian systems than others, which helps explain the divergence in findings in previous single-country studies (Frye et al. Reference Frye2017; Jiang and Yang Reference Jiang and Yang2016; Wedeen Reference Wedeen2015).
Thirdly, this variation across authoritarian countries is driven in part by political institutions (Boix and Svolik Reference Boix and Svolik2013; Gandhi Reference Gandhi2008; Gandhi and Przeworski Reference Gandhi and Przeworski2007; Svolik Reference Svolik2012). An exploratory analysis of the authoritarian samples shows that countries with electoral competition for the executive tend to have lower levels of self-censorship (Gandhi and Lust-Okar Reference Gandhi and Lust-Okar2009; Levitsky and Way Reference Levitsky and Way2002; Levitsky and Way Reference Levitsky and Way2010; Morse Reference Morse2012; Schedler Reference Schedler2013). Conversely, where the authoritarian ruler is chosen through a wholly non-competitive processes (internal appointment processes, hereditary succession, etc.), citizens are more reluctant to voice their political preferences. In these systems, the regime is truly the ‘only game in town’, and this dominance over society may breed political reticence.
The index proposed here can also be used to assess variation in self-censorship rates across groups within an authoritarian system. Probing deeper into the Chinese case, we see that self-censorship is likely more prevalent among older cohorts, which voice extremely high levels of support for the regime (Chen Reference Chen2004; Dickson Reference Dickson2016; Tang Reference Tang2016). Reticence is also higher among women, non-Party members, and citizens in the lower or middle class. These findings are replicated across the WVS and another recent nationally representative survey in China. Combined, these results suggest that self-censorship may be concentrated among citizens who are socially and politically marginalized. It also raises doubts as to the reliability of measurement of political attitudes in China (Chen Reference Chen2004; Chen and Dickson Reference Chen and Dickson2008; Dickson Reference Dickson2016; Li Reference Li2004; Tang Reference Tang2016).
This article offers the first assessment of self-censorship across time and space. Our proxy is imperfect, but we are able to show that respondents living in most authoritarian systems do not say ‘Don't Know’ to regime assessment survey questions at unusually high rates. If such respondents were really taking the survey in an environment of fear, we would expect more of them to refuse such questions entirely (Berinsky Reference Berinsky1999; Berinsky Reference Berinsky2002; Berinsky Reference Berinsky2004; Berinsky Reference Berinsky, Donsbach and Traugott2008). The fact that they do not raises doubts about the actual sensitivity of these questions, and in turn whether feigning positive attitudes is as widespread as assumed.
Preference Falsification, Self-Censorship and Item Nonresponse
The concept of preference falsification is one of the most influential ideas in the study of authoritarian politics. Kuran's (Reference Kuran1991) key innovation is that in authoritarian systems, there may be a disconnect between the level of support a citizen expresses for the regime in public (public preference) and her true level of support (private preference). At a given point in time, a citizen's private preference is effectively fixed, but her public preference is under her control. When a citizen who does not actually like the regime in private voices support in public, she is said to be engaging in preference falsification (Kuran Reference Kuran1991). This behavior is a subtype of the broader phenomenon of social desirability bias (Arnold and Feldman Reference Arnold and Feldman1981), where people adjust their survey responses or public persona in order to conform to social norms.
We consider survey interviews to represent interactions in which citizens provide their public preferences, which may or may not align with their private preferences (which are unobservable to the researcher). To understand how preference falsification might manifest itself in surveys, consider the regime assessment question shown in Figure 1. This question elicits a respondent's general confidence in government and is commonly used in large-scale cross-country surveys.

Figure 1. Understanding preference falsification and self-censorship in surveys.
In a given society, there is a true distribution of confidence in government among the population – the distribution of private preferences, to use Kuran's terminology. The figure depicts a hypothetical ten-person society, with the true population values (private preferences) shown on the left-hand side. There is a relatively low level of confidence in government in this case: the modal response is ‘1. None at all’. We also see that one citizen (Citizen 0) does not know her level of confidence in government. Some portion of ‘Don't Know’ answers in the population is normal, as not all citizens have well-formed political attitudes on every issue, and there are real cognitive costs to answering survey questions (Berinsky Reference Berinsky2004; Berinsky Reference Berinsky, Donsbach and Traugott2008; Krosnick Reference Krosnick1991; Tourangeau, Rips and Rasinski Reference Tourangeau, Rips and Rasinski2000).
The right panel depicts systematic preference falsification, as it might manifest itself in a survey like the WVS. Citizens in authoritarian societies may inflate their assessments of the government out of fear, leading to high expressed levels of confidence, satisfaction and so forth. Here, Citizen 2 has inflated her response from ‘3. Quite a lot’ to ‘4. A great deal’. Citizens 4 and 6 have moved up to ‘3. Quite a lot’ despite having little confidence in the government.
This inflation process fits Kuran's (Reference Kuran1997) precise definition of preference falsification, but it is quite difficult to measure in practice. When we observe positive attitudes about authoritarian governments, it may because citizens genuinely like their governments, or it may be because they are inflating their responses.Footnote 2 We can never be sure if a citizen who says ‘3. Quite a lot’ to an enumerator really feels that way.
The test proposed in this article relies on the measurement of item nonresponse (Berinsky Reference Berinsky1999), a behavior that should offer clues as to whether or not questions are sensitive. In the right panel of Figure 1, Citizens 5 and 8 have chosen to voice a ‘Don't Know’ response (public preference), despite holding well-defined negative attitudes towards the regime (private preference). This is self-censorship, a behavior that is related to but distinct from the preference falsification Kuran (Reference Kuran1997) describes. Self-censorship is more feasible to measure at scale, and it is conceptually important in its own right.
Note that item nonresponse can occur for two reasons. The first is when a citizen is unable to form a coherent assessment or answer a survey question – so-called nonattitudes (Converse Reference Converse1964). This is Citizen 0 in the example from Figure 1, a person who has cognitive difficulty answering a question. The second occurs when there are social costs to expressing an opinion without sufficient personal or social benefits (Citizens 5 and 8). For example, in the contemporary United States, respondents might be unwilling to express attitudes that would be considered racist, so they might choose ‘Don't Know’ to such questions (Berinsky Reference Berinsky1999; Kuran Reference Kuran1997). Thus in general, we observe higher nonresponse rates for questions that are cognitively complex, socially sensitive or both.
To summarize, we believe item nonresponse rates can be used to measure self-censorship, which will indirectly allow us to assess the broader idea of preference falsification, and to measure its likely incidence across time and space. If citizens in nondemocracies are really feigning positive attitudes for regimes they despise, we should see some indication in survey data that assessment questions are more sensitive in those contexts.
Data and Measurement Strategy
The article uses data from recent waves of the WVS. The WVS is a collaborative global survey project that measures citizen belief systems and their changes over time. To date, there have been six waves of the WVS, with almost 100 countries surveyed and over 400,000 interviews conducted. Many of the core political attitude questions of the WVS have been asked in multiple waves, which facilitates comparisons across time and space. Appendix Table A1 lists the authoritarian country samples used in the analysis.Footnote 3
We calculate the following index across the different country-year samples:
 $${\rm selfcens}{\rm .in}{\rm d}_{ct} = \mathop {\left({\displaystyle{{\sum\nolimits_{\,j = 1}^m {\sum\nolimits_{i = 1}^n {{\rm non}\,{\rm respons}{\rm e}_{ij}} } } \over {m \times n}}} \right)}\limits^{{\rm regime}\,{\rm assessment}} -\mathop {\left({\displaystyle{{\sum\nolimits_{k = 1}^m {\sum\nolimits_{i = 1}^n {{\rm non}\,{\rm respons}{\rm e}_{ik}} } } \over {m \times n}}} \right)}\limits^{{\rm non}\,{\rm sensitive}} $$
For each country c and sample at time t, for each regime assessment question j, we sum the item nonresponse indicator across all respondents n, sum this across all of the m questions, and divide the total by m × n. This gives the mean item nonresponse for the regime assessment questions in the sample. We then subtract the mean item nonresponse for a set of nonsensitive political questions.
If we observe high levels of item nonresponse on sensitive questions in a given country-year sample, it may be because of self-censorship, or it may be because of low levels of political literacy and a lack of clearly defined attitudes (Berinsky Reference Berinsky2004). Subtracting out nonresponse rates for nonsensitive questions corrects for the latter, and it gives us more confidence that the differential is capturing political self-censorship (Jiang and Yang Reference Jiang and Yang2016).
The questions used for the construction of the self-censorship index are shown in Table 1. The three regime assessment questions ask respondents to report their general confidence in government, and their perceptions of human rights and democracy in their country. Ex ante, these are the precise sorts of questions on which we would expect to observe self-censorship or preference falsification. The non-sensitive questions involve measures of interpersonal trust, life satisfaction and confidence in the television industry. All questions include a ‘Don't Know’ or ‘No Answer’ option, and some include both.Footnote 4
Table 1. Questions for falsification index construction world values survey – core questionnaire

Our goal was to pick questions with similar levels of cognitive difficulty but different levels of political sensitivity (Berinsky Reference Berinsky2004). The choice of these questions is inherently arbitrary, and the index itself may be sensitive to this decision. We recommend other researchers explore different sets of questions in the index construction, and we have done so here. Our core index in the article relies on these six questions, but in the Appendix we assess the results across a two-question version of the index, a version that includes no nonsensitive questions, and a version that includes twenty nonsensitive questions. The core substantive findings of the article do not change appreciably.
Cross-National Results
Figure 2 shows the distribution of the index across regime type. Authoritarian and democratic country-years were identified using data from the Polity IV project (Marshall, Jaggers and Gurr Reference Marshall, Jaggers and Gurr2002). To err on the side of inclusivity, we define authoritarian country-years as those having a combined Polity score of less than 5. The democratic countries represented in the figure correspond to ‘full democracies’ with a Polity score of 10. In order to expand the sample size, for some country-years, we use multiple imputation to impute item nonresponse rates for questions not included in the WVS (King et al. Reference King2001). We also removed all country-year samples for which less than four of the six of index questions were administered.Footnote 5

Figure 2. Self-censorship index by regime type.
Note: figure shows the distribution of the self-censorship index across democratic and authoritarian country-year samples. Democratic countries in the figure correspond to ‘full democracies’ with a Polity score of ten. Authoritarian samples are country-years with a Polity score of less than five.
A few patterns emerge from this visual analysis. First, authoritarian country-year samples generally score higher on the self-censorship index (mean value of 0.022 vs. 0.014 for democracies). The coefficient estimate for a bivariate regression of the self-censorship index on democracy is statistically significant at conventional levels. This result is robust to comparing different versions of the index or using the full ordinal Polity measure of democracy (see Appendix Table A2 for estimates).
Secondly, the distribution of the index in the authoritarian country-year samples is right skewed, while for democracy it is roughly normal. The standard deviation of the index is also much lower for democracies (0.018 vs. 0.031). The figure shows that the distributions overlap quite substantially, and the difference in means is driven by only a few authoritarian cases. There are plenty of authoritarian samples in which citizens do not show inflated rates of item nonresponse.
The variation across authoritarian regimes is perhaps more interesting. Figure 3 shows the calculated self-censorship index and associated 95 per cent confidence intervals for the authoritarian country-year samples in the WVS. As a reference, the boxplots at the bottom of the figure compare the distribution of the index across regime types.

Figure 3. Self-censorship index in authoritarian country-year samples.
Note: figure shows the mean self-censorship index across different country-year samples of the WVS. Segments depict 95 per cent confidence intervals.
There are very clear examples of authoritarian countries where citizens seem reluctant to voice their assessments of the regime on surveys; China has among the highest values in the analysis for its three most recent WVS (2001, 2007, 2012) country samples. Morocco (2011, 2007), Pakistan (2001), Egypt (2001), Jordan (2007) and Azerbaijan (1997) also show some evidence of falsification.
However, self-censorship scores hover slightly above zero for most authoritarian countries, and within the normal range for most full democracies. In Singapore, Thailand, Kuwait, Mexico and Zimbabwe, there is little evidence that citizens self-censor on political questions. This is not to say that self-censorship does not exist in those countries; we simply do not find much evidence of it using our method.
It should be noted that some of the authoritarian regimes with the lowest Polity scores are excluded from this analysis. We do not have samples in the WVS for North Korea under Kim Jong Il, Syria under Bashar al-Assad or Cambodia under Pol Pot, for example. It is precisely those regimes where it is most difficult to collect public opinion data to begin with. It is possible that samples from these countries would show some self-censorship, with citizens saying ‘Don't Know’ on political questions. This may partly explain while we only find weak evidence of self-censorship in only a few systems: the harshest governments do not allow surveys like the WVS to be administered in the first place. This is an important caveat to the analysis.
What explains variation in the level of self-censorship in authoritarian systems? The Appendix reports the results of an exploratory data analysis that probes several plausible correlates of interest from the authoritarian politics literature: the level of repression (repression), the level of political competition in the executive branch (exec.comp), the presence of multiple parties (party.comp), the level of military control in politics (military) and the duration of the regime spell (duration). The repression variable is drawn from Wood and Gibney's (Reference Wood and Gibney2010) Political Terror Scale (PTS), a five-point index where higher values correspond to higher levels of repression in society. All other variables are created from Svolik's (Reference Svolik2012) Authoritarian Institutions dataset, which was extended by the authors to the present day to increase the coverage of the analysis.
The cross-national analysis produces two core findings. First, a lack of competition in the executive appears to be robustly associated with self-censorship. The exec.comp indicator is coded 1 for any authoritarian regime where the ruler is elected and 0 for all other regimes. This is meant to capture ‘electoral authoritarian’ regimes (Howard and Roessler Reference Howard and Roessler2006; Morse Reference Morse2012; Schedler Reference Schedler, Donsbach and Traugott2009; Schedler Reference Schedler2013). Paradigmatic cases in our dataset include Yeltsin's Russia, Mugabe's Zimbabwe and Zedillo's Mexico. Regimes with elections appear to have a roughly 2–4 percentage lower score on our index.
Though this analysis is strictly exploratory, we believe this finding reveals something larger theoretically about public opinion under authoritarianism. In systems without meaningful competition in the executive branch, the regime is truly the ‘only game in town’ and fully dominates the political system. In such closed authoritarian systems, opposition is weak or nonexistent (Miller Reference Miller2013; Snyder Reference Snyder2006). This may facilitate cults of personality and ritualized demands of political loyalty (Wedeen Reference Wedeen2015), where citizens may not be socialized into voicing opposition. It is intuitive that citizens are more likely to self-censor in these contexts.
The second finding of interest is that more repressive authoritarian regimes do not necessarily have higher levels of self-censorship. The measure of repression we use, the PTS, does not seem to be robustly associated with the falsification index (Wood and Gibney Reference Wood and Gibney2010), though there may be a weakly positive relationship. This result may be partially driven by the poor coverage of the WVS in hyper-repressive regimes, or the crudeness of the PTS itself. Either way, the analysis raises some doubts about the relationship between repression/fear and self-censorship, which have been echoed in recent experimental work (Lei and Lu Reference Lei and Lu2017; Stockmann, Esarey and Zhang Reference Stockmann, Esarey and Zhang2018).
Application: Self-Censorship in China
In the remainder of the article, we use the method proposed above to probe the nature of self-censorship in contemporary China. According to Howard and Roessler's (Reference Howard and Roessler2006) typology, China under the CCP represents a closed authoritarian system. Chinese government leaders are chosen through an internal Party process, not a national election. This decision is ratified months later by the country's parliament (the National People's Congress) (Truex Reference Truex2016). ‘Democratic’ parties exist in the parliament, but they are under the leadership of the CCP. These political institutions, combined with an increasingly sophisticated propaganda apparatus (King, Pan and Roberts Reference King, Pan and Roberts2013; King, Pan and Roberts Reference King, Pan and Roberts2017; Roberts Reference Roberts2018; Stockmann Reference Stockmann2013), give the CCP near complete dominance of Chinese society.
The analysis above raises doubts about the reliability of political attitudes reported by Chinese citizens. Chinese citizens do express positive attitudes about the government on surveys (Chen Reference Chen2004; Chen and Dickson Reference Chen and Dickson2008; Dickson Reference Dickson2016; Li Reference Li2004; Tang Reference Tang2005; Tang Reference Tang2016; Truex Reference Truex2017), but the analysis suggests that they refuse to answer these questions at unusually high rates. This is consistent with recent findings by Ratigan and Rabin (Reference Ratigan and Rabinforthcoming), who find high rates of item nonresponse across a number of China surveys.
We can assess patterns across different subgroups within the population, provided the data are not too sparse. Figure 4 shows the self-censorship index for Chinese respondents in the WVS, aggregated by different demographic characteristics. The analysis is also replicated with additional groups for the 2008 China Survey, a nationally representative sample of over 3,000 respondents.

Figure 4. Self-censorship in China by subgroup.
Note: figure shows mean self-censorship index across different population subgroups in the China Survey and China samples of the WVS (Waves 5 and 6). Segments depict 95 per cent confidence intervals.
We find that self-censorship is higher among individuals who are marginalized in contemporary Chinese society: women, members of lower social classes, the less educated, citizens with rural household (hukou) registrations and non-Party members. These patterns hold largely constant across the three samples.Footnote 6 Older respondents in the sample are also more likely to self-censor on the sensitive political questions. For younger respondents – those born in the late 1980's and early 1990s – the ‘Don't Know/No Answer’ rates on sensitive questions are comparable to what we observe in advanced Western democracies. Younger citizens appear to be less socialized into self-censorship.
For authoritarian societies with evidence of self-censorship, naïve descriptions of political attitudes within the population can be problematic (Chen and Dickson Reference Chen and Dickson2008; Dickson Reference Dickson2016; Li Reference Li2004; Tang Reference Tang2005; Tang Reference Tang2016). For instance, the top panel of Figure 5 shows the mean level of confidence/satisfaction in government for the WVS and China Survey, by birth year. A cursory look at the data would lead researchers to the conclusion that older respondents have more favorable views of the regime, as confidence in government declines with birth year (Chen Reference Chen2004; Dickson Reference Dickson2016; Tang Reference Tang2016). Yet we know that older Chinese citizens are also more likely to self-censor, so it is possible (and quite likely) that the elevated confidence levels are the result of less positive individuals opting out of the question entirely, or some inflation of responses.

Figure 5. Regime support and self-censorship by age cohort (China).
Note: figure shows mean self-censorship index across different birth years for Chinese respondents in Waves 5 (2007) and 6 (2012) of the WVS and the 2008 China Survey. Segments depict 95 per cent confidence intervals.
Conclusion
For many authoritarian systems, citizens do not display higher rates of item nonresponse on direct regime assessment questions than their counterparts in democracies. This result suggests such questions may not actually be all that sensitive in many places (Berinsky Reference Berinsky2004), which in turn raises doubts that authoritarian citizens worldwide are widely feigning positive attitudes towards governments they secretly despise (Kuran Reference Kuran1991; Kuran Reference Kuran1997).
The data also show interesting heterogeneity in the authoritarian world, with self-censorship appearing limited in places like Thailand, Zimbabwe and Singapore, and countries like China and Morocco on the opposite end of the spectrum. Our analysis suggests that this variation is driven in part by the presence or absence of electoral competition in the executive branch. In electoral authoritarian regimes, the ruler faces at least some threat of losing office to an organized opposition, and this may give citizens more courage to voice their own opposition (Howard and Roessler Reference Howard and Roessler2006; Levitsky and Way Reference Levitsky and Way2002; Levitsky and Way Reference Levitsky and Way2010; Morse Reference Morse2012; Schedler Reference Schedler2013). Political dynamics are different in China and other closed authoritarian regimes, where the absence of alternatives to the regime may foster the dynamics Kuran (Reference Kuran1991, Reference Kuran1997) describes.
A wide array of tools is now available to assess sensitive political attitudes (Blair and Imai Reference Blair and Imai2012; Blair et al. Reference Blair2013; Bullock, Imai and Shapiro Reference Bullock, Imai and Shapiro2011; Corstange Reference Corstange2009; Gingerich Reference Gingerich2010; Imai Reference Imai2011; Warner Reference Warner1965; Zdep et al. Reference Zdep1979), and the simple index proposed here is another low-cost method that can be scaled easily on pre-existing datasets. One promising avenue would be to probe variation in self-censorship over time: what types of events lead to shifts in item nonresponse rates? Repeated surveys have been implemented in many authoritarian countries (Treisman Reference Treisman2011), and the use of panel data could allow us to see whether repressive events or shifts in political competition affect citizens’ willingness to voice their preferences.
Beyond mapping this variation, the next step in this research agenda should be to probe the psychology behind authoritarian rule. Our intuition is that preference falsification is unnatural, unpleasant and even painful, which is perhaps why we observe low levels of self-censorship in the authoritarian world. Citizens who truly despise the regime may choose to live authentically and voice their discontent, while others may rationalize their way into accepting authoritarianism. Both approaches seem more cognitively sustainable than ‘living within the lie’ (Havel Reference Havel2009).
Supplementary material
Data replication sets are available in Harvard Dataverse at: https://doi.org/10.7910/DVN/OSSY4B and online appendices at: https://doi.org/10.1017/S0007123419000735.
Acknowledgements
Our gratitude goes to Gordon Arsenoff, Winston Chou, Greg Distelhorst, Diana Fu, Haosen Ge, Naoki Egami, In Song Kim, Naijia Liu, Marc Ratkovic, Daniela Stockmann and Yiqing Xu for helpful feedback at various stages of the project, and to Eliot Chen and Michelle Nedashkovskaya for excellent research assistances. All analysis and replication files will be made available on Harvard Dataverse. Any remaining errors are our own.


 Open access