


Introduction
The present, but probably highly inaccurate, estimate of the global abundance of Steller’s Eider Polysticta stelleri is 110,000–125,000 individuals (BirdLife International 2011), of which 10,000–15,000 winter in Europe (Norway, the Baltic, and Kola Peninsula, Russia). This is lower than the estimate of 400,000–500,000 in the 1960s (reviewed in Solovieva et al. Reference Solovieva, Pihl, Fox and Bustnes1998), and even less than the estimate of 200,000–220,000 individuals in early 2000 by Žydelis et al. (Reference Žydelis, Lorentsen, Fox, Kureso, Krasnov, Goryaev, Bustnes, Hario, Nilsson and Stipniece2006).
The main breeding grounds are along the arctic coasts of Alaska and the Siberian part of the Russian Arctic (from Yamal Peninsula to the Kolyma Delta). A few birds breed in European Russia and there are unconfirmed records of breeding in northern Norway (Petersen et al. Reference Petersen, Bustnes and Systad2006).
In the western part of its range, Steller’s Eiders winter in the eastern (ice-free) part of the Barents Sea (coastlines of Finnmark, Norway and Murman coast/Kola Peninsula, Russia), White Sea and in the Baltic Sea. Counts in 1994 suggested that 30–50% of the European population wintered in Russia at that time, but the current status was unknown. The European population was estimated at c.25,000–40,000 individuals in 1994 (Nygård et al. Reference Nygård, Frantzen and Svazas1995a,b), but significant declines have occurred in all European countries since then. In Norway, the species is almost totally confined to Varangerfjord in Finnmark where numbers declined annually by 8% in the period 1984–2003. In Estonia, numbers fell by 9% during 1992–2004 and in Lithuania by 22% during 1996–2003 according to Žydelis et al. (Reference Žydelis, Lorentsen, Fox, Kureso, Krasnov, Goryaev, Bustnes, Hario, Nilsson and Stipniece2006), who estimated the European wintering population at 10,000–15,000 individuals, assuming a similar negative trend in Russia as observed in Norway and the Baltic. However, no systematic annual counts were made in Russian areas to confirm that this was the case.
Because of declines in Alaska and Europe, a Steller’s Eider recovery plan (U.S. Fish and Wildlife Service 2002) and a similar European Action Plan (Pihl Reference Pihl, Schäffer and Gallo-Orsi2001) have been produced for the species.
The reasons for the observed European declines were far from clear and several hypotheses have been put forward to explain the negative trends. A favoured explanation is the winter redistribution of birds from known, well- monitored wintering areas in the west to unmonitored areas in Russia as a result of milder conditions, especially reflected in the annual extent of sea-ice in Russia (Žydelis et al. Reference Žydelis, Lorentsen, Fox, Kureso, Krasnov, Goryaev, Bustnes, Hario, Nilsson and Stipniece2006). Steller’s Eiders have high annual adult survival rates, and show strong wintering and moult-site fidelity (Flint et al. Reference Flint, Petersen, Dau, Hines and Nichols2000), so an increase in mortality (due to habitat loss, food availability, excess hunting, fishing activity, contamination or pollution) seemed a more reasonable explanation than a change in site use. Reduction in reproductive success has also been suggested as a contributory factor (Žydelis et al. Reference Žydelis, Lorentsen, Fox, Kureso, Krasnov, Goryaev, Bustnes, Hario, Nilsson and Stipniece2006).
However, the lack of count data relating to wintering Steller’s Eiders in European Russia has made it difficult to analyse trends and explain the observed declines, necessitating a new total count of the European wintering population, which we report here.
Methods
A coordinated aerial count of wintering Steller’s Eider was conducted in Norway and Russia in 2009. The Norwegian coast was surveyed over two days, covering the coastline from Berlevåg to Vardø on the northern coast of the Varanger Peninsula, the northern Varangerfjord coast from Varangerbotn to Vardø (30 March) and the southern Varangerfjord coast from Varangerbotn to the Russian border (31 March).
The coasts of the Barent’s Sea and White Sea in Russia were surveyed on five different days in the period 24–31 March, covering the Western Kola Bay - Western Murman Coast (27 March), Eastern Kola Bay - Eastern Murman coast (28 March), Eastern Onega Bay - Tersky Coast - Eastern Murman Coast (24 March), Eastern Onega Bay (29 March) and Solovetsky Archipelago - Onega Bay - Dvina Bay (30 March).
The aerial survey in Norway was undertaken with a Bell 206 helicopter following the coastline approximately 300–500 m offshore. Average helicopter speed and height were 82 km/h and 131 m asl respectively on the stretch from Varangerbotn to Vardø, where the density of birds was high. Speed and height for the surveyed stretch on the east and north sides of the Varanger Peninsula with very few birds averaged 121 km/h and 146 m respectively. One observer sat in front with the pilot doing visual counts and taking notes, and a second observer in the back took photographs of the flocks (Canon 40D with Sigma 100–500 mm lens), all in voice contact with each other.
The aerial survey in Russia was undertaken with a Mi-8 helicopter with working speed and height of c.180 km/h and 80 m asl. respectively. The coastline was followed approximately 300–500 m offshore, cutting across mouths of small bays and inlets when in ice free areas. In ice-filled waters, survey routes were chosen to follow the ice edge or to cover polynias. Visual counts were performed by a single observer sitting in the front of the helicopter. Recorded data on species composition and numbers were transferred by intercom to an on-board PC operator. The second observer took digital photos of seabird flocks from the open door on the left side of the helicopter (Canon 20D with Canon 70–200 mm lens).
During the survey period in Russia, information on ice conditions was provided on request by the Ice Center, Arctic and Antarctic Research Institute (AARI), Russia, in the form of high-resolution MODIS images by e-mail one day before the surveys in order to plan a detailed flight route. Such detailed ice information was not necessary in Norway.
Flight routes and helicopter speed as well as location of all observed birds were plotted by GPS, which was synchronised with time on the cameras.
Sex and age ratios of Steller’s Eiders were analysed from photographs. Second calendar year- old males are easily identified based on evident plumage characteristics, while brown, female-looking individuals were aged on the presence or absence of whitish wing bands (especially in flight) and coloration of the tertials. Most flocks would take off and fly when approached by helicopter and age could readily be determined by the presence or absence of wing bands.
In Norway, not all flocks (n = 21) were photographed, so the actual flock size of those not photographed was estimated by the formula y = 1.1331x, calculated by the correlation between the number of birds counted visually and those counted on the accompanying picture. See results for an elaboration of these methodological data. In Russia, no comparison between visual counts and photographs was carried out, so visual count data were used directly in population size estimates.
The population development of the Norwegian wintering population of Steller’s Eider was monitored through annual late winter counts based on ground surveys by car. To evaluate the effectiveness of counts from the shore, a ground-based survey by car was undertaken at the same time as the helicopter survey.
In order to estimate the total population wintering in the Western Palearctic (Russia, Norway and the Baltic), recent literature was searched, the main co-coordinators of national waterfowl and seabird surveys were contacted and they contributed data from their respective countries.
Results
Total count
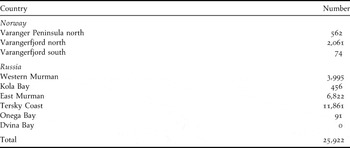
In total, 25,922 Steller’s Eiders were counted, 2,697 in Norway and 23,225 in Russia (Table 1). For Norway this represents a decrease of 57.8% (or -5.6% per year) and for Russia an increase of 47.8% (or +2.6% per year), compared to similar aerial counts conducted in 1994 (Nygård et al. Reference Nygård, Jordhøy, Kondakov and Krasnov1995b). The Norwegian proportion decreased from 28.9% to 10.4% of the total numbers surveyed (Norway + Russia), whereas in Russia, numbers increased from 71.1% to 89.6%.
Table 1. Number of Steller’s Eiders counted along the survey sections in Norway and Russia, March 2009.
Distribution
In Norway, 76% of Steller’s Eiders were concentrated along the northern coastline of the Varangerfjord. In Russia they were found more or less continuously distributed along the ice-free coast from Ponoy River mouth westwards to Rybachy Peninsula, including Kola Bay (Figure 1). Elevated densities were observed east of Svyatoy Nos Cape, where approximately half of the wintering population was concentrated. In Onega Bay, 91 Steller’s Eiders were dispersed in polynias in the south-eastern part of the bay, which is the first record of the species there. Of the surveyed sections, the Tersky Coast accounted for 45.8% of the total (Table 1).
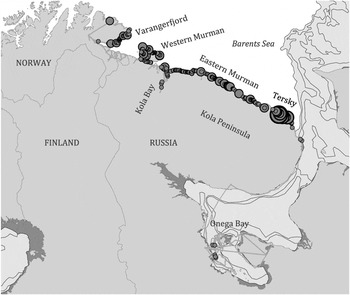
Figure 1. Distribution of Steller’s Eiders mapped through aerial surveys in Norway and Russia, March 2009. Red dots scale as 0-100, 101-500, 501-1,000, 1,001-2,000. Yellow lines show survey routes. Light blue colour is drift ice and dark blue is solid ice connected with the mainland on 2 April 2009.
Demography
Based on c.2,000 pictures taken, 3,920 Steller’s Eiders in Norway and Russia were sexed and aged. A slightly skewed sex ratio was observed, with 52.0% males and 48.0% females. The breeding season in 2008 was poor, with only 0.1% of the aged birds being juveniles (Table 2).
Table 2. Sex and age ratio of Steller’s Eiders in Norway and Russia, March 2009.
Count methodology
In Norway the average flock size was 70.7 individuals based on photos (n = 18, SE = 19.0) and 62.8 for visual counts (n = 18, SE = 16.1) for the same flocks. The correlation between the number of birds counted visually and on photos was highly significant (P < 0.001, r 2 = 0.9313, y = 1.1331x), although the tendency to underestimate flock size increased with increasing flock size (P = 0.002, r 2 = 0.4066, y = 0.1834x - 5.128) even when the observer was aware of the problem beforehand. The average flock size underestimate for visual counts was 11.1% (average 7.8 individuals, n = 18, SE = 5.5). Correcting for the underestimates, average flock size in Norway was 59.4 individuals (n = 41, SE = 14.7). The total underestimate for visual counts from helicopter for Norway was thus 15.5%.
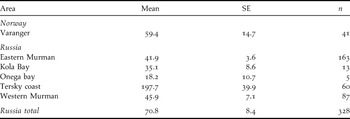
Average flock size in Russia was 70.8 (n = 328, SE = 8.4), although with significant variation between the survey sections (P < 0.000, F = 15.04, df = 4; Table 3). The largest observed flock consisted of 2,000 individuals.
Table 3. Flock size in Steller’s Eiders, March 2009.
To be able to control for methods, a simultaneous land-based survey undertaken by car along the fjord from Varangerbotn to Vardø in the Varangerfjord, Norway, found 1,236 Steller’s Eiders. This is 40% fewer than the 2,061 birds counted during the aerial survey on the similar partial count section.
Western Palearctic population size
The coastlines of the Baltic countries were not part of the survey in March 2009. However, enquiries to key seabird researchers, experts and contacts in those countries generated good overall count coverage. In Estonia an annual winter survey has been carried out since 1975, giving reasonable coverage in this important country. The total number of Steller’s Eider wintering in the Western Palearctic in 2009 was estimated at 27,042, in a year with virtually no young, based on 23,225 in Russia (85.9%), 2,697 in Norway (10.0%), 40 in Finland (0.1%) , 20 in Sweden (< 0.1%), 1,000 in Estonia (3.7%) (Kuresoo in prep.), 10 in Latvia (< 0.1%) and 50 in Lithuania (0.2%).
Discussion
This survey confirms no major change in numbers of Steller’s Eiders wintering in the Western Palearctic since the mid-1990s, but demonstrates a major redistribution, with 86% now wintering in Russia compared to 30–50% in 1994 (Nygård et al. Reference Nygård, Frantzen and Svazas1995a,b, Žydelis et al. Reference Nygård, Jordhøy, Kondakov and Krasnov2006).
Žydelis et al. Reference Žydelis, Lorentsen, Fox, Kureso, Krasnov, Goryaev, Bustnes, Hario, Nilsson and Stipniece2006 considered several likely explanations for the observed declines in Norway and the Baltic and assumed a similar decline in Russia. Shifts in wintering distribution to unknown sites, redistribution in response to climatic factors such as extent of sea ice, changes in bird survey methods and uneven coverage were considered potential explanations. Changes in adult mortality due to habitat loss, illegal hunting, fishing activity/drowning, contamination or pollution were discussed, together with possible changes in reproductive output, although annual data on the proportions of young birds from Finland in spring showed no trend for the years 1975–1995.
Those authors confirmed a significant correlation between the winter NAO index and the change in numbers from one year to the next in Norway that might indicate a shift from Norwegian (and Baltic) wintering areas to Russian wintering areas closer to the breeding grounds (Žydelis et al. Reference Žydelis, Lorentsen, Fox, Kureso, Krasnov, Goryaev, Bustnes, Hario, Nilsson and Stipniece2006). A satellite telemetry study based on 20 birds caught during winter in Norway showed that these did not belong to a discrete breeding population, but spread throughout potential summering areas and tundra breeding habitats from Varangerfjord to the Taimyr Peninsula in the following summer (Petersen et al. Reference Petersen, Bustnes and Systad2006). In the subsequent winter, three out of eleven returning birds (27%) did not return to Varangerfjord, but wintered along the Kola Peninsula coast. The satellite tracking was also unable to demonstrate clear relationships between breeding, wintering and moult aggregations, which confirmed the findings of Dau et al. (Reference Dau, Flint and Petersen2000) who found signs of subpopulation structuring amongst Steller’s Eiders using moulting areas in the Pacific population.
Ringing recovery data from Russia showed a significant increase in migration distance from the period 1961–1970 (mean 2,517 km) to 1971–1980 (3,078 km) and 1991–2000 (3,336 km) (Dobrynina and Kharitonov Reference Dobrynina, Kharitonov, Boere, Galbraith and Stroud2006), which fits with the observed increase in Norway and Baltic from the 1980s and up to the mid-1990s. Unfortunately no data were available for the last 10-year period when the population has undergone a reduction in numbers along the Baltic/Norwegian coasts.
In light of the changes in distribution and numbers we have no good explanation for the observed patterns. Changes in the extent of ice-coverage in the Barents Sea are likely to influence the distribution patterns. Since the maximum in 1979, there was an overall decrease in ice until the early 1990s when the extent increased with a new maximum in 1998–1999. Since then the ice coverage has steadily decreased (data from Ice-service, the Norwegian Meteorological Institute). Annual winter count data (data provided by A. Kuresoo) from 1975 to 2007 in Estonia was not significantly correlated with total amount of sea ice (monthly average in December–February) in the Barents Sea (P = 0.53, r 2 = -0.113, n = 33), as was neither the case with winter count data from Norway (Nygård et al. Reference Nygård, Frantzen and Svazas1995a,b, Žydelis et al. Reference Nygård, Jordhøy, Kondakov and Krasnov2006, Norwegian national winter monitoring programme) (P = 0.89, r 2 = -0.030, n = 25). However, the counts carried out in Norway have partly been undertaken by unskilled observers and in some years did not cover the whole survey section, thus creating noise around the validity of the time-series data. Another source of variation is detection probability. As demonstrated in the present study, a substantial number of birds present were not observed during the ground survey, and how this varies between years and meteorological conditions is unknown and should be studied further.
The survey results confirm the need for improved coordinated monitoring of the winter distribution and abundance of Steller’s Eiders in the Western Palearctic. Ideally, an annual survey along the lines presented here should be undertaken, together with an annual assessment of the sex and age ratio to contribute to modelling the population dynamics. This is even more important in light of the ongoing large-scale changes in habitat and climatic conditions (both in terrestrial and marine ecosystems) due to climate warming (Møller et al. Reference Møller, Fiedler and Berthold2010). Modelling studies on Spectacled Eider Somateria spectabilis and Steller’s Eider suggest that a warming of 4–6° C by AD 2040 would likely expand the potential nesting habitat of both species (Fox Reference Fox2010); however, due to the complex effects of climate warming on the food supply and predators, it is at present impossible to predict if such changes will be beneficial or not, even more reason to monitor distribution, abundance and demographics of this iconic northern species.
Acknowledgements
Our gratitude goes to Morten Ekker at the Norwegian Directorate for Nature Management (DN) for invaluable help during the survey. Nick Hughes at the Ice-service, the Norwegian Meteorological Institute, kindly provided ice data from the Barents and White Seas within the survey period and additional long-trend data (1979–2008) of ice distribution in the Barents Sea. Vladimir Bessonov from the Ice Center, Arctic and Antarctic Research Institute (AARI), Russia, kindly provided ice data based on high-resolution MODIS images to plan the aerial survey in Russia. We thank SPARC+ aviation enterprise and the Mi-8 helicopter pilots for good service and cooperation during survey flights in Russia and similarly to Arctic Helicopter Service AS in Norway. Mindaugas Dagys in Lithuania, Andres Kuresoo in Estonia, Antra Stīpniece in Latvia, Petteri Tolvanen and Martti Hario in Finland and Leif Nilsson in Sweden kindly provided winter population estimates and advice about Steller’s Eiders in their respective countries. The survey was financed by the Norwegian Ministry of the Environment (MD) and DN through the bilateral Environmental Cooperation Agreement between Norway and Russia. We are grateful to Prof. Anthony D. Fox and an anonymous referee for valuable contributions to the final manuscript.


