Introduction
In the November 2017 issue of Microscopy Today, our laboratory published an article indicating that longer exposure times with lower light intensities reduced photo-toxicity to live cells [Reference Mubaid and Brown1]. In particular, fluorescence wide-field imaging experiments showed that employing longer exposure times with lower light powers drastically reduced photo-bleaching and increased cell migration and cell protrusion speeds without impacting image quality. Further investigation into this phenomenon pointed us to the issue of illumination overhead (IO). IO is the time fluorescent samples are exposed to incident light, but fluorescence emission is not being collected by the detector [Reference Kiepas2]. IO leads to excessive light exposure to the sample with no improvement in image quality. The authors were aware of IO when the Microscopy Today article was published in 2017, but not the extent of the problem. Since then additional experiments have been conducted to further investigate the impact of IO. Importantly, photo-bleaching and photo-toxicity were not due to increased incident light power.
Modern light sources for fluorescence microscopy, such as light-emitting diodes (LEDs), can be electronically switched on and off within a few milliseconds [Reference Bosse3,Reference Nishigaki4]. This technological advancement has significantly reduced photo-bleaching and photo-toxicity during fluorescence microscopy by changing the way sample illumination is controlled. In the past, mechanical shutters were required to regulate sample exposure time for bulb-based light sources. When using shutters, the microscope software synchronizes shutter opening with camera acquisition time. Image acquisition software introduces a delay so that camera acquisition does not begin until the shutter is fully open (https://www.microscopyu.com/applications/live-cell-imaging/the-automatic-microscope). This ensures uniform illumination across the entire field of view; however, samples are exposed to extra illumination (IO) beyond the camera exposure time. The amount of IO samples experience is a function of shutter speed. In contrast, most newer microscopes are equipped with LED-based light sources, and sample illumination is largely controlled by electronic triggering. Electronic activation of light sources is significantly faster than physical shutter speeds, resulting in a dramatic reduction in IO [Reference Kiepas2]. Triggering can be achieved in two ways: (1) the microscope software directly triggers the light source through a USB connection to the device; or (2) the microscope software initiates camera acquisition, which in turn triggers the light source through a transistor-transistor logic (TTL) circuit.
In this follow-up study, the complexity of IO and interval imaging with USB and TTL triggering was explored. IOgenerated more reactive oxygen species (ROS) when shorter exposure times were used, complementing the results of our original work. The percent of IO decreased with longer exposure times; however, the amount of IO samples experienced was not constant across all exposure times. Additionally, results showed that the light source had to be disconnected from the microscope software for TTL light triggering to function properly; otherwise, hardware and software delays continued to contribute significantly to IO. Finally, although TTL successfully eliminated IO, hardware and software delays continued to impact the acquisition interval resulting in inaccurate time resolution of experiments.
Materials and Methods
Cell culture.
CHO-K1 cells stably expressing paxillin-EGFP were obtained from the lab of Dr. Rick Horwitz (University of Virginia, Charlottesville, VA). Cells were grown in low glucose (1.0 g/L) Dulbecco's modified Eagle's medium (DMEM; cat. no. 11885-084, Thermo Fisher Scientific), supplemented with 10% fetal bovine serum (FBS; cat. no. 10082-147, Thermo Fisher Scientific), 1% non-essential amino acids (NEAA; cat. no. 11140-050, Thermo Fisher Scientific), 25 nM 4-(2-hydroxyethyl)-1-piperazineethanesulfonic acid (HEPES; cat. no. 15630-080, Thermo Fisher Scientific), and 1% penicillin-streptomycin (cat. no. 10378-016, Thermo Fisher Scientific). Cells were maintained in 0.5 mg/mL Geneticin-418 (G418; cat. no. 11811-031, Thermo Fisher Scientific) antibody selection to maintain paxillin-EGFP expression.
MCF7 cells were obtained from the American Type Culture Collection (ATCC; cat. no. HTB-22). Cells were grown in high glucose (4.5 g/L) DMEM (cat. no. 319-005-CL, Wisent Bioproducts), supplemented with 10% FBS (cat. no. 12483-020, Gibco) and 1% penicillin-streptomycin (cat. no. 450-201-EL, Wisent Bioproducts).
Measurements of exposure time.
A digital oscilloscope (DS1054Z; Rigol, Beijing, China) coupled to a DET36A/M Si Based Detector (Thorlabs, Dachau, Germany) was used to measure the total illumination time delivered through a Plan ApoChromat 20 × 0.8 NA objective lens on a Zeiss AxioObserver fully automated inverted microscope (Carl Zeiss, Jena, Germany). An XCite 120LED light source (Excelitas Technologies, Waltham, MA) was used to deliver excitation light via the microscope software (ZEN pro, version 2.6). The light source was electronically triggered via a USB cable connection between the computer and the light source (scenario 1) or a TTL cable between an Axiocam 506 camera (Carl Zeiss) and the light source (scenarios 2 and 3). In the latter case, the USB cable between the computer and the light source was either connected (scenario 2) or disconnected (scenario 3). A variety of camera exposure times (24–60,000 ms) and acquisition intervals (25–500 ms) were input into the microscope software, and the light output was recorded.
The oscilloscope was also used to measure the total illumination time delivered through an HC PLAN APO 20 × 0.7 NA objective lens on a Leica DMI6000B inverted microscope equipped with a Quorum WaveFx-X1 spinning disk confocal system (Quorum Technologies, Guelph, ON). A 561 nm diode laser was used to deliver excitation light via an acousto-optic tunable filter (AOTF) crystal controlled by MetaMorph software (version 7.10.2.240; Molecular Devices, Sunnyvale, CA). The AOTF crystal was controlled by USB triggering. Voltage traces were captured with interval imaging or stream to random access memory (RAM) acquisition. Camera exposure time was set to 100 or 200 ms. The acquisition interval was set to 0 ms.
Voltage traces obtained from the oscilloscope were analyzed in MATLAB (version 9.8.0, Rel. 2020a; The MathWorks, Natick, MA). IO was determined by subtracting the desired (input) exposure time from the actual (output) exposure time. Dividing IO by input exposure time yielded percent IO.
Measurements of power.
A PM400 Optical Power and Energy Meter with an S170C Microscope Slide Power Sensor (Thorlabs) was used to measure incident light intensity through oil immersion objective lenses: Zeiss PlanApo 63 × 1.4 NA on the AxioObserver and Leica HCX PL APO 63 × 1.4 NA on the spinning disk confocal microscope. Measurements were performed on three separate days and averaged.
ROS production in response to photo-bleaching.
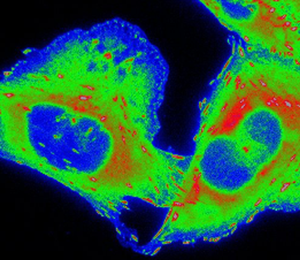
CHO-K1 cells expressing paxillin-EGFP were seeded onto μ-slide 8-well plates (cat. no. 80821, IBIDI, Fitchburg, WI) coated with 0.21 µg/cm2 fibronectin (cat. no. F-0895, Sigma-Aldrich) diluted in 1x phosphate-buffered saline (PBS). Cells were allowed to adhere and grow under exponential conditions for at least 12 h prior to experimentation. Cells were then stained with 0.83 µM CellROX™ Deep Red (cat. no. C10422, Thermo Fisher Scientific). Images were acquired on the Zeiss AxioObserver with a PlanApo 63× 1.4 NA oil immersion objective lens and Chamlide TC-L-Z003 stage top environmental control incubator (Live Cell Instrument, Seoul, South Korea). An XCite 120LED was used to deliver excitation light through an EGFP filter cube (filter set 10; 450-490 nm excitation, 515-565 nm emission; Carl Zeiss) at three different intensities: 21.3 mW, 10.8 mW and 0.476 mW. Image acquisition settings were adjusted to maintain a constant number of photons impacting the sample during camera exposure time without taking IO into consideration (21.3 mW x 24 ms, 10.8 mW x 48 ms, 0.476 mW x 1060 ms). The light source was USB triggered through the microscope software. CellROX™ was imaged before and after paxillin-EGFP photo-bleaching (400 frames) with a total light dose of 1030 mW × ms delivered through a Cy5 filter cube (filter set 49006; 590–650 nm excitation, 662–737 nm emission; Chroma Technologies, Bellows Falls, VT). Exposure time was set to 1000 ms. Paxillin-EGFP and CellROX™ images were pseudo-colored (Rainbow RGB) in ImageJ (NIH, Bethesda, MD) to emphasize changes in fluorescence intensity. The intensity scale is the same for all image panels for each fluorophore (Figure 1).

Figure 1: CHO-K1 cells expressing paxillin-EGFP were seeded onto fibronectin-coated dishes and stained with CellROX™ Deep Red Reagent. Paxillin-EGFP was repeatedly imaged for 400 frames with USB triggering of the light source. Three different light doses were chosen: 21.3 mW × 24 ms, 10.8 mW × 48 ms, and 0.476 mW × 1060 ms. Light power and exposure time were adjusted such that the total light dose per frame remained constant (~250 W × ms × cm−2); in other words, the amount of light on the sample during the camera image acquisition time was constant between conditions. CellROX™ was imaged before and after paxillin-EGFP acquisition to measure ROS production. Images were pseudo-colored to highlight changes in paxillin-EGFP and CellROX™ intensity. Scale bar is 10 µm.
Lysosomal dynamics.
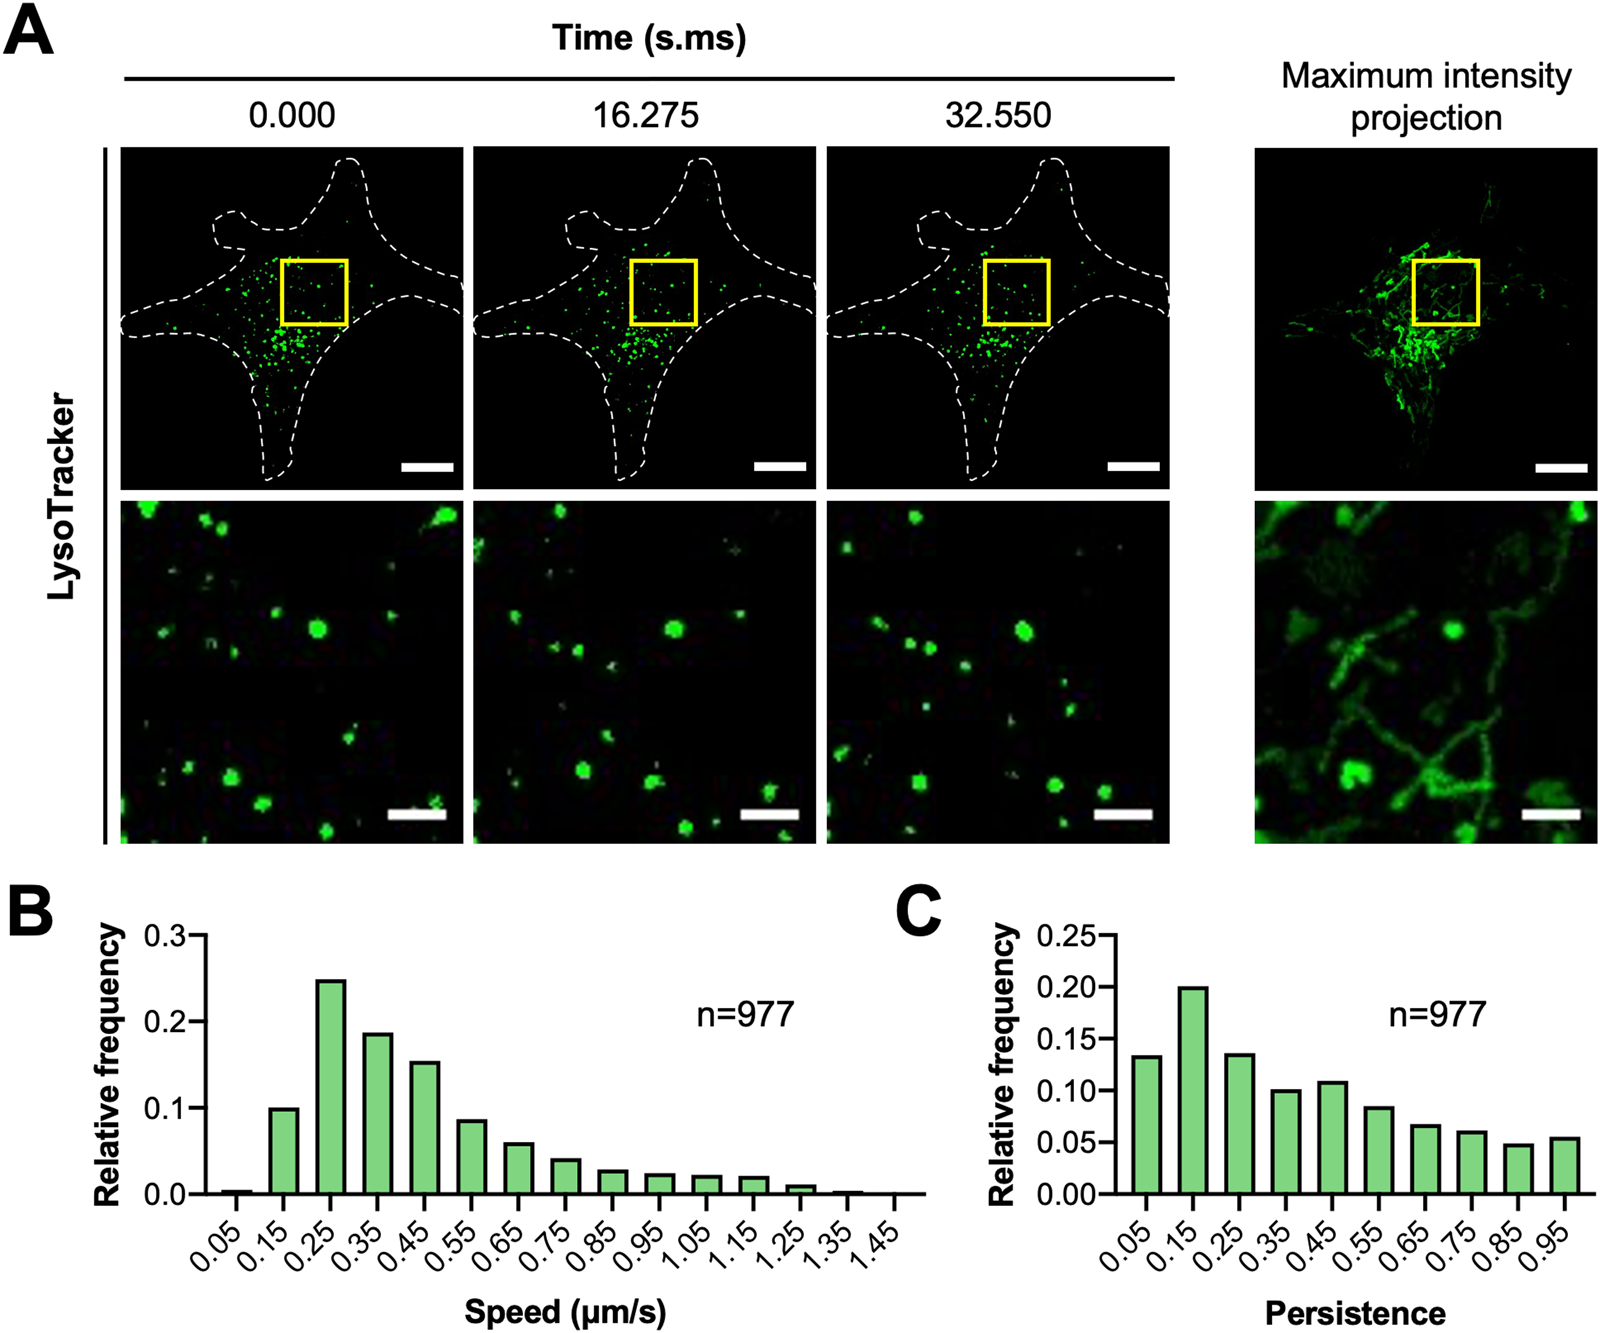
MCF7 cells were seeded onto μ-dish 35 mm high glass bottom dishes (cat. no. 81158, IBIDI) coated with 5 µg/cm2 fibronectin (cat. no. FC010, EMD Millipore) and stained with 200 nM LysoTracker™ Green DND-26 (cat. no. L7526, Thermo Fisher Scientific). Cells were imaged on the spinning disk confocal microscope with a Leica HCX PL APO 63× 1.40 NA oil immersion DIC objective lens, Prime BSI sCMOS camera (Photometrics, Tuscon, AZ), and CU-501 stage-top incubator system (Live Cell Instrument, Seoul, South Korea). Each cell was illuminated with a 491 nm diode laser set to ~0.02 mW. Stream to RAM acquisition in MetaMorph was used to acquire images continuously for over 30 seconds. Camera exposure time was set to 200 ms with 2 × 2 pixel binning (1pixel = 0.1172 μm × 0.1172 µm). IO was found to contribute an additional 17 ms delay resulting in a time resolution of 217 ms. The pinhole size of the spinning disk was fixed at 50 µm.
Image stacks were imported into Imaris (version 9.2.0; Bitplane, AG, Zurich, Switzerland) to track the position of lysosomes over time. Lysosomes were masked with the Spots function using an estimated diameter of 0.5 µm and local background subtraction. An autoregressive motion algorithm with a maximum distance of 1 µm and gap size of 3 frames was used to follow lysosomes. Data were then exported to MATLAB to quantify speed and persistence. Tracks less than 15 frames (3.255 s) were removed by filtering. Average speed was calculated from mean change in x,y position between each time point. Persistence was calculated by dividing the net displacement of each vesicle track after 15 frames by the total distance traveled. Data from three cells were then pooled together and plotted as frequency distributions using Prism 8 (version 8.4.2; GraphPad Software, San Diego, CA).
Results
Sample illumination with LED light sources can be controlled through the microscope software by (1) opening and closing a mechanical shutter, (2) electronically triggering the light source via a USB cable connection, or (3) electronically triggering the light source via a TTL cable from the camera to the light source. We previously observed that electronic activation of the light source is ~20-fold faster than opening/closing mechanical shutters [Reference Kiepas2]. Therefore, we focused on USB and TTL triggering of the light source in the present article. USB and TTL turn the light source on and off at approximately the same rate [Reference Kiepas2]. A notable advantage of USB triggering is that it allows the microscope software to modify the properties of the light source (for example, light power; for multiple LEDs they can be turned on and off selectively, programmed for different exposure times). In contrast, TTL triggering relies on an electronic circuit between the camera and the light source; when the camera begins acquiring an image, a current is sent to the light source to turn it on. This is an all-or-nothing event, meaning that the light source turns on to a preset user-defined intensity. However, if both USB and TTL cables are connected to the light source, light intensity can be adjusted in the microscope software prior to TTL triggering. Thus, it may be useful to have both connections to the light source, especially if performing multi-color and multi-dimensional acquisition.
Based on this information, we tested three different settings on a Zeiss AxioObserver equipped with an X-Cite 120LED: TTL triggering of the light source with the USB cable (1) disconnected or (2) connected, and (3) USB triggering of the light source with the TTL cable disconnected. TTL effectively synchronized and limited light exposure to the camera image acquisition time within a millisecond or so (Figure 2, top panel). Although USB triggering is equally effective in turning the light source on and off [Reference Kiepas2], light exposure time was almost six times longer with USB triggering when compared to TTL (Figure 2, bottom panel). Consequently, USB and TTL triggering of the light source are not equivalent. Interestingly, the USB cable had to be disconnected from the microscope software for TTL triggering to work properly; even if TTL override was enabled, the exposure time was three times longer when the microscope software detected the light source via the USB connection (Figure 2, middle panel). This suggests that determination of IO time is complex, as it can arise from both hardware and software delays. IO is an especially important issue for live cell microscopy, as the extra illumination time with USB triggering results in a significant amount of photo-bleaching and ROS production [Reference Kiepas2]. The impact of IO is more drastic when shorter exposure times with higher light powers are used as the relative contribution of IO to photo-bleaching and photo-toxicity is greater. For example, when 400 images of paxillin-EGFP were collected with high-power illumination light and a 24 ms exposure time, the sample was illuminated almost six-fold longer (138 ms) for each of the 400 images collected. This resulted in significant ROS production (Figure 1). However, when low-power light was used with 1060 ms exposure times, the contribution of IO was only 10–20%, so there was minimal ROS accumulation even after collecting 400 images (Figure 1).
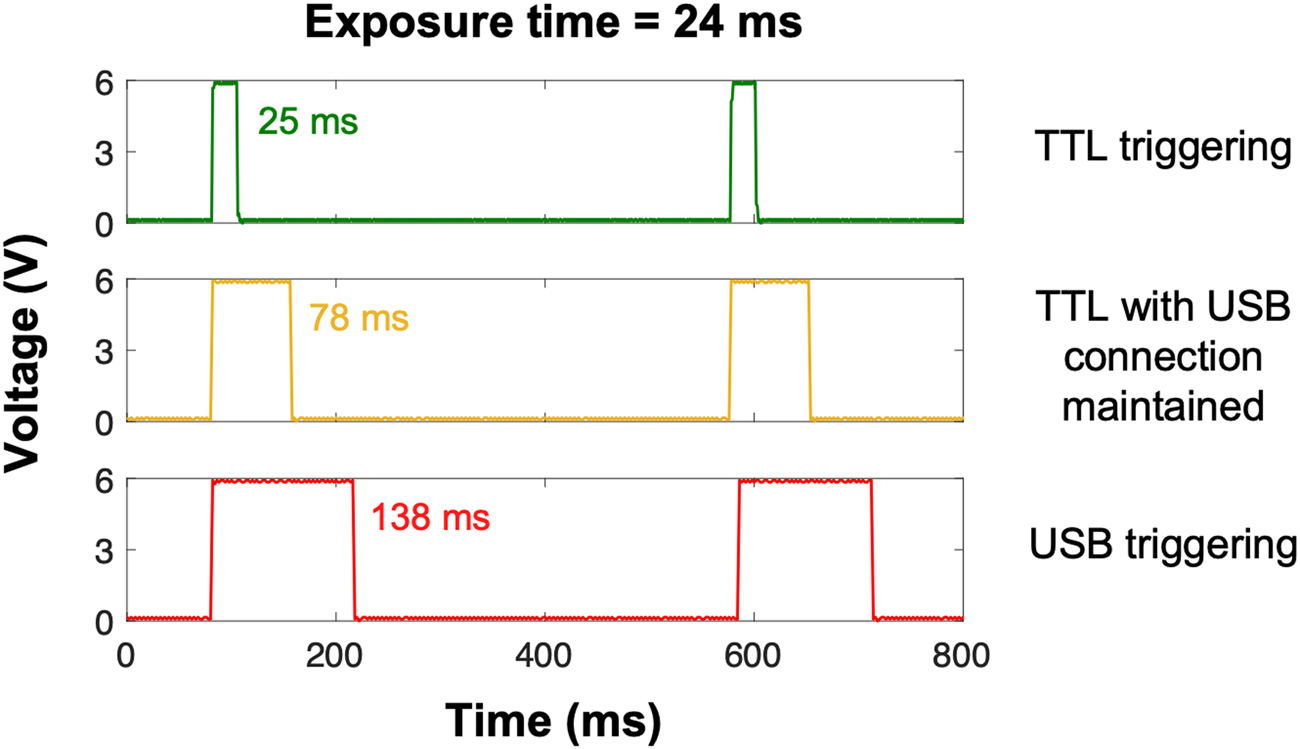
Figure 2: Oscilloscope measurements showing sample illumination time. Experiments were conducted on a Zeiss AxioObserver microscope running ZEN pro software (version 2.6). An X-Cite 120LED light source was triggered with TTL while the USB connection between the microscope computer/software and light source was disconnected (green trace) or connected (yellow trace), and USB directly while the TTL cable was disconnected (red trace). Exposure time was set to 24 ms in the microscope software; imaging interval was set to 500 ms.
Further in-depth experiments exploring the issue of IO revealed that the amount of additional sample illumination was not constant but varied with changes in exposure time. Indeed, longer exposure times exhibited longer IO when USB triggering was used, with some variability in the times (Figure 3). Nevertheless, the percentage contribution of IO decreased with longer exposure times, resulting in healthier live cell imaging conditions [Reference Kiepas2]. Thus, the conclusion of our Microscopy Today article (that is, longer exposure times with lower light power are less photo-toxic) still stands and is especially important if IO is significant. This is especially true for mercury or metal-halide light sources that cannot be electronically switched on and off but rely on mechanical shuttering. If fluorescence light sources, such as LEDs, can be directly triggered by TTL to limit light exposure of the sample to the camera exposure time, then higher light powers and shorter exposure times are compatible with live cell imaging experiments. It should be noted that increased photo-bleaching was not caused by increased incident light power in our set of experiments [Reference Kiepas2]. It is possible that the production of ROS over shorter periods of time with high light power could overwhelm cellular systems designed to remove ROS and cause photo-toxicity in live samples; however, further experimentation is required to determine if this is indeed the case.

Figure 3: Oscilloscope measurements of sample illumination time compared to input exposure time. An X-Cite 120LED light source was USB triggered through ZEN pro software (version 2.6). The amount of IO changed with exposure time.
Another important observation from our studies was that hardware and software delays can also negatively impact the image acquisition interval. When a sufficiently long imaging interval was set in the microscope software, TTL triggering was able to capture images at the desired time resolution (Figure 4A, top panels in black). Unfortunately, imaging intervals below a certain value could not be realized, even though the time resolution was theoretically possible (Figure 4A, bottom panels in red). Moreover, the minimum imaging interval appeared to vary with exposure time and did not change in a systematic way (Figure 4B). This is especially problematic when imaging dynamic cellular processes that occur on the millisecond to second time scale. As a result, it is recommended that users verify the time resolution of their experimental system using an oscilloscope or accurate software time stamps indicating exactly when the images were saved. Some hardware and software delays can be mitigated with stream acquisition if it is available in the image acquisition software. In this case, stream acquisition with temporary data storage on random access memory (RAM) allowed rapid imaging with a 5.005 ms delay between images (data not shown). Similar results were obtained on a spinning disk confocal system; stream acquisition reduced IO from ~42 to ~17 ms [Reference Kiepas2]. Furthermore, stream acquisition allowed subsequent images to be captured with no time delay beyond ~17 ms of IO (Figure5). Longer exposure times with lower light levels and stream acquisition allowed for the simultaneous capture of images of EB3-mEmerald and H2B-mCherry with high time resolution (200 ms camera exposure time plus 17 ms IO) with no apparent photo-bleaching [Reference Kiepas2]. These parameters could also be used to quantify the speed and persistence of lysosomes using LysoTracker™ Green staining (Figure 6).

Figure 4: (A) Time lapse experiments were performed with TTL triggering of the X-Cite 120LED light source. Several camera acquisition intervals were chosen: 500 ms, 100 ms, 50 ms, and 25 ms. Camera exposure time was set to 24 ms. (B) Time lapse experiments in (A) were repeated with various camera exposure times: 48 ms and 100 ms. The image acquisition interval was set to 100 ms.

Figure 5: Oscilloscope measurements of sample illumination time. Experiments were conducted on a Leica DMI6000B inverted microscope equipped with a Quorum WaveFx-X1 spinning disk confocal system running MetaMorph software (version 7.10.2.240). A 561 nm laser was electronically triggered with an AOTF crystal. Interval imaging resulted in ~42 ms IO and ~100 ms delay between images. Stream acquisition resulted in ~17 ms delay between images (in the form of IO).

Figure 6: (A) MCF7 cells were seeded onto fibronectin-coated dishes and stained with LysoTracker™ Green DND-26. Images were collected on the spinning disk confocal microscope using stream acquisition and a 63 × 1.4 NA oil immersion objective lens. A 491 nm laser (~0.02 mW) was used to excite LysoTracker™. Camera exposure time was set to 200 ms. Scale bars are 10 µm for whole-cell images and 2 µm for magnified images. (B,C) Lysosome positions were tracked and quantified for speed and persistence. Frequency distributions show pooled data for lysosomes from three cells. N indicates the number of lysosomes analyzed.
Discussion and Conclusions
Overall, our results indicate that IO is a highly complex issue that appears to be caused by hardware and software delays. These hardware and software delays are likely unique to every microscope [Reference Davis5]. Thus, there are many factors that contribute to additional sample illumination (as seen here with USB triggering) and extended image acquisition intervals with TTL triggering. Camera software drivers, computer processing speeds, computer components (video cards, RAM, CPU), software versions, and connections between the computer and microscope components all likely affect IO and image acquisition intervals. The complexity is clear. Indeed, microscopists have previously noted that faster image acquisition can be achieved by imaging a smaller region of interest (ROI) on the camera chip, and the acquisition speed can vary depending on the physical location of the ROI on the chip (https://andor.oxinst.com/learning/view/article/what-is-cropped-sensor-mode) [Reference Almada6]. Efforts are currently underway to design hardware and software for improved high-speed synchronization of multiple devices (https://micro-manager.org/wiki/Hardware-based_Synchronization_in_Micro-Manager) [Reference Colville7,Reference Edelstein8]. In the meantime, microscopists should measure imaging parameters with an oscilloscope to determine the impact of IO and adapt image acquisition parameters for healthy live cell imaging conditions while maintaining time resolution and accurate time intervals for time lapse imaging.
Acknowledgements
We thank Dr. Marco Biondini and Leeanna El-Houjeiri (McGill University, Montreal, QC) for preparing MCF7 cells stained with LysoTracker™ Green. Work performed in the author's laboratory (CMB) was supported by grants from the National Sciences and Engineering Research Council (NSERC) (Grant #493616-16, #386084-12) and CIHR (Grant #CPG-146475). AK acknowledges support in the form of a Fonds de Recherche Santé (FRQS) doctoral studentship. Imaging experiments were performed at the McGill University Advanced BioImaging Facility (ABIF).