


Metabolic syndrome (MetS) is a cluster of conditions that occur together, leading to increased risk of CVD, heart diseases, stroke and type 2 diabetes(Reference Kaur1). MetS involves at least three out of five metabolic conditions including hypertension, glucose intolerance, central obesity, decreased HDL-cholesterol or increased TAG levels(2). The estimated prevalence of MetS among adults in most countries worldwide is around 20–30 %(Reference Grundy3). With economic development and urbanisation, the prevalence of MetS in adults increased from 10·5 % in 2009 to 14·4 % in 2014 in China(Reference Lan, Mai and Zhou4,Reference Xi, He and Hu5) based on the definition of China guideline for type 2 diabetes (2017)(2). Therefore, MetS has been considered as one of critical public health concerns in China.
Dietary intake, along with lifestyle, has been one of the major modifiable determinants in the development of chronic diseases(Reference Micha, Penalvo and Cudhea6,Reference Newby and Tucker7) . Alcohol consumption, one of the most common human cultures and lifestyles, is associated with an increased risk of MetS(Reference Vieira, Luft and Schmidt8). However, some studies show that alcohol consumption has a favourable impact on medical components of MetS, contributing to a lower risk of developing MetS(Reference Fan, Cai and Li9,Reference Stoutenberg, Lee and Sui10) . Recent systematic review and meta-analysis studies suggest that moderate red wine consumption is beneficial to CVD(Reference Stephan, Almeida and Markoski11) and diabetes(Reference Baliunas, Taylor and Irving12).
To our best knowledge, the association between alcohol consumption and MetS in Zhejiang province has not been well investigated and reported. The objectives of our study are to investigate the prevalence of MetS among adults in Ningbo, Zhejiang province and explore the association between frequency of alcohol consumption status and MetS and its components.
Methods
Study design and population
The current study was a baseline study of the Ningbo Adult Chronic Diseases and Risk Factors cohort survey, conducted in Ningbo, the economic center of Zhejiang province in 2015 by the Ningbo Center for Disease Control and Prevention (CDC). The baseline survey monitored the prevalence of non-communicable chronic diseases and associated risk factors in a representative sample of adults in Ningbo. A multistage, random cluster sampling procedure was utilised to draw the target samples, which covered socio-economic status (SES), demography and health aspects in both urban and rural areas. Urban and rural areas were based on the definition proposed by the Ningbo government. The eleven cities/counties of Cixi, Yuyao, Ninghai and Xiangshan are categorised into rural areas and the remaining regions (Beilun, Fenghua, Jiangbei, Jiangdong, Haishu, Yinzhou and Zhenhai) are urban areas. City, town and county were stratified by income (low, middle and high) in Ningbo. Three street blocks or counties were selected at each city/town level as the primary sampling unit. Two administrative communities/villages were selected as the secondary sampling unit at each city, town and county levels. One residency region was randomly selected as the third sampling unit. Around 105 household families were randomly selected as the fourth sampling unit. Around 630 participants, including 480 interviewees and 150 backup candidates, were randomly selected in each monitoring site. Ideally, 5280 participants would have been recruited in the survey with 1650 backup candidates. In the end, 5160 individuals, aged 15-74 years, who had been living in Ningbo for at least 5 years participated in this survey.
In this current study, participants who were at least 20 years old, not pregnant or lactating during data collection and not suffering from mental and physical diseases, were included in the final data analysis.
Dietary intake assessment
A validated FFQ was used to collect dietary information. This questionnaire is widely used across the whole of China, which was designed and validated by experts from the Chinese Center for Disease Control and Prevention.
This validated FFQ consisted of a 16-item dietary questionnaire. Items included seasoning [salt, MSG (a common condiment in China), edible oil and soya sauce], vegetables and fruit (dark and light), drinks (water, tea, coffee and alcohol), dietary behaviour (home-prepared meals, eating out, Western meal and traditional Chinese meals). Details of the questionnaire were reported somewhere(Reference Kong, Li and Xu13).
Participants were asked to report on their dietary intakes for the past month, including the average consumption of salt, MSG, edible oil and soya sauce for each meal and daily frequency and average consumption of dark vegetables (e.g. spinach, tomatoes and purple cabbage), light vegetables (e.g. wax gourds and white radish), dark fruit (e.g. oranges, mangoes and kiwi fruit) and light fruit (e.g. apples, pears and bananas). Dietary intakes for the last year included the monthly intake of tea and coffee and daily drink of water (about 200 ml per cup/glass). Participants were also asked about dietary behaviours for the past week activities such as the frequency of eating out including breakfast, lunch, dinner and snacks.
The quality of data collection was checked by comparing reasonable daily dietary intake. The individual was asked about their food consumption to resolve these discrepancies, where significant discrepancies were found. Regarding all the missing reports, individuals were visited up to a maximum of three times for filling in all the missing parts. Those who could not be reached for those missing reports were excluded from the participant list in the study.
All of the participants were asked to report on their alcohol consumption per month for the past year with four choices provided: (1) non-drinking or less than 1–2 times/month, (2) 1–2 times/week, (3) more than 3 times/week and (4) everyday. Because of the low numbers of participants reporting non-drinking or drinking less than 1–2 times/month and drinking every day, alcohol consumption was divided into two groups: less or non-drinkers and frequent alcohol drinkers. Alcohol consumption more than 12 drinks/month was categorised as frequent alcohol consumption, which was defined based on the standard alcohol consumption proposed by Ningbo Center for Disease Control and Prevention.
Anthropometric measurement
Participants were measured in their underwear and barefoot twice by a registered nurse based on the standard China national human health monitoring – health measurement (WS/T424-2013) during randomly selected fieldwork visits. Body weight was measured using an electronic scale to the nearest 0·1 kg, and height was measured using a metal column height metre to the nearest 0·1 cm. Waist circumference (WC) was measured at midpoint between the costal margin and iliac crest in the mid-axillary line while participants were standing upright (upper clothes were raised to enable measurement of WC on the skin or underwear). Mean weight, height and WC were calculated based on two measurements. Thereafter, BMI was calculated as mean weight (kg)/mean height (m2). Participants were classified into four BMI categories according to China Obesity Task Force as follows: underweight (< 18·5 kg/m2), normal weight (18·5–23·9 kg/m2), overweight (24·0–27·9 kg/m2) and obesity (≥ 28·0 kg/m2) (14).
Biomarker measurement
Blood pressure (BP) was measured, following the standard China national human health monitoring – health measurement (WS/T424-2013), both at the right upper limb brachial artery and in a seated posture by an electronic BP metre. Before the measurement, participants were asked to rest for 5–10 min. Each participant needed to have their BP measured three times at 30 s intervals. The average BP was calculated based on these three measurements.
Participants who were involved in the blood sampling were asked to fast after 20.00 the previous day. Fasting blood glucose was measured by the modified hexokinase enzymatic method. Total cholesterol, TAG and HDL-cholesterol were measured enzymatically using commercial reagents, and LDL-cholesterol was calculated by the Fried Ewald equation(Reference Allain, Poon and Chan15).
Definition of metabolic syndrome
MetS is defined based on the China guideline for type 2 diabetes – 2017 version(2), as three or more of the following five medical components: (a) abdominal obesity: WC, men ≥ 90 cm; women ≥ 85 cm; (b) fasting blood glucose ≥ 6·1 mmol/l and/or diagnosed with diabetes; (c) BP: systolic BP (SBP) ≥ 130 mmHg and/or diastolic BP (DBP) ≥ 85 mmHg and/or and/or diagnosed with hypertension; (d) fasting TAG ≥ 1·70 mmol/l and (e) fasting HDL-cholesterol < 1·04 mmol/l.
Socio-economic status and lifestyle-related factors
Participants were asked to fill out a validated questionnaire about their SES, designed and validated by the Chinese Center for Disease Control and Prevention. SES includes education [lower secondary education; vocational, technical or high school; higher education (bachelor, master or above)]; employment (unemployed, employed, student and retired), geography (urban and rural) and monthly household income per capita (< $295, $295–370, $370–440, $440–515 and > $515).
Additionally, lifestyle factors such as smoking and physical activity (PA) were reported by participants. Smokers were defined as having smoked at least twenty packs of cigarettes per month for more than 6 months. Participants provided their PA level (frequency and time of moderate-intensity PA) and sedentary lifestyle. Total moderate-intensity PA throughout the week was categorised based on the daily adult PA recommendation proposed by China Nutrition Society(16).
Statistical analysis
Descriptive analysis was presented as prevalence, mean and se. The participants’ MetS components and prevalence of MetS were compared between monthly less or non-alcohol drinkers and frequent alcohol drinkers. The prevalence of MetS and the mean of the individuals’ MetS components were compared between less or non-alcohol drinkers and frequent alcohol drinkers by χ 2 test and z-test, respectively. Multivariable logistic regression and generalised linear models (linear model) were used to assess associations between frequency of alcohol consumption status (independent variable) and MetS (categorical variable; dependent variable) and MetS components (continuous variables; dependent variables), respectively. Associations were investigated via three models: (1) model 1: adjusting for confounding factors (age, gender, geography, education and employment); (2) model 2: adjusting for confounding factors and lifestyle (PA and smoking status) and (3) model 3: further adjusting for BMI, salt, edible oil and interactions. Interactions were examined between independent variables and confounding factors. Interactions were only retained in model 3 if they was statistically significant.
Results were considered statistically significant at a two-tailed level of 0.05. Statistical analysis were conducted using the STATA statistical software package version 15 (2017).
Results
In total, 2853 recruited individuals (44 % men) participated in this study completing a FFQ together with valid demography, lifestyle and medical information. Approximately 13·7 % of participants were senior generation (≥ 65 years) and 48·4 % of participants were living in rural areas (Table 1). The majority of participants (59·7 %) were in the group with lower secondary education or no education and 23·1 % of individuals had higher education. In this study, 66·8 % of individuals were employed. In relation to lifestyle, only around 23·0 % of individuals were defined as smokers and 29·9 % of individuals were frequent alcohol drinkers. About 51·1 % of individuals had sufficient moderate-intensity PA. Regarding health outcomes, 32·9 and 9·3 % individuals were defined as overweight and obesity, respectively. Moreover, for the medical components, around 24·6, 40·3, 14·3, 43·0 and 37·0 % of participants were categorised as having abdominal obesity, hypertension, hyperglycaemia, hypertriglyceridaemia and low HDL-cholesterol value, respectively. About 28·0 % of participants were defined as MetS.
Table 1 Socio-demographic characteristics of Chinese adults living in Ningbo city (n 2853)
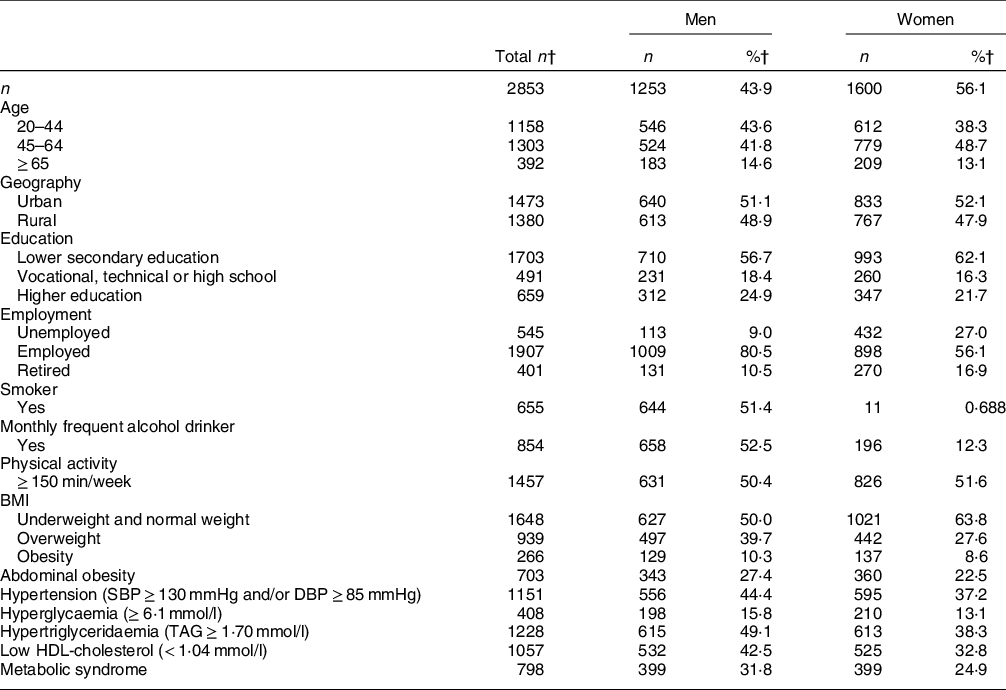
SBP, systolic blood pressure; DBP, diastolic blood pressure.
† Data was presented as number and percentage.
Table 2 shows the prevalence of MetS and its components among less or non-alcohol drinkers and frequent alcohol drinkers. Compared with less or non-alcohol drinkers, frequent alcohol drinkers showed a significantly higher prevalence of MetS. Conversely, individuals in the group of less or non-alcohol drinkers showed a significantly higher prevalence of medical components with less than three medical conditions. Regarding mean values of MetS components, frequent alcohol drinkers had significantly higher mean values of MetS components with an exception for HDL-cholesterol compared with their counterparts (Table 3).
Table 2 Prevalence of metabolic syndrome and medical components of metabolic syndrome based on alcohol consumption status

MetS, metabolic syndrome.
* Statistical value was obtained from χ 2 test.
† MetS score: 0, less than 3 medical components; 1, 3 medical components; 2, 4 medical components; 3, 5 medical components.
Table 3 Mean levels of metabolic syndrome components† according to alcohol consumption

MetS, metabolic syndrome; WC, waist circumference; FBG, fasting blood glucose; SBP, systolic blood pressure; DBP, diastolic blood pressure.
* Statistical value was obtained from z-test.
† Adjusted for gender, age, geography, education, employment, physical activity, smoking status, daily salt intake and daily oil intake.
The association between MetS and alcohol consumption was examined by multivariable logistic regression (Table 4). The results show that significances were found in model 1 and model 3. In model 3, participants with frequent alcohol consumption had 1·6 times higher odds of developing MetS after adjusting for confounding factors, lifestyle factors, BMI, salt, edible oil and interaction in contrast to participants with less or non-alcohol consumption. Additionally, associations of medical components of MetS were further examined by generalised linear models (Table 5). Frequent alcohol consumption was significantly associated with medical components of MetS in the model 1 with an exception for HDL-cholesterol level. After further adjusting for lifestyle factors, HDL-cholesterol came to be significant, and SBP and TAG became non-significant in model 2. Only WC was statistically non-significant. Therefore, frequent alcohol consumption was positively associated with all the medical components with an exception for WC.
Table 4 Odds ratios (95 % confidence intervals) of MetS according to alcohol consumption

MetS, metabolic syndrome.
* All the models were examined by multivariable logistic regression. Model 1, confounding factors adjusted; model 2, confounding factors + lifestyle adjusted; model 3, further adjusted for BMI, salt, oil and interaction.
† Less or non-alcohol consumption is reference in the models.
Table 5 Association of medical components of metabolic syndrome with alcohol consumption

MetS, metabolic syndrome; WC, waist circumference; FBG, fasting blood glucose; SBP, systolic blood pressure; DBP, diastolic blood pressure.
* All the models were examined by generalised linear models. Model 1, confounding factors adjusted; model 2, confounding factors + lifestyle adjusted; model 3, further adjusted for BMI, salt, oil and interaction.
† Less or non-alcohol consumption is reference in the models.
Discussion
In this large population-based study, associations of MetS and medical components of MetS were examined with alcohol consumption among Chinese adults living in Ningbo, Zhejiang province. About 31 % of participants were defined as having MetS. With regard to the category of alcohol consumption, frequent alcohol drinkers had higher odds of developing MetS. In addition, frequent alcohol consumption was significantly associated with medical components of MetS, excepting WC.
MetS is highly prevalent in Ningbo due to its rapid economic growth, industrialisation and influence of westernisation. High prevalence of MetS among Chinese adults is consistent with the results of observational studies(Reference Jiang, Liu and Wu17,Reference Li, Liao and Yu18,Reference Xu, Qiao and Huang19) . In addition, a high prevalence in the current study has reached a similar prevalence level of MetS in adults worldwide (20–30 %) (Reference Eckel, Grundy and Zimmet20), is higher than that among European adults (24·3 %)(Reference Scuteri, Laurent and Cucca21) but is relatively lower compared with American adults (34·7 %)(Reference Aguilar, Bhuket and Torres22).
Epidemiological studies indicate that increased alcohol consumption is associated with elevated risk of MetS(Reference Vieira, Luft and Schmidt8,Reference Choi, Kim and Lee23) . A recent result from the Korea National Health and Nutritional Examination Survey carried out with a large study population reported that frequent alcohol consumption was associated with higher prevalence of MetS and its components in men compared with non-alcohol drinkers(Reference Oh, Kim and Han24), which supports our findings. However, some studies suggest that light to moderate alcohol consumption is associated with lower prevalence of MetS(Reference Vieira, Luft and Schmidt8,Reference Stoutenberg, Lee and Sui10,Reference Choi, Kim and Lee23) , although alcohol consumption is strongly suggested to have negative effects on morbidity and mortality of liver diseases and cancers(Reference Lachenmeier, Przybylski and Rehm25,Reference Kondili, Taliani and Cerga26) . One result of this meta-analysis study indicated that light alcohol consumption may be associated with a reduced risk of MetS(Reference Sun, Ren and Liu27). Sun and his colleagues reported that heavy drinking (> 35 g/d) increased the risk of MetS, while light drinking (0·1–5 g/d) decreased the risk of MetS(Reference Sun, Ren and Liu27). Likewise, a cross-sectional study from the Third National Health and Nutrition Examination Survey conducted in the USA indicated that mild to moderate alcohol consumption is associated with a lower prevalence of MetS(Reference Freiberg, Cabral and Heeren28). Light and moderate red wine consumption has been found to have beneficial effects on CVD due to a bioactive polyphenol acting as antiarrhythmic properties and an inhibitor of both intracellular Ca release and pathological signalling cascades(Reference Bonnefont-Rousselot29). Therefore, alcohol patterns and dose of alcohol consumption may play a significant role in health impacts.
Alcohol consumption is suggested to result in a high risk of MetS via increasing WC, BP, fasting blood glucose and blood lipids(Reference Oh30-,Reference Tolstrup, Heitmann and Tjonneland32). Our study shows that mean values of medical components were significantly higher among frequent alcohol drinkers. In additional, frequent alcohol consumption was positively associated with medical components, excepting WC, compared with non-alcohol drinkers. A 3-year follow-up study conducted on Korean men showed that higher frequent alcohol consumption was positively associated with increasing risk of MetS via abdominal obesity, impaired fasting glucose and hypertriglyceridaemia(Reference Kim, Kim and Kang33), which is partially supporting our findings.
Based on the fact that alcohol provides energy intake increasing appetite, stimulating food intake and affecting satiety, alcohol may promote weight gain and body composition with unbalanced energy intake and energy expenditure(Reference Yeomans34). One cross-sectional population study showed that total alcohol intake was positively associated with BMI and WC in both Danish men and women, but not frequent alcohol consumption(Reference Tolstrup, Heitmann and Tjonneland32). In the current study, we found that frequent alcohol consumption was positively associated with WC in comparison with less or non-alcohol consumption, after adjusting for confounding and lifestyle factors. However, significance disappeared after further adjusting for BMI, salt, oil and interaction. Similarly, Wakabayashi observed weaker or no associations between frequency of alcohol consumption and BMI/ WC in Japanese men (45–70 years)(Reference Wakabayashi35). Interestingly, the previous Danish study indicated that the most frequent drinkers with light consumption had the lowest odds ratios for being obese(Reference Tolstrup, Heitmann and Tjonneland32). Likewise, the result of the European Prospective Investigation into Cancer and Nutrition (EPIC) – Potsdam study showed that light to moderate beer consumption leads to smaller WC and body weight gain in men(Reference Schutze, Schulz and Steffen36). Therefore, obesity can be dependent on dose of alcohol consumption and alcohol pattern.
Evidence shows that high frequency of alcohol consumption is positively associated with an increased risk of hypertension(Reference Oh, Kim and Han24,Reference Xin, He and Frontini37) . Frequent alcohol consumption was associated with an increased 2·4 mmHg SBP and 1·4 mmHg DBP in model 3. Our findings are in line with one recent study from the Korea National Health and Nutritional Examination Survey from 2007 to 2013(Reference Oh, Kim and Han24). The Korea national survey conducted on Korean adults also examined the association between MetS and frequency of alcohol consumption, indicating that higher frequent alcohol consumption was associated with odds of high BP(Reference Oh, Kim and Han24). The potential mechanisms can be elevated sympathetic nervous system activity(Reference Arkwright, Beilin and Vandongen38) and involving nitric oxide as an important endogenous vasodilator regulating blood pressure(Reference Toda and Ayajiki39).
Alcohol consumption may play a key role in the regulation of lipid profile and plasma lipoprotein metabolism(Reference Frohlich40). Frequent alcohol consumption was positively associated with both TAG and HDL-cholesterol level compared with less or non-alcohol consumption in our study. A community-based cohort study conducted on Korean adults showed that frequent alcohol consumption was associated with higher TAG and lower HDL-cholesterol in men compared with non-alcohol drinking in men(Reference Oh, Kim and Han24). This Korean study is partially in line with our findings. Despite the different timing of alcohol consumption, this Korean study indicated that gender as a confounding factor may be an important influential factor, which can explain the effect of sex hormone on chronic diseases(Reference Taylor and Sullivan41). A recent Mendelian randomisation analysis including 8364 general Japanese participants suggested that alcohol may increase HDL-cholesterol level and decrease LDL-cholesterol level(Reference Tabara, Arai and Hirao42). The possible mechanism is that apolipoprotein (Apo) A-I synthesis is achieved in the liver as a major site and alcohol can increase ApoA-I production in transformed human hepatocytes(Reference Dashti, Franklin and Abrahamson43-Reference Ikewaki, Zech and Kindt45). Therefore, the increased circulating levels of ApoA-I and ApoA-II can better explain an increase in HDL-cholesterol as ApoA-I and ApoA-II are the two major proteins in HDL(Reference Ikewaki, Zech and Kindt45,Reference De Oliveira, Foster and McGee Harper46) . However, the mechanism is still unclear.
Furthermore, in terms of glucose homoeostasis, alcohol consumption may destroy glycaemic control and elevated fasting serum glucose concentration due to β-cell dysfunction and alcoholic steatohepatitis(Reference Kim, Kim and Kang33). Several previous studies support the hypothesis that higher frequent alcohol consumption is associated with greater insulin sensitivity and decreased insulin concentration(Reference Oh, Kim and Han24,Reference Barrio-Lopez, Bes-Rastrollo and Sayon-Orea47) . Nevertheless, the mechanism of the associations between alcohol consumption and glucose metabolism and insulin sensitivity are yet complex and unclear. Frequent alcohol consumption was positively associated with fasting blood glucose. A previous cross-sectional study including healthy Shanghai adults, in agreement with our findings, showed a positive association between alcohol consumption and fasting plasma glucose compared with non-alcohol drinking(Reference Fan, Cai and Li9).
The Chinese dietary guideline in 2016 for alcohol consumption recommends not to exceed 25 g/d and 15 g/d for men and women, respectively, and the exact dose of alcohol consumption based on alcohol patterns(16). Although our study did not examine the quantity of alcohol consumed per day, highly frequent alcohol consumption may be responsible for hypertension, hyperglycaemia and hypertriglyceridaemia, eventually causing MetS and related chronic diseases due to drinking behaviour and extra energy intake from other food sources. Alcohol consumption has been proven to enhance appetite and increase food intake(Reference Yeomans34), thus can affect long-term energy storage and inhibit fat oxidation(Reference Yeomans, Caton and Hetherington48). Appropriate strategy and policy are necessarily applied for reducing alcohol production in industries, alcohol consumption in public and alcohol-related problems. Public information campaigns and school-based education should get more attention to educate local adults and children as to the importance and consequences of alcohol dose and patterns and their effects on the related health and social problems.
Strength and limitation
The current study was the baseline study of a cohort survey. It presented the local dietary behaviour and culture among Ningbo citizens. Information of anthropometric and biomarkers were measured by a well-experienced registered nurse using standardised procedures.
Nonetheless, some limitations of this study need to be considered. First, causality cannot be inferred according to the nature of cross-sectional study design. Second, 2853 out of 5160 participants were included in the current study due to selection criteria. This may not be perfectly representative of local dietary intakes, although participants were recruited from all eleven cities/counties covering demography and SES. Then, alcohol consumption was determined using a standardised FFQ. Self-reported consumption via FFQ may differ from actual alcohol consumption, especially in our study, when dietary information was gained via interviews. Thus, participants might misreport their information due to socio-economics status and might therefore be biased towards misreporting. In addition, patterns and amounts of alcohol consumption were not assessed in this current study, which may result in evaluating imprecise alcohol consumption and misleading associations between MetS and its components. Moreover, total energy intake was not adjusted in the multivariable logistic regression and generalised linear models for investigation of association between MetS and its medical components and alcohol consumption. Therefore, it may affect the accurate result of associations.
Conclusion
Around 31 % individuals were defined to have MetS in the current study. A higher prevalence of MetS was observed in the group of frequent alcohol drinkers in comparison with less or non-alcohol drinkers. Frequent alcohol consumption was associated with high odds of developing MetS and positively associated with medical components with an exception for WC. Since alcohol consumption may increase higher the risk of MetS, hypertension, diabetes and cancers, leading to all-cause mortality, an alcohol restriction initiative needs to be executed for public health promotion and its clinical importance. Moreover, future studies need to investigate causality of alcohol patterns and dose of alcohol consumption using a prospective cohort design.
Acknowledgements
Acknowledgements: The authors thank all the participants involved in the survey. The authors thank Centers for Disease Control and Prevention in Ningbo for their support of data collection and they thank School of Economics, Faculty of Humanities and Social Sciences, University of Nottingham Ningbo China to support this research collaboration. The authors thank Mr. Jose M Grisolia for the English proofreading of the manuscript. Financial support: This study was supported by Ningbo Science & Technology Bureau [No. 2019A610391], Ningbo Health Branding Subject Fund [No. PPXK2018-10] and the Science and Technology Planning Project of Ningbo [No. 2017C50045]. Conflict of interest: All authors have read and approved the final manuscript. All authors declare no conflicts of interest. Authorship: Y.L. contributed to conception, design, statistical analyses, data interpretation and drafted manuscript writing. Q.G. and H.L. contributed to the study design, reviewed and organised the field work. S.L., Y.Y. and S.W. were responsible for the field work, data collection and quality control. All authors reviewed the final manuscript and approved it for submission. Ethics of human subject participation: This study was conducted according to the guidelines laid down in the Declaration of Helsinki, and all procedures involving research study participants were approved by the Ningbo Center for Disease Control and Prevention (no. 201702). Written informed consent was obtained from all subjects. Verbal consent was witnessed and formally recorded.


