


Associations between high levels of ferritin, the major Fe storage protein, which is also an acute-phase protein, and type 2 diabetes have been described in cross-sectional and prospective studies( Reference Orban, Schwab and Thorand 1 , Reference Bao, Rong and Rong 2 ). Both Fe deficiency and Fe overload have been associated with CVD( Reference Lapice, Masulli and Vaccaro 3 ). An association between body Fe stores and the metabolic syndrome (MetS), a cluster of vascular, metabolic and anthropometric abnormalities, has also been identified( Reference Abril-Ulloa, Flores-Mateo and Solà-Alberich 4 ). Deleterious effects on insulin signalling as a consequence of pro-oxidant effects have been suggested as a potential underlying mechanism( Reference Fernandez-Real, Lopez-Bermejo and Ricart 5 ). However, the nature of the relationship between Fe status and cardiometabolic status remains unclear, and exploration of additional aspects of Fe metabolism has been recommended( Reference Zhao, Li and Liu 6 ).
There are other important proteins involved in Fe metabolism in addition to ferritin, such as transferrin and transferrin receptors (TfR)( Reference Aisen, Wessling-Resnick and Leibold 7 , Reference Trinder and Baker 8 ). TfR are of particular interest as they act as a sensor for body Fe demands. Fe transport in the plasma is carried out by transferrin, which transfers Fe to cells through its interaction with a specific membrane receptor – the TfR. A soluble form of the TfR has been identified in human serum. Soluble transferrin receptor (sTfR) is a truncated monomer of the tissue receptor, lacking its first 100 amino acids, which circulates in the form of a complex of transferrin and its receptor. The higher the body Fe stores, the lower the TfR in cell membranes, which in turn down-regulates intestinal Fe absorption( Reference Ganz and Nemeth 9 ). Increased numbers of TfR in cell membranes reflect body Fe deprivation and intestinal Fe absorption is up-regulated as a compensatory mechanism. Levels of serum sTfR are proportional to tissue concentrations( Reference Cook, Skikne and Baynes 10 ). sTfR and ferritin are influenced by the acute-phase response of inflammation, and therefore their evaluation should include additional measurements of inflammatory markers( Reference Kæstel, Aaby and Ritz 11 ).
Type 2 diabetes and CVD are multi-factorial disorders, and the exploration of potential new risk factors such as Fe metabolism is necessary in order to obtain information about modification of cardiometabolic risk and for a better understanding of the underlying mechanisms in the aetiology. The association between sTfR and cardiometabolic risk factors has not been widely investigated. A recent meta-analysis reported conflicting results regarding the association between sTfR and type 2 diabetes in eight studies and described the limited power of the included studies due to small sample sizes( Reference Orban, Schwab and Thorand 1 ). Only one study has described the association between sTfR and the MetS( Reference Hamalainen, Saltevo and Kautiainen 12 ) but did not adjust for BMI, and two studies have described the association between sTfR and some MetS components( Reference Montonen, Boeing and Steffen 13 , Reference Aderibigbe, Pisa and Mamabolo 14 ). Most of these studies reported no evidence of an association with the MetS and very few associations with MetS components. Our primary aim was to investigate whether sTfR levels are associated with the MetS, its components, insulin resistance and glycosylated Hb (HbA1C) in a relatively large, well-characterised population. We also describe the association between ferritin and the MetS, its components, insulin resistance and HbA1C.
Methods
Participants
Participants were identified from the 10001 Dalmatians research programme, originating from the sub-cohort recruited from the island of Vis in Croatia. A total of 1029 subjects were initially included, aged 18–93 years, who were recruited from the villages of Vis and Komiza during 2003 and 2004 within a larger genetic epidemiology study( Reference Vitart, Rudan and Hayward 15 – Reference Rudan, Marusić and Janković 17 ). In the original study, the only eligibility criterion was being 18 years or older. sTfR and ferritin levels were measured in 774 subjects, of whom forty-nine subjects with missing values for covariates (age, fibrinogen, HbA1C, smoking status and alcohol consumption, BMI and history of cardiometabolic disease) were excluded, leaving a study population of 725 people. Distributions of exposure, adjustment variables and outcomes were similar in people with and without missing data with the exception of fibrinogen levels, which were higher in people without missing data. Ethics approval was issued by the multi-centre research ethics committee for Scotland (MREC) under designation MREC 01/0/71, and all participants gave their written informed consent.
Clinical and anthropometric measurements
Anthropometric measurements included height, measured using a stadiometer, weight and waist circumference (WC) (measured halfway between the lowest rib and the iliac crest). Blood pressure was measured in a seated position, after at least 5 min of rest. Two measurements were made, and only the second one was recorded, in order to reduce the ‘white coat’ effect. Menopausal status was defined on the basis of self-report, with premenopausal status defined by continuing menstruation and postmenopausal status by lack of menstruation. For physical activity, a self-perceived report on physical activities at work and at leisure on a four-point rating scale (sitting, light, moderate and hard) was used.
Biochemical measurements
Blood samples were collected after overnight fasting. Classical biochemical analyses of the blood samples included the following: determination of TAG using UV photometry with glycerolphosphate-oxidase (Olympus kit OSR60118); HDL-cholesterol using the homogeneous enzyme method with modified polyethylene glycol and acyclohexane sulphate (Olympus kit OSR6195); glucose using UV hexokinase photometry; and HbA1C (whole-blood sample) using cation exchange, immunochemistry electrophoresis and affinity linking that is compatible with the Diabetes Control and Complications Trial (DCCT) and the United Kingdom Prospective Diabetes Study (UKPDS) standard. The measurements of HbA1C and glucose were performed using Olympus kit OSR6192, OSR 6121 and OSR6221. The manufacturer’s reagents were used, along with their internal quality controls (ODC003 or ODC004 for glucose and ODC022 for HbA1C). Fibrinogen was measured by the Clauss method using MDA 180 coagulometer (Biomerieux) with reagents from the manufacturer. The calibrant used was the 8th British Standard (NIBSC). Electrochemiluminescence immunoassay (Roche) was used to measure ferritin and Tina-quant® immunoturbidometry (Roche) was used for sTfR. The laboratory was ISO accredited and daily internal controls were performed (calibrator 66300). Repeated measurements of the sub-set of samples provided very high agreement (κ 0·92 for the lowest pair of estimates). The CV was <5 % for each biochemical measurement. The biochemical assays were conducted using an OLYMPUS AU400 chemistry immunoanalyser. Insulin resistance was estimated by the homoeostatic model assessment using the following formula: glucose levels (mmol/l)×insulin mU/l per 22·5( Reference Matthews, Hosker and Rudenski 18 ).
Metabolic syndrome
Cut-off points from the international consensus definition for the MetS were used as follows( Reference Alberti, Eckel and Grundy 19 ): TAG ≥1·7 mmol/l, HDL-cholesterol <1·0 mmol/l in men and <1·3 in women, glucose ≥5·6 mmol/l (or drug treatment for elevated glucose), systolic blood pressure (SBP) ≥130 mmHg and/or diastolic blood pressure (DBP) ≥85 mmHg (or antihypertensive drug treatment), and WC ≥94 cm in men and ≥80cm in women. As information on lipid-lowering medications was not available to complement the component of high TAG, the MetS definition used in this study represents a modified definition of the international consensus criteria. The MetS was defined as the presence of three or more variables meeting the definitions above.
Data analysis
The analyses were stratified by sex/menopausal status and by adjusting for the group of sex/menopausal status (premenopausal women as reference/postmenopausal women/men) in analyses of the whole cohort. All continuous study variables were summarised as medians (interquartile ranges) by sex/menopausal status and differences were tested using the Mann–Whitney U test. Logistic regression models were used to describe the associations between sTfR and ferritin as exposure variables with the MetS and its components as outcome variables. sTfR and ferritin were used as continuous variables in terms of standard deviation units of their log-transformed levels (Z scores or standardised values) to facilitate interpretation of OR. Odds of each outcome are therefore described for each standard deviation in log-transformed Fe marker. Multivariable models with age, levels of fibrinogen, smoking status (never smoker, ex-smoker, current smoker), alcohol consumption (no/yes) and BMI as covariates were used to investigate whether the associations were independent of these potential confounding factors. This set of confounding factors was chosen on the basis of possible influence of acute-phase or subclinical inflammation in terms of fibrinogen levels( Reference Bardini, Dicembrini and Cresci 20 , Reference Temelkova-Kurktschiev, Siegert and Bergmann 21 ) and general adiposity on levels of Fe markers and/or outcome variables. In the case of associations with WC, BMI was included as a covariate to investigate the role of central adiposity reflected by WC independently of the effect of general adiposity reflected by BMI. Relationships between measures of Fe status and insulin resistance and HbA1C were described using Pearson’s correlation, and multiple linear regression analyses were used to adjust for potential confounders as listed above with additional adjustment for treatment with insulin and/or hypoglycaemic drugs (yes/no). Evaluation of non-linear relationships with insulin resistance was performed using ANOVA and ANCOVA to describe the association between tertiles of Fe markers and homoeostatic model assessment insulin resistance (HOMA-IR) values tests. The normality of distributions was assessed using histograms and Kolmogorov–Smirnov tests. For linear regressions, Pearson’s correlation and ANCOVA analyses, transformed values of skewed variables were used as follows: logarithm of sTfR, ferritin, HOMA-IR values, BMI and fibrinogen values, square of age and square root of HbA1C. The above set of arithmetic functions allowed the best approximation to normal distribution for each variable. Self-reported CVD (heart attack, stroke) and diabetes as well as self-reported physical activities at work and at leisure (sitting (reference), light, moderate and hard) were additionally used as covariates in sensitivity analyses. In order to avoid collinearity, treatment with insulin and/or hypoglycaemic drugs (yes/no) was not considered in the multivariable model when diabetes was used as the covariate. A P value <0·05 was considered statistically significant. Data were analysed using Stata version 11.0 (StataCorp LP).
Results
The present study included a total of 725 subjects, stratified into three groups by sex/menopausal status (Table 1). Men had higher values of ferritin than women, whereas postmenopausal women had higher values of ferritin than premenopausal women. Postmenopausal women had significantly higher levels of sTfR than men, whereas the comparison with premenopausal women was not significant (Table 1). HOMA-IR was higher in men and postmenopausal women than among premenopausal women with a similar pattern observed for the MetS components. Prevalence of high WC was >60 % in all groups (Table 1). Prevalence of the MetS was higher in postmenopausal women than in men and premenopausal women (Table 1).
Table 1 Distribution of iron status and cardiometabolic risk by sex and menopausal statusFootnote * (Medians and interquartile ranges (IQR); numbers and percentages)

sTfR, soluble transferrin receptor; SBP, systolic blood pressure; DBP, diastolic blood pressure; WC, waist circumference; MetS, metabolic syndrome; HOMA-IR, homoeostatic model assessment for insulin resistance; HbA1C, glycosylated Hb.
* Comparison between groups by Mann–Whitney U and χ 2 test.
† Includes additionally individuals who reported current use of oral hypoglycaemic medications or insulin regardless of fasting glucose values.
‡ Includes additionally individuals who reported current use of antihypertensive medications regardless of BP values.
The prevalence of the MetS in the whole population was 48·7 % and 34·3 % among individuals without cardiometabolic disease (CVD and/or diabetes) (data not shown).
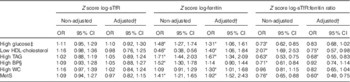
There was no statistically significant association between standardised values of sTfR and the MetS and its components in any of the sex/menopausal status groups (Table 2) or in the whole sample (Table 3). As high prevalence of some components could limit the power of the study to detect an association with sTfR, we additionally conducted linear regression analyses between log-sTfR and log-transformed values of WC, HDL-cholesterol, glucose, TAG, SBP and DBP. The unadjusted linear regressions showed only associations with log-glucose (β=0·18 (95 % CI 0·002, 0·37), P=0·047) and log-WC (β=0·12 (95 % CI 0·02, 0·22), P=0·015) in men, log-TAG in premenopausal women (β=0·32 (95 % CI 0·01, 0·63), P=0·041), and log-WC (β=0·15 (95 % CI 0·05, 0·25), P=0·002) in postmenopausal women, but after adjustments there were no significant associations (online Supplementary Table S1). Further adjustment for treatment with insulin and/or hypoglycaemic drugs in associations with glucose and for antihypertensive medication in associations with SBP and DBP did not alter the significance of the above findings (data not shown).
Table 2 The metabolic syndrome and its components per sex-/menopausal status-specific sd of the iron markers in the study subjects categorised by sex and menopausal status (Odds ratios and 95 % confidence intervals)

BP, blood pressure; WC, waist circumference; MetS, metabolic syndrome.
* Significant associations (P<0·05).
† Age, fibrinogen levels, smoking status (yes/no/ex-smoker) and alcohol consumption (no/yes).
‡ Includes additionally individuals who reported current use of oral hypoglycaemic medications or insulin regardless of fasting glucose values.
§ Includes additionally individuals who reported current use of antihypertensive medications regardless of BP values.
║ Fifty-nine cases were omitted because in the category of ex-smokers all of the subjects had high WC.
Table 3 The metabolic syndrome (MetS) and its components per sd of iron markers in the whole sample (Odds ratios and 95 % confidence intervals)
BP, blood pressure; WC, waist circumference.
* Significant associations (P<0·05).
† Age, fibrinogen levels, smoking status (yes/no/ex-smoker), alcohol consumption (no/yes), and sex/menopausal status (premenopausal women/ postmenopausal women/men).
‡ Includes additionally individuals who reported current use of oral hypoglycaemic medications or insulin regardless of fasting glucose values.
§ Includes additionally individuals who reported current use of antihypertensive medications regardless of BP values.
Standardised values of ferritin were significantly associated with higher odds of having the MetS components (except high blood pressure) in men, in unadjusted models and after adjusting for age, fibrinogen levels, alcohol intake and smoking (Table 2). Ferritin was significantly associated with the MetS in men and postmenopausal women (Table 2). In the whole sample, the adjusted associations found for ferritin and the MetS and its components were similar to those reported in men (Table 3).
In a separate analysis for women adjusting for menopausal status, sTfR was not associated with the MetS or its components, and ferritin was independently associated with high TAG and the MetS (online Supplementary Table S2).
We performed additional evaluation of associations between the MetS and its components and standardised values of sTfR:ferritin ratio (online Supplementary Table S3). A lower ratio reflects higher Fe status on the basis of increased Fe stores with respect to low Fe demand in tissues. In general, the associations for sTfR:ferritin ratio were similar to those described for ferritin (Table 2).
STfR levels correlated positively with insulin resistance in postmenopausal women and men, and this relationship remained statistically significant in linear regression analyses (Fig. 1) with associations in two of the three strata remaining significant after adjusting for covariates: postmenopausal women (β=0·34 (95 % CI 0·05, 0·63), P=0·020) and men (β=0·44 (95 % CI 0·14, 0·75), P=0·004) (see also the online Supplementary Table S4). On the other hand, there was a borderline statistically significant correlation between ferritin and HOMA-IR in men (Fig. 1), which did not persist after adjustments (online Supplementary Table S4). In the whole sample, sTfR levels were associated with insulin resistance after adjustment for covariates including sex/menopausal status (P<0·05), but no association was observed for ferritin in similar analyses (online Supplementary Table S4). The relationship between sTfR and HOMA-IR was driven by the relationship between sTfR and insulin levels, which were similarly significant (online Supplementary Table S4), whereas adjusted associations with glucose levels were not statistically significant (online Supplementary Table S1).
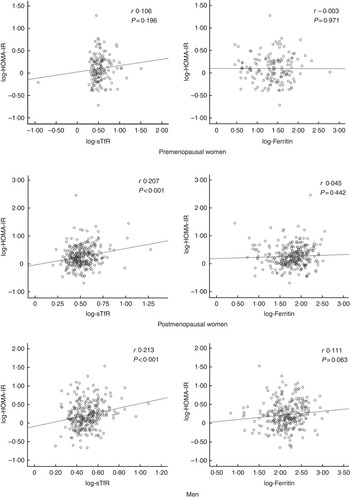
Fig. 1 Pearson’s correlations between insulin resistance and iron markers. HOMA-IR, homoeostatic model assessment for insulin resistance; sTfR, soluble transferrin receptor.
We also evaluated potential non-linear associations between ferritin and insulin resistance and found that mean HOMA-IR in the highest tertile of ferritin was significantly higher compared with the lowest tertile even after adjustment for covariates (online Supplementary Fig. S1).
In the unadjusted analysis, HbA1C, a marker of longer-term glucose metabolism, was significantly associated with sTfR in men and with ferritin in the whole sample, but after adjustments there were no significant independent associations (online Supplementary Table S5).
We additionally used diabetes, CVD and categories of physical activity as covariates in the adjustment models, but the estimates of the associations described above between the Fe markers, the MetS, insulin resistance and HbA1C and the statistical significance did not change substantially (online Supplementary Table S6).
The online Supplementary Tables S7 and S8 show the effect of additional adjustment for BMI on the association between Fe markers and the MetS and its components. All of the initial significant associations remained significant after adjustment for BMI, with the exception of the associations between ferritin and increased WC in men and the whole sample.
Discussion
In this study of a population with high prevalence of the MetS, we report three key findings. First, sTfR levels were associated with insulin resistance but not with the MetS. Second, the positive association between sTfR and HOMA-IR was independent of covariates. Third, Fe stores (measured as serum ferritin) were non-linearly associated with insulin resistance. This set of findings suggests that different Fe-related proteins are involved in cardiometabolic risk by separate underlying mechanisms.
The lack of association between sTfR levels and the MetS is consistent with findings in different studies of different sizes ranging from 155 to 1969 subjects (online Supplementary Table S9). A Finnish study of middle-aged subjects from the general population also found no significant association when controlling for confounding factors (online Supplementary Table S9)( Reference Hamalainen, Saltevo and Kautiainen 12 ). In the same study, levels of sTfR were significantly higher in adjusted analyses( Reference Hamalainen, Saltevo and Kautiainen 12 ). A small study reported lower levels of sTfR in subjects with the MetS in a sex-stratified analysis but no additional adjustments were made( Reference Leiva, Mujica and Sepúlveda 22 ) (online Supplementary Table S9). A significant, positive, age-sex adjusted correlation of sTfR with WC, but no evidence of a relationship with HDL-cholesterol and TAG levels, in participants from the European Prospective Investigation into Cancer and Nutrition (EPIC)-Postdam study has also been described( Reference Montonen, Boeing and Steffen 13 ) (online Supplementary Table S9). DBP and TAG increased across quartiles of sTfR but no association was found with WC, LDL-cholesterol, HDL-cholesterol, SBP and fasting glucose levels in 1262 women after adjustment for covariates( Reference Aderibigbe, Pisa and Mamabolo 14 ) (online Supplementary Table S9). Different adjustments, statistical approaches and discrepancies in methods measuring sTfR concentrations could contribute to the heterogeneity of results from different studies. Various commercial sTfR assays give disparate values because of the lack of an international standard. For instance, Hamalainen et al.( Reference Hamalainen, Saltevo and Kautiainen 12 ) reported similar sTfR levels (mean 2·9 mg/l) and prevalence of the MetS (48 % in men and 52 % in women) to those we report. Very high sTfR levels (mean 9·09 mg/l) with lower prevalence of some the MetS components (high WC 31 %, low HDL 43 %) were described by Aderibigbe et al.( Reference Aderibigbe, Pisa and Mamabolo 14 ). Meanwhile, Montonen et al.( Reference Montonen, Boeing and Steffen 13 ) reported lower median sTfR levels across ferritin quintiles between 1·0 and 1·9 mg/l. In addition, it is important to note that the above-mentioned studies included diverse populations in Europe and South Africa, which may have influenced differences in association patterns, sTfR levels and prevalence of the MetS components.
Our finding of a positive association between sTfR and insulin resistance in postmenopausal women and men in our study is consistent with two previous studies by Fernández-Real et al.( Reference Fernández-Real, Moreno and López-Bermejo 23 ) and Huth et al.( Reference Huth, Beuerle and Zierer 24 ). Fernández-Real et al.( Reference Fernández-Real, Moreno and López-Bermejo 23 ) described an inverse association between sTfR levels and insulin sensitivity estimated by minimal modelling in 221 Spanish individuals (ninety-seven non-obese with normal glucose tolerance, thirty-six with impaired glucose tolerance and eighty-eight with type 2 diabetes). There was no evidence of associations between sTfR and fasting glucose or insulin, but positive correlations of sTfR with values of glucose and insulin during an oral glucose tolerance test were reported. We report similar findings to Huth et al.( Reference Huth, Beuerle and Zierer 24 ) who found that sTfR levels were significantly and positively correlated with HOMA-IR in 2893 participants of the population-based Cooperative Health Research in the Region of Augsburg (KORA) F4 study (Germany). In contrast, Arija et al.( Reference Arija, Fernández-Cao and Basora 25 ) also did not find significant correlations between sTfR and HOMA-IR after adjusting for sex, age and BMI in Spanish non-diabetic individuals (n 302) as well as in a mixed group of non-diabetic subjects plus non-diabetic subjects who later developed diabetes (n 153). The relationship between sTfR and glucose metabolism might be easier to identify in the postprandial than in fasting state, as Fernández-Real( Reference Fernández-Real, Moreno and López-Bermejo 23 ) reported correlation with glucose concentrations after an oral glucose test tolerance test. In addition, an insulin-sensitising intervention of dietary change combined with exercise was associated with decreasing sTfR levels in obese individuals( Reference Fernández-Real, Izquierdo and Moreno-Navarrete 26 ). We found that additional adjustments for physical activity did not substantially affect the non-significant associations of sTfR with the MetS and its components, but acknowledge that our measurement of physical activity is imperfect. A significant association between presence of TfR gene polymorphisms (rs3817672, 210AG, S142G) and type 2 diabetes has been described( Reference Fernández-Real, Mercader and Ortega 27 ). In addition, individuals with 210A–G TfR gene polymorphisms showed higher sTfR levels, which correlated positively with glucose levels, whereas in non-carriers there was no relationship between those markers( Reference Fernández-Real, Mercader and Ortega 27 ). These associations with polymorphisms were not confirmed in genetic consortia databases( Reference Morris, Voight and Teslovich 28 ). However, other studies have found other SNP linked to both type 2 diabetes and sTfR. For instance, significant associations have been observed for loci in TPMRSS6 with sTfR (P=3·47×10−6) and type 2 diabetes risk( Reference He, Workalemahu and Manson 29 ). These findings imply that a common third factor might influence both circulating sTfR levels and diabetes susceptibility.
Although the finding of a positive association between sTfR and insulin resistance could suggest that low Fe status, in terms of high sTfR, may also be associated with cardiometabolic risk, it appears unlikely given the absence of concomitant association with the MetS or its components in this cross-sectional study. A potential explanation is the effect of insulin on sTfR levels. Insulin up-regulates erythropoiesis( Reference Ratajczak, Zhang and Pertusini 30 ), of which sTfR is a surrogate. sTfR represents a valuable quantitative assay of marrow erythropoietic activity as well as a marker of tissue Fe deficiency( Reference Beguin 31 ). Marrow erythropoietic activity appears to be the most important determinant of sTfR levels, causing variations up to eight times below and up to twenty times above average normal values( Reference Beguin 31 ). Erythroblasts rather than reticulocytes are the main source of serum sTfR. sTfR levels are decreased when erythropoietic activity is low and are increased in situations such as haemolysis or ineffective erythropoiesis( Reference Beguin 31 ). As insulin has been described to up-regulate erythropoiesis( Reference Ratajczak, Zhang and Pertusini 30 ), it could be that this action of insulin remains sensitive in contrast to peripheral insulin resistance in the liver or in the muscle (the classical insulin sensitive tissues). If this is the case, sTfR might appear to be spuriously elevated and would not reflect insulin sensitivity in other tissues. In addition, up-regulation in the expression of TfR by insulin via a hypoxia-inducible factor, as observed in human hepatic cells (HepG2)( Reference Biswas, Tapryal and Mukherjee 32 ), is an alternative explanation.
We identified differences by sex and menopausal status in the relationship of ferritin with the MetS and its components as significant associations were found in men and postmenopausal women, but not in premenopausal women, in our study. Theoretically, in men and postmenopausal women, the relationship between ferritin and cardiometabolic risk might be more obvious because of higher Fe accumulation than in women who lose Fe during menstruation. This is in line with studies describing no association between ferritin and the MetS in premenopausal women( Reference Cho, Shin and Yi 33 , Reference Yoon, Linton and Koh 34 ). However, several studies have also reported significant relationship between ferritin and the MetS in premenopausal women( Reference Jehn, Clark and Guallar 35 – Reference Yoo, Ko and Park 38 ). Threshold effects do not appear to contribute to the discrepancy in relationships as studies had comparable ferritin concentrations and MetS prevalence (approximately 10 %) among premenopausal women regardless of whether or not an association was described. Statistical power could explain the discrepant findings, because most of the studies describing associations had larger sample sizes for premenopausal women than those with no association. The relationship between insulin resistance and ferritin appeared to demonstrate a threshold effect when comparing the highest levels of ferritin with the lowest (tertiles 1 and 2) in the whole group of subjects.
Neither ferritin nor sTfR was associated with HbA1C whether or not diabetes was included as a covariate in the models. Our finding is consistent with the lack of association between ferritin and HbA1C reported in the 3876 participants of National Health and Nutrition Examination Survey (NHANES) III (1988–1994)( Reference Cheung, Cheung and Lam 39 ). Previously, Fernández-Real et al.( Reference Temelkova-Kurktschiev, Siegert and Bergmann 21 ) and Rajpathak et al.( Reference Rajpathak, Wylie-Rosett and Gunter 40 ) described significant weak correlations (r 0·14 and r 0·12) between sTfR and HbA1C in 221 men and 560 overweight individuals, respectively. However, in the first study, the correlation was unadjusted, and the second study only adjusted for age and sex; it is unknown whether metabolic and adiposity covariates might have attenuated the relationships. It is of note that the associations between sTfR and HbA1C do not appear to have been evaluated using robust multivariate analyses in the existing literature. Therefore, further population-based studies are needed to confirm the absence of associations between HbA1C and markers of Fe metabolism after multivariate adjustment in general populations.
In the present study, we presented adjusted associations between the Fe markers, the MetS and its components with and without BMI as covariate. The MetS is common in overweight and obese individuals( Reference Meigs 41 ), and BMI might confound or mediate the relationship between Fe metabolism and the MetS. We found that only the association between ferritin and WC was markedly attenuated after adjustment for BMI. Although this might have been expected given the high correlation between WC and BMI and other studies reporting similar attenuation( Reference Jehn, Clark and Guallar 35 ), another study reported a significant association between ferritin and increased WC independently of BMI adjustment( Reference Tang, Liu and Tang 42 ). This latter study had a larger sample size with higher ferritin levels. In our study, the significant associations between ferritin, the MetS (in men and premenopausal women), high glucose and TAG, and low HDL-cholesterol in men appear to be independent of BMI and other covariates.
To the best of our knowledge, the present study is the first to investigate the association between sTfR and both MetS and insulin resistance by using a robust multivariable analysis. We have also extended the finding by Hamalainen et al. describing the absence of a significant relationship between STfR and the MetS by performing additional adjustments for BMI, alcohol consumption, CVD and diabetes. In addition, previous studies on the association between ferritin and sTfR and cardiometabolic risk may have provided biased results as a consequence of not adjusting for prevalent cardiometabolic disease. Concomitant chronic disease can influence Fe status, and reverse causality might lead to overestimation of the association between Fe markers and the MetS. Key limitations of our study include the relatively small number of premenopausal women and the inability to adjust for hepatic dysfunction as markers such as transaminases were not measured in the original study. In the original project, there were no specific questions about using lipid-lowering medications, and therefore associations with components of low HDL-cholesterol and high TAG could be underestimated as these components did not include individuals with prescribed medication that might affect these values. The cross-sectional design of the study means that it is not possible to provide evidence of a causal relationship between Fe status and cardiometabolic risk factors. In addition, no adjustment for multiple testing was performed and some findings may be due to chance. For the present study, we used a sample of subjects with available measurements of exposure, outcome and adjustment variables and have not performed a power calculation. However, our sample as a whole is relatively large in comparison with previous studies but may have had limited power to detect small effects.
Fibrinogen levels were higher in the selected subjects for this analysis than in the non-selected participants from the Croatia/Vis study, and this was the only difference in the study variables. It is not feasible to determine whether this difference might have influenced the findings, as an analysis of data for the excluded subjects would not be reliable given the small sample size and a large proportion of missing values. The difference in fibrinogen levels may also be a finding by chance due to the multiple testing. The nature of multivariable modelling means that people with missing data are excluded. For clearer and more coherent comparisons, the present study provides unadjusted and adjusted estimates using the sub-group with complete data.
In conclusion, our study found that sTfR levels are associated with insulin resistance but not with the MetS, independently of age, subclinical/chronic inflammation, smoking and alcohol habits, HbA1C and cardiometabolic disease, in a population with a high prevalence of the MetS and abdominal obesity. It is possible that sTfR levels are a poor marker of erythropoiesis or Fe metabolism in subjects with insulin resistance or hyperinsulinaemia, and are spuriously elevated and therefore not associated with the MetS or its components. We conclude that there is a complex relationship between markers of Fe status and cardiometabolic risk, with inconsistent associations with different markers.
Acknowledgements
The authors acknowledge the staff of several institutions in Croatia who supported the field work, including but not limited to The University of Split and Zagreb Medical Schools, Institute for Anthropological Research in Zagreb and Croatian Institute for Public Health. The SNP genotyping for the CROATIA_Vis cohort was performed in the core genotyping laboratory of the Wellcome Trust Clinical Research Facility at the Western General Hospital, Edinburgh, Scotland.
The original study was supported by Medical Research Council (MRC) and the Croatian Ministry of Science, Education and Sport.
M. F. S.-O. conceived the study design, analysed the data and wrote the manuscript. S. H. W., S. M. and J. M. F.-R. supervised the analysis, reviewed/edited the manuscript and contributed to the discussion. C. H. researched the data and edited the manuscript. O. P. was the coordinator of the project, researched data and reviewed/edited the manuscript and contributed to the discussion.
No potential conflicts of interest relevant to this article exist.
Supplementary Material
For supplementary material/s referred to in this article, please visit http://dx.doi.org/10.1017/S0007114516002968


