


The present paper looks at child malnutrition in three of the five Central Asian Republics. Central Asia consists of five countries: Kazakhstan, Kyrgyzstan, Tajikistan, Turkmenistan and Uzbekistan. These countries became independent states for the first time in their history after the dissolution of the Former Soviet Union (FSU) in December 1991. They are situated east of the Caspian Sea, sharing borders with Russia in the north and west, China to the east and Afghanistan, Pakistan and Iran to the south, with a total population by 1 January 2008 of more than 60 million(1).
The paper aims to provide some answers as to why wide variation in the level of malnutritionFootnote † exists among children under the age of 5 years in Central Asia. These data (although somewhat dated) are particularly important when we recall that, just before the break-up of the FSU, child malnutrition levels reported in this region were lower than those in many developing countries at the time(2). Under Soviet rule few large-scale survey studies were conducted without a directive from government, and very few of these studies were published for public consumption. Studies were published in either Russian or one of the other major FSU languages. Almost no literature on child malnutrition at national level after 1991 is available except for reports produced through the Demographic and Health Surveys (DHS) that began in 1995 in Kazakhstan.
The few child nutrition studies that have been published in Central Asia especially after 1991 have shown considerable growth in the extent of malnutrition in the form of impaired child growth, anaemia, morbidity and deficiencies of specific micronutrients. None of these studies has attempted to determine the causes, nor has there been a study conducted to find out why child malnutrition is higher in some of the Central Asian Republics than the others when all the republics were governed through a central planning system under Soviet rule. Such knowledge is critical in the Central Asian context because of the general deterioration of economic and social welfare, increasing inequity in society generally, growth of poverty, increasing unemployment, especially of women, and low pay, among other factors(Reference Anderson and Romani3).
Statistics on the prevalence of protein–energy malnutrition in developing countries indicate that, on average, stunting (low height-for-age), underweight (low weight-for-age) and wasting (low weight-for-height) affect about 30 %, 27 % and 8 % of the child population, respectively(4). These figures provide important evidence of a global nutrition problem that needs to be vigorously addressed. However, they mask marked variations in the proportions of stunted, underweight and wasted children under the age of 5 years from country to country and by rural or urban residence.
A number of factors are responsible for the decline in nutritional status of children in Central Asia; for example, poverty, unemployment, decline in family income and closure of milk kitchens. Ironically, the latter has had a positive spin-off because the incidence of breast-feeding has increased(Reference Bauer, Boschman, Green and Kuehnast5). Malnutrition levels are twice those before independence from the FSU. In a study conducted by the World Bank in 1996, it was found that there was a 60 % increase in wasting among preschoolers in Kyrgyzstan compared with pre-independence figures. In Kazakhstan, similar estimates were made in a study conducted by the Ministry of Health. Acute malnutrition in the 0–1 years age group increased from 7·3 % in 1993 to more than double (16·7 %) in 1996. The growing problems of malnutrition, increasing poverty, poor living conditions, difficult economic conditions, and lack of water and heating are directly related to more than half of infant deaths in Kazakhstan(Reference Bauer, Boschman, Green and Kuehnast5, Reference Falkingham6). Food consumption, especially by women and children, has decreased radically since 1990(7).
Methods and data
In the present paper, a pooled cross-sectional data set from the 1996, 1997 and 1999 DHSFootnote * for Uzbekistan, Kyrgyzstan and Kazakhstan, respectively, was used to measure the prevalence of malnourished children <3 years of age in these countries. DHS data were available for only three of the five countries in this region. Permission was sought from and granted by Macro International Inc. to conduct a secondary analysis of selected variables for the purposes of the present study. The DHS data sets provide one of the best sources of data for the study of child malnutrition worldwide.
The analysis identified bio-demographic, maternal and child health factors, environmental/community/household and socio-economic factors influencing children’s nutritional status. The combined DHS for the three countries under study had a sample size of 14 067 households, in whom 13 063 eligible women aged 15–49 years had children between 0 and 35 months old. Household and individual interviews through the use of questionnaires were held with all eligible women for inclusion in the study. A primary objective of the Household Questionnaire was to identify women who were eligible for the individual interview, while the Individual Questionnaire was used to collect information from women aged 15–49 years. There were 2358 children <3 years of age in the pooled data set. The DHS in all three countries employed a nationally representative probability sample of women aged 15–49 years and included about 4000 women each. Selected regions, which are divided into oblasts,Footnote † were included in the survey, both urban and rural. In the urban areas, the sampling frame was the list of therapeutic uchastoks,Footnote ‡ mainly cities. For the small towns, each town was divided into smaller segments, which were treated as if they were uchastoks. In the rural areas the sampling frame was the list of all villages in the whole country. The primary sampling units were raions,Footnote § which were selected with probabilities proportional to population size(8–10).
The sample was selected in two stages. In urban areas, the primary sampling unit selected in the first sampling stage corresponded to the uchastok. Large uchastoks that were selected into the sample were divided in the field into smaller segments, only one of which was selected for the survey. A complete listing of the households residing in each selected segment was carried out. The lists of households obtained were used as the frame for the second stage of sampling; households were selected in each cluster and women aged 15–49 years were eligible to be interviewed.
In rural areas, the first-stage sampling units were villages. Very large villages that had been selected into the sample were divided in the field into smaller segments of which only one was selected. Because of the non-proportional distribution of the sample in the different survey regions, sampling weights were applied to the data. Only the individual data file was analysed in the present study.
Cross-sectional anthropometry (body dimensions and composition) is often used as a proxy for assessing the eventual extent and severity of child malnutrition, since cross-sectional anthropometry reflects the combined effects of past and recent diet, morbidity and child care. Anthropometric indices are used as the main criteria for assessing the adequacy of diet and growth in infancy. The WHO recommends the US National Center for Health Statistics percentiles as a reference for international use. The classical indicators in this respect concern the growth of children and the body composition of adults. The most commonly used measurements are the body weight, height, age and gender of each individual, which allow calculation of Z-scoresFootnote * for height-for-age (HAZ), weight-for-age (WAZ) and weight-for-height (WHZ). Children whose HAZ, WAZ or WHZ are below −2 are considered to be stunted, underweight or wasted, respectively. A Z-score between −3 and −2 indicates moderate levels of undernutrition, while a Z-score below −3 indicates severe levels of undernutrition(11). The criterion is different for WAZ, HAZ and WHZ. For example, if the prevalence of malnutrition is less than 20 % for HAZ, less than 10 % for WAZ and less than 5 % for WHZ, the population is considered to have a low prevalence(Reference Som, Pal, Bhattacharya, Bharah and Bharati12). Only children with plausible Z-scores were selected for inclusion in the present study. Table 1 presents the criteria used to classify malnutrition levels for any given population of children <5 years of age.
Table 1 Criteria for malnutrition prevalence on the basis of the percentage of children <5 years of age with Z-scores <−2
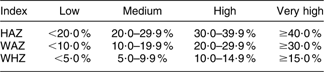
Source: WHO(11).
HAZ, height-for-age Z-score; WAZ, weight-for-age Z-score; WHZ, weight-for-height Z-score.
Univariate analyses of all variables relevant to the study of undernutrition were carried out for each country. Thereafter bivariate analyses (of pooled data for the three countries in order to create a more usable data set for multivariate analyses) were carried out. Variables that indicated a significant association in the bivariate tabulations were tested for inclusion in the models for multivariate analyses. Multivariate logistic regression analysis was carried out separately to study the chances of underweight and stunted children being included in the study. Wasting was excluded in the analysis because very few independent variables showed any significant relationship with the dependent variables. Thereafter models predicting determinants of undernutrition were postulated. The forward selection procedure with a significance level of 0·05 for the Wald statistic was used. All those variables that appeared significant were used in the logistic regression. Data analysis was carried out using the SPSS statistical software package version 14·0 (SPSS Inc., Chicago, IL, USA).
Results and discussion
Table 2 shows the nutritional status of children <3 years of age in Kyrgyzstan, Uzbekistan and Kazakhstan in terms of HAZ, WAZ and WHZ. Comparing Table 1 with Table 2 gives the relative prevalence of malnutrition in the study population. It is observed that the relative prevalence of malnutrition in Kyrgyzstan was generally moderate, while it was high in Uzbekistan and low in Kazakhstan.
Table 2 Percentage of malnourished, moderately and severely malnourished children in the Central Asian Republics: secondary analysis of the 1996, 1997 and 1999 Demographic and Health Surveys for Uzbekistan, Kyrgyzstan and Kazakhstan, respectively

HAZ, height-for-age Z-score; WAZ, weight-for-age Z-score; WHZ, weight-for-height Z-score.
In the bivariate analyses, the data for the three countries were combined in order to create a more usable data set for multivariate analyses. Table 3 presents the results of the bivariate analyses aimed at identifying factors associated with underweight, stunting and wasting. Substantial disparities in terms of underweight, stunting and wasting within the three countries were found. An unexpected finding was the high probability that fully vaccinated children were more likely to be underweight and stunted compared with children who were partially vaccinated. Similar results were found in Ethiopia(Reference Yimer13). A further unexpected finding was that breast-feeding especially in children >6 months old had a strong negative association with stunting and underweight. Studies conducted in north-east India and Nicaragua revealed similar results(Reference Rao, Ladusing and Pritamjit14, Reference Sasisaka, Waka, Kuroiwa, Cuadra, Aragon and Hanada15).
Table 3 Percentage of children with Z-scores <−2 for various anthropometric indices in the Central Asian Republics by social, economic, health and environmental characteristics: secondary analysis of the 1996, 1997 and 1999 Demographic and Health Surveys for Uzbekistan, Kyrgyzstan and Kazakhstan, respectively
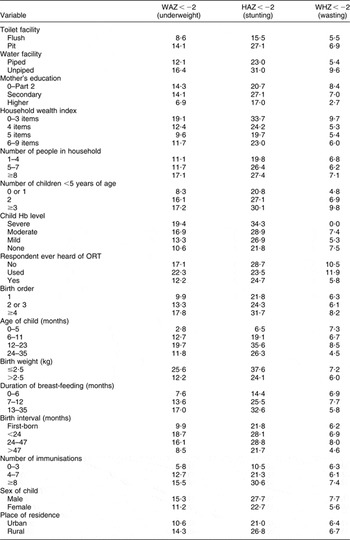
HAZ, height-for-age Z-score; WAZ, weight-for-age Z-score; WHZ, weight-for-height Z-score; ORT, oral rehydration therapy.
Table 4 shows the results of the logistic regression analysis for WAZ, indicating the odds of being underweight in various categories of the population observed. It is noted that living in Uzbekistan had a significant effect on the prevalence of underweight children. The logistic regression analysis showed that children living in Uzbekistan were 4·4 times more likely to be underweight than children living in Kazakhstan. A child living in a household with one to four persons was 55 % less likely to be underweight in comparison with a child living in a household with eight or more people. The finding on the influence of household size is consistent with Sahn’s(Reference Sahn16) study of nutritional status in Cote d’Ivoire and Ndiaye’s study in Niger(Reference Ndiaye17). It was observed that ownership of durable household goods used as a proxy for economic condition had a significant effect on the prevalence of underweight children. The odds of a child being underweight in a household that owned up to three durable household items were 1·6 times higher in comparison with households that owned six to nine durable items. Among children under the age of 6 years in Nigeria, Ukwuani and Suchindran(Reference Ukwuani and Suchindran18) found that children born to mothers in wealthy households were less likely to be stunted than children born to mothers in poor households. Silva(Reference Silva19) found in Ethiopia that household wealth had a greater impact on stunting than on underweight.
Table 4 Odds and 95 % confidence intervals of underweight (WAZ < –2) in the Central Asian Republics for the pooled data set: secondary analysis of the 1996, 1997 and 1999 Demographic and Health Surveys for Uzbekistan, Kyrgyzstan and Kazakhstan, respectively
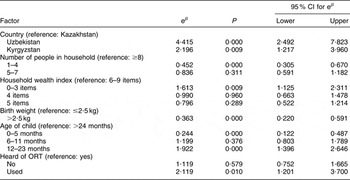
WAZ, weight-for-age Z-score; ORT, oral rehydration therapy.
Another important determinant of WAZ was the birth weight of the child. Children whose birth weight was more than 2·5 kg were 64 % less likely to be underweight in comparison with children who weighed 2·5 kg and less at birth. Examining factors causing child malnutrition in Bangladesh, Rayhan and Khan(Reference Rayhan and Khan20) found that children who were very small and smaller than average size at birth had a higher risk of stunting, underweight and wasting compared with children who were average size or larger at birth. In Cameroon, Pongou et al.(Reference Pongou, Majid and Salomon21) reported that the size of the child at birth affected the child’s nutritional status.
Poor nutritional growth was observed as the age of the child increased. This conclusion is supported by studies on the growth of individual children. These studies showed that most of those malnourished at ages 3–5 years had already presented anthropometric deficits at the end of their first year of life(Reference Shrimpton, Victora, Onis de, Lima, Blossner and Clugston22, Reference Aturupane, Deolalikar and Gunewardena23). The odds of being underweight were 2·1 times higher for those children who had used oral rehydration therapy (ORT) in comparison with those whose mothers had only heard of ORT. The questionnaire posed the question to the mothers whether they had heard of ORT, had used it in the preceding two weeks or had never heard of it. The use of ORT two weeks prior to the survey is indicative of a child having suffered from diarrhoea, which could have led to weight loss. The negative association between use of ORT and underweight in the present study could be explained in two ways. Bhuiya and Streatfield(Reference Bhuiya and Streatfield24) and Boerma et al.(Reference Boerma, Sommerfelt, Rutestin and Rojas25) concluded that a lack of understanding of infections as a cause of disease and improper use of ORT to treat diarrhoea negatively affected child nutritional status.
As was the case with WAZ, living in Uzbekistan had a significant impact on the HAZ of children (Table 5). The odds of being stunted were 3·7 times higher for children in Uzbekistan compared with children living in Kazakhstan. The same result was found when comparing Kyrgyzstan and Kazakhstan, although the odds of being stunted were lower.
Table 5 Odds and 95 % confidence intervals of stunting (HAZ < −2) in the Central Asian Republics for the pooled data set: secondary analysis of the 1996, 1997 and 1999 Demographic and Health Surveys for Uzbekistan, Kyrgyzstan and Kazakhstan, respectively

HAZ, height-for-age Z-score; ORT, oral rehydration therapy.
The number of children per household played a significant role in respect of stunting. An only child was approximately 40 % less likely to be stunted than a child living in a household with more than three children. Similar results were found in south Ethiopia, India and the Congo(Reference Yimer13, Reference Mishra and Retherford26, Reference Delpeuch, Traissac, Martin-Prével, Massamba and Maire27).
The odds of a child being stunted in a household that owned up to three durable household items were 1·3 times higher in comparison with a household that owned six to nine durable household items. Ukwuani and Suchindran(Reference Ukwuani and Suchindran18) found that, among children under the age of 6 years in Nigeria, children born to mothers in wealthy households were less likely to be stunted than children born to mothers in poor households. Silva(Reference Silva19) found in Ethiopia that household wealth had a greater impact on stunting than on underweight.
Children with a birth weight of 2·5 kg and less were more than twice as likely to be stunted in comparison with children with a birth weight of more than 2·5 kg. In Cameroon, Pongou et al.(Reference Pongou, Majid and Salomon21) reported that the size of the child at birth affected the child’s nutritional status.
Exposure to malnutrition peaked for the 12–23 months age group with an odds ratio of 1·57 compared with children above the age of 24 months. This means that the 12–23 month age group were 1·57 times more likely to have low HAZ than children older than 24 months. These results are consistent with the findings of past studies that child nutritional status declines significantly with age, reflecting the typical deterioration of linear growth in children aged 1 to 3 years – the most vulnerable age category(Reference Ndiaye17). Those children with mothers having 0–Part 2 education were nearly twice as likely to be stunted as children with mothers who had a secondary and higher than secondary education. The positive effect of maternal education on child nutritional status found in the present is study is consistent with other studies on factors affecting child health, such as those conducted in India, Bangladesh, Nepal and Russia(Reference Mishra and Retherford26, Reference Choudhury and Bhuiya28–Reference Fedorov and Sahn30).
The odds of being stunted for children living in a household with unpiped water were about 1·4 times higher in comparison with those children who lived in a household with piped water. The positive nutritional effect of clean water found in the present study is also consistent with other studies conducted in developing countries(Reference Silva19, Reference Pongou, Majid and Salomon21, Reference Thomas and Strauss31).
These findings have important implications for policy and represent a further step towards gaining an improved understanding of the complex determinants of child (mal) nutrition in Central Asia.
Acknowledgements
No funding was solicited for this project and there are no conflicts of interest.


