


It is well established that environmental and lifestyle factors, such as dietary intake and habits, influence health and disease outcomes(Reference Bingham1). Epidemiological evidence has reported associations between dietary intake and positive health effects for CVD(Reference Nuñez-Cordoba, Alonso and Beunza2,Reference Panagiotakos, Pitsavos and Kokkinos3) , diabetes(Reference Nöthlings, Schulze and Weikert4) and certain cancers(5–Reference Gullett, Mazurak and Hebbar7). In order to interpret the effect of diet on health, it is critical to accurately measure an individual's, or a population's, dietary intake. Traditional self-reported dietary assessment techniques, including FFQ, dietary recalls and weighed food records, are subject to well-documented limitations. For example, self-reported methods are at risk of reporting inaccuracy, subjective estimation of portion sizes, recall bias and misreporting(Reference Arija, Abellana and Ribot8–Reference Shim, Oh and Kim11). Consequently, there is a need for the development of more accurate and objective dietary assessment measures, such as dietary biomarkers.
The discovery of dietary biomarkers is an area of increasing interest. Presently, there are only a few biomarkers for dietary assessment that are well-established, capturing intake of salt, protein, sucrose and fructose(Reference Bingham1). Twenty-four-hour urinary nitrogen is a well-known biomarker of protein(Reference Bingham1) and is often used to validate self-reported intake(Reference Rasmussen, Winning and Savorani12), or to compare the accuracy of two dietary assessment methods(Reference McKeown, Day and Welch13). Urinary concentrations of sucrose and fructose are dose-responsive and predictive biomarkers of dietary sugars(Reference Tasevska14,Reference Luceri, Caderni and Lodovici15) . However, many studies investigating sucrose/fructose as a potential intake biomarker have been observational, with associations appearing low to moderate(Reference Davy and Jahren16), perhaps due to between/within-subject variation in urinary sucrose/fructose absorption, tissue uptake and excretion(Reference Tasevska14). While these biomarkers are accepted as more accurate and useful, they are reflective of dietary nutrient habits instead of consumption of specific foods, highlighting the need for food intake biomarkers.
A newly defined flexible classification scheme for biomarkers related to food intake was recently published(Reference Gao, Praticò and Scalbert17). The authors outline six subclasses of dietary and health biomarkers to be included under the previously suggested major classes of biomarker: exposure, effect and susceptibility. Four of these subclasses are associated with dietary intake and are as follows: (1) food compound intake biomarkers: nutrients or non-nutrients reflective of dietary intake; (2) food intake biomarkers: nutrients or non-nutrients reflective of intake of a specific food; (3) dietary pattern biomarkers: a set of food intake biomarkers that can distinguish between different dietary habits or indicate a high adherence to a pre-defined diet (e.g. Mediterranean or Nordic diets); (4) food compound status biomarkers: nutrients and non-nutrients indicating accumulated stores of compounds in the body. The final two subclasses (effect and physiological markers) are not products of dietary intake and therefore are not covered by this review. Biomarkers of food intake can be single metabolites, or a combination of metabolites, reflecting the consumption of either a specific food or food group, displaying a clear time– and dose–response after intake(Reference Gao, Praticò and Scalbert17).
Metabolomic techniques for food intake biomarker discovery
Through the use of metabolomics, a number of food intake biomarkers have emerged in the literature. At the broadest definition, metabolomics is the study of endogenous or exogenous metabolites in a biological sample. The human metabolome is influenced by multiple factors such as genetics, the microbiome(Reference Fujisaka, Avila-Pacheco and Soto18) and environmental factors including diet and lifestyle(Reference Zamora-Ros, Achaintre and Rothwell19). Analysis of metabolites is usually performed using NMR spectroscopy, or MS, which can be coupled with a separation technique such as LC or GC(Reference Scalbert, Brennan and Manach20,Reference Gibbons, O'Gorman and Brennan21) .
In brief, NMR is a popular metabolomics platform frequently employed for the discovery and identification of novel food intake biomarkers. NMR captures quantitative metabolite data in a robust fashion. It is a non-destructive method, relatively fast and requires little sample preparation(Reference Ulaszewska, Weinert and Trimigno22). NMR has a comparatively lower sensitivity and requires larger sample volumes compared to other analytical techniques such as MS methods of analysis(Reference Wishart23). However, the reproducibility across multiple laboratories of NMR analysis is very high. This technique is useful for broad-based analyses and high abundance metabolites(Reference Pan and Raftery24). MS-based techniques are extremely sensitive and can analyse small sample volumes, however samples are non-recoverable after analysis. Furthermore, sample preparation is more laborious than NMR. MS techniques coupled to LC or GC separate compounds based on their physiochemical properties, which are eluted at various retention times. These compounds are then ionised, determining their mass: charge ratio (m/z)(Reference Sparkman, Penton and Kitson25). Compound identification can be made by combining retention times information with m/z along with additional analyses, such as fragmentation patterns from tandem MS, to compare against standards and spectral libraries. Different chromatographic techniques, coupled with MS, can identify different metabolites. Examples of routinely measured metabolites are polar and volatile compounds, amino acids, biogenic amines, peptides, intact lipids, organic acids, bile acids and fatty acids as well as other macromolecules(Reference Bouatra, Aziat and Mandal26,Reference Griffin, Atherton and Shockcor27) .
In the context of applying metabolomics to food intake studies, a number of challenges exist. These include the generation of a large amount of data to be processed and identification of metabolites to a high confidence level(Reference Ulaszewska, Weinert and Trimigno22). Currently, identification of metabolites is reliant on the availability of analytical standards for confirmation and the availability of comprehensive spectral libraries and databases. Unfortunately, many such databases contain few food-related compounds. Notwithstanding these challenges, biomarkers have been identified for a number of foods.
Study designs to identify food intake biomarkers
To date, studies were performed to identify potential food intake biomarkers for multiple foods and food groups, covering a wide range of components of the human diet(Reference Cross, Major and Sinha28–Reference Rothwell, Fillâtre and Martin32). Numerous study designs can be employed to identify food intake biomarkers. Previous successful designs include acute intervention studies, short/medium-term interventions and cross-sectional cohort studies(Reference Cross, Major and Sinha28,Reference O'Gorman, Gibbons and Brennan33) . The intervention study designs involve the consumption of specific food(s) over a defined period of time and biofluids, such as blood and urine, are collected at specific time-points depending on research interests. Human intervention studies make it possible to control potential confounding factors and allow the focused investigation of the effect of specific food/food group intake on biological samples. However, intervention studies are often performed in smaller sample sizes, and results may not be directly applicable to free-living populations. In order to overcome this limitation, it is important that identified potential food intake biomarkers are validated in other, larger, less-controlled populations.
Using samples from epidemiology studies enables examination of the relationships between self-reported food intake and biomarkers measured in urine or blood samples. Epidemiological studies collect dietary data from large sample sizes, are relatively low burden on participants and more likely to be indicative of a free-living setting. However, because of the uncontrolled setting, there is the potential for confounding variables. One of the potential limitations of using epidemiological data for food intake biomarker identification is that biomarkers identified may be present in more than one food or food group, further highlighting the need for biomarker validation. Ultimately, the design of the research will be guided by the research question, taking into consideration the limitations of each approach. The choice of biofluid examined is also important as some metabolites will appear exclusively, or are more concentrated, in some biofluids(Reference Bouatra, Aziat and Mandal26). There are multiple biofluids which can be used for food intake biomarkers identification; however, urine and blood samples are most frequently employed as they are easily accessible and contain numerous compounds of biological importance, including food intake metabolites(Reference Ulaszewska, Weinert and Trimigno22,Reference Guasch-Ferré, Bhupathiraju and Hu34) .
Validation of food intake biomarkers
Currently, there are extensive research efforts in the identification of food intake biomarkers; however, efforts in validation of the biomarkers are still lacking. To address this issue, a number of criteria were recently developed for the validation of food intake biomarkers (Fig. 1). The criteria include the following eight points: plausibility, dose–response, time–response, robustness, reliability, stability, analytical performance and reproducibility(Reference Dragsted, Gao and Scalbert35). Examining the plausibility of a food intake biomarker includes confirming food specificity and establishing any food chemistry/food processing/experimental explanations for increased concentration after consuming the food. The food intake biomarker's response to different portions of specific food should be examined, taking into account a range of intakes, habitual baseline levels, bioavailability, excretion timeline and saturation levels. The biomarker's time–response, half-life and kinetics of the biomarker are explored both after a single exposure and repeated measures over time, examining its stability as an estimate of longer-term intake. Biomarkers must be robust by demonstrating suitability in multiple free-living populations, and any food interactions identified. Investigating the reliability of a biomarker requires comparing the biomarker with a gold standard, other biomarkers of the food or other dietary assessment methods which provide a good measure of true exposure. To be effective in nutrition research, food intake biomarkers chosen must be stable within the biofluid used for analysis. The analytical performance of a biomarker must be well-documented, its precision, accuracy and detection limits, and any inter-/intra-batch variation assessed. The results of a biomarker's performance and efficacy should be reproducible with validated methods established for comparing results across different laboratories. Applying these validation criteria to the large number of potential food intake biomarkers will allow for the development of robust and valid biomarkers.
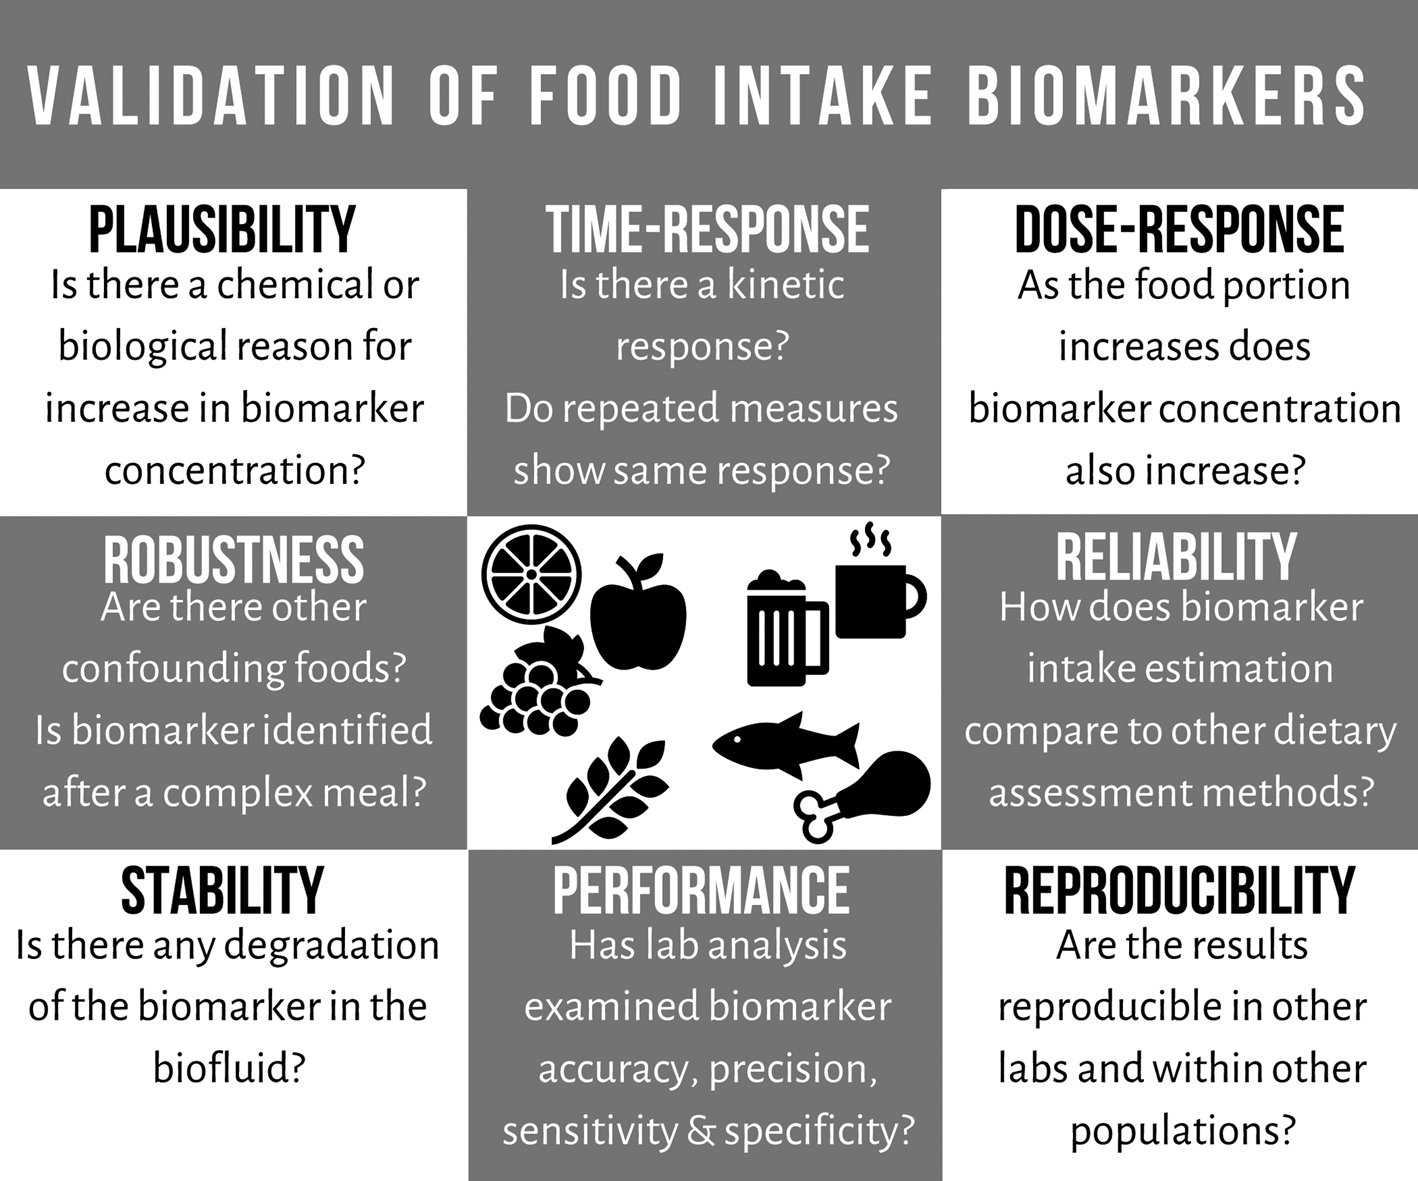
Fig. 1. Outline of the recently developed criteria for the validation of food intake biomarkers (adapted from Dragsted et al.(Reference Dragsted, Gao and Scalbert35)).
Applications of food intake biomarkers in nutrition research
At present, there are a number of putative specific food intake biomarkers identified, with varying levels of fulfilled validation criteria. Furthermore, there is a lack of research which demonstrates the multitude of applications of these biomarkers. Food intake biomarkers are extremely useful tools which can not only determine dietary exposure but be applied to correct for self-reported measurement error and the classification of dietary patterns.
Using food intake biomarkers to classify intake
There are many examples in the literature where biomarkers were used to classify individuals into consumers or non-consumers of specific foods (Table 1). In the INTERMAP study, urinary proline betaine was used to classify participants as citrus consumers or non-consumers(Reference Heinzmann, Brown and Chan30). Using receiver operating characteristics (ROC) curves, proline betaine was able to identify citrus consumers with a specificity and sensitivity of 92⋅3 and 80⋅6 %, respectively. A study investigating Nordic diets was able to differentiate between consumers and controls of specific plant foods (cabbage, beetroot, strawberries and walnuts) based on peak areas of potential food intake biomarkers identified in 24 h urine by ultra-high performance LC quadrupole time of flight MS(Reference Andersen, Kristensen and Manach36). Urine samples from the SU.VI.MAX2 study were used to identify coffee intake biomarkers, many of the identified biomarkers performed well at separating samples from high and low coffee consumers(Reference Rothwell, Fillâtre and Martin32). Atractyligenin glucuronide had the highest ROC area under the curve (AUC) and outperformed caffeine (AUC = 0⋅95 v. 0⋅72, respectively). As part of the WHOLEheart study, alkylresourcinols, biomarkers of wholegrain intake, were quantified in plasma samples by GC–MS. Plasma concentrations were significantly different between the control (low wholegrain intake, <30 g/d) and intervention groups (high wholegrain intake, 60 or 120 g/d; P ≤ 0⋅0073 across analyses) demonstrating they could distinguish between consumers and non-consumers(Reference Ross, Bourgeois and Macharia37). These plasma alkylresourcinols concentrations were also capable of distinguishing quartile of wholegrain intake at a slight to fair level (misclassification rate of 9–12 %)(Reference Ross, Bourgeois and Macharia37). A recently published paper examined non-fasting serum samples to identify the most predictive biomarkers for forty-two food items or food groups using ROC AUC to separate high and low consumers by quintiles of intake(Reference Wang, Gapstur and Carter38). The average AUC was 0⋅75 (ranging from 0⋅65 to 0⋅98); however, the authors were unable to distinguish metabolites which were food intake biomarkers and metabolites resulting from diet-induced changes in metabolism.
Table 1. Outline of approaches used to classify consumers of specific foods using food intake biomarkers
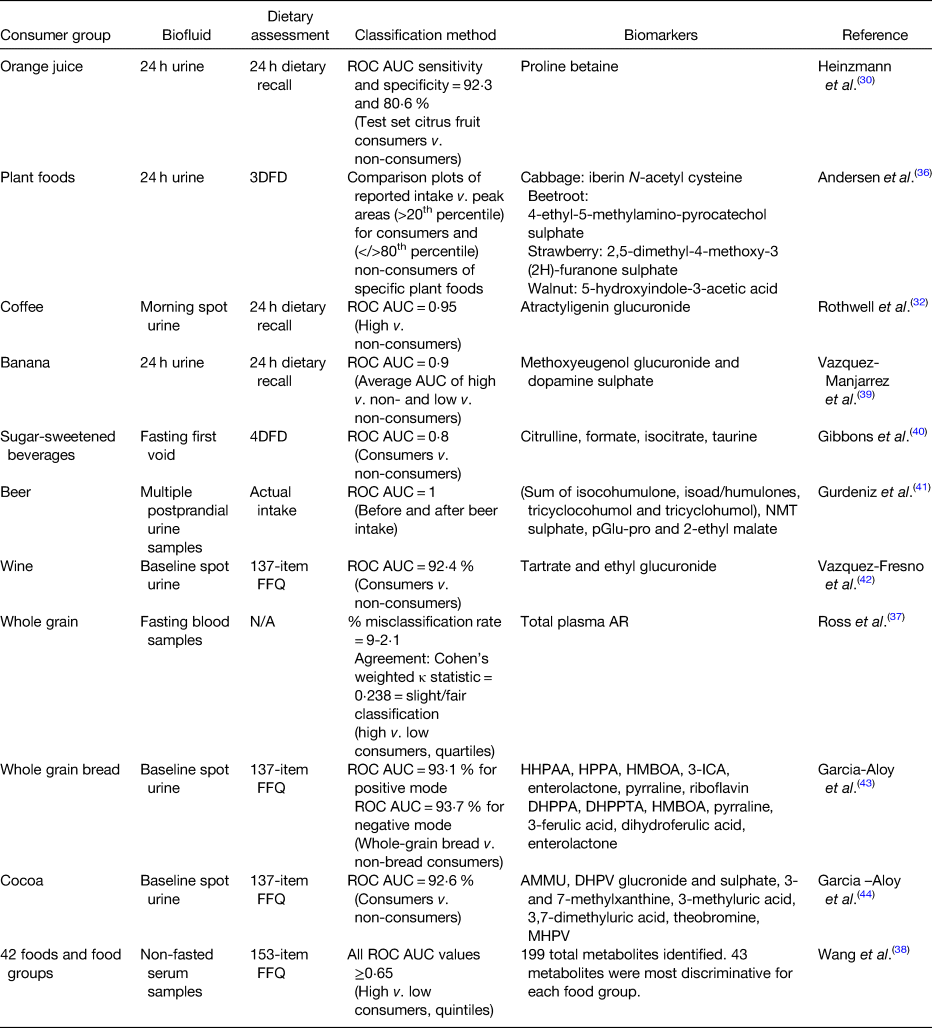
ROC, receiver operating characteristic; AUC, area under the curve; 3DFD, 3 d food diary; UPLC-qTOF-MS, ultra-high performance liquid chromatography quadrupole time of flight MS; 4DFD, 4 d food diary; NMT, N-methyl tyramine; pGlu-pro, pyro-glutamyl proline; N/A, not applicable; AR, alkylresorcinols; HHPAA, 2-hydroxy-N-(2-hydroxyphenyl) acetamide; HPPA, 2-hydroxy-N-(2-hydroxyphenyl) acetamide; HMBOA, 2-hydroxy-7-methoxy-2H-1,4-benzoxazin-3-one; 3-ICA, 3-indolcarboxylic acid glucuronide; DHPPA, 3-(3,5-dihydroxyphenyl) propanoic acid; DHPPTA, 5-(3,5-dihydroxyphenyl) pentanoic acid; AMMU, 6-amino-5[N-methylformylamino]-1-methyluracil; MHPV, methoxyhydroxyphenylvalerolactone; DHPV, 5-(3′,4′-dihydroxyphenyl)-valerolactone.
Food intake biomarkers can also be combined to achieve or improve classification of dietary intake. A recently published study used five discriminative metabolites to classify high and non-consumers of banana(Reference Vázquez-Manjarrez, Weinert and Ulaszewska39). The predictive ability of these metabolites was tested using ROC curve analysis using partial least squares-discriminant analysis models of biomarker combinations. The combination of all five metabolites was highly predictive (AUC = 0⋅90; error rate = 0⋅13) for high banana consumers v. non-consumers; however, it was a combination of just two of these metabolites which performed the best overall at classifying recent banana high consumers (AUC = 0⋅92; error ratetest = 0⋅11). Work from our own research laboratory identified four food intake biomarkers of sugar-sweetened beverages using heat-map analysis of metabolomic urinary profiles from the National Adult Nutrition Survey study(Reference Gibbons, McNulty and Nugent40). These markers were combined in a panel and ROC curves demonstrated that the panel could discriminate between consumers and non-consumers of sugar-sweetened beverages (AUC = 0⋅8) and was more predictive of intake than the individual biomarkers themselves (AUC ranging from 0⋅5 to 0⋅7). A multimetabolite biomarker panel, made up of beer ingredient and food processing biomarkers, was capable of distinguishing beer consumption from urine samples collected before and up to 12 h after intake of beer with excellent efficiency (AUC = 1)(Reference Gürdeniz, Jensen and Meier41). Using two food intake biomarkers of wine, analysis of PREDIMED study data revealed a stepwise logistic regression model capable of identifying wine consumers compared to non-consumers (AUC = 0⋅92) and detecting these consumers up to 3 d after the last glass of wine(Reference Vázquez-Fresno, Llorach and Urpi-Sarda42). Fasting urine metabolomic data from the PREDIMED study analysed by LC–MS was also used to develop a multimetabolite panel capable of predicting non-bread consumers and whole-grain bread consumers (ROC AUC > 0⋅93 for both positive and negative mode models)(Reference Garcia-Aloy, Llorach and Urpi-Sarda43). The multimetabolite panel contained alkylresourcinols, benzoxazinoids, microbial metabolites, exogenous metabolites and a heat-treatment product. The same authors also developed a panel of urinary food intake biomarkers for discriminating cocoa consumers from non-consumers in the same population (ROC AUC = 0⋅93)(Reference Garcia-Aloy, Llorach and Urpi-Sarda44).
The afore-mentioned studies demonstrate that food intake biomarkers can be very efficient at classifying consumers and non-consumers of specific foods and they have the potential to be used to validate self-reported findings. However, this approach is qualitative and further research into these biomarkers is necessary to enable the field to move from qualitative to quantitative assessment of food intakes.
Quantifying intake using food intake biomarkers
Examining a biomarker's ability to quantify intake can progress food intake biomarkers beyond the dichotomous classification of consumers and non-consumers. Previous work from our research group examined the potential of the well-established marker of citrus intake, proline betaine, in determining citrus intake(Reference Gibbons, Michielsen and Rundle45). Employing calibration curves developed from a controlled dietary intervention study (NutriTech), urinary proline betaine concentrations were used to determine the citrus intake in an independent cross-sectional study of 565 individuals. There was excellent agreement between the self-reported intake (estimated from a 4 d semi-weighed dietary record) and the biomarker-estimated intake with a low mean bias of 4⋅3 g between methods. This study clearly demonstrates the potential of well-validated food intake biomarkers. Our research group also applied a similar approach to a biomarker of chicken intake: guanidoacetate(Reference Yin, Gibbons and Rundle46). Urinary guanidoacetate demonstrated a dose–response relationship with increasing chicken intake in the NutriTech study and a calibration curve developed was able to discriminate between high and non-consumers of chicken in an independent cross-sectional study. Guanidoacetate demonstrated good agreement between self-reported and biomarker-estimated intake with a low mean bias of −30⋅2 g between methods. Garcia-Perez et al. established a dose–response relationship between grape intake and urinary tartaric acid levels and investigated the ability of tartaric acid to determine grape intake(Reference Garcia-Perez, Posma and Chambers47). The agreement between estimated intake and actual intake was good and a correlation coefficient of R 2 0⋅9 was reported. Overall, these three examples, summarised in Table 2, provide strong evidence of the potential of food intake biomarkers to quantify intake of specific foods and demonstrate the importance of assessing dose–response relationships of identified biomarkers. While these examples support the potential of biomarkers for quantification of food intake, there are a number of limitations worth mentioning. The afore-mentioned studies are reliant on well-controlled feeding studies to estimate the relationships between biomarkers and intake. Not all biomarkers will exhibit a linear relationship with intake thus limiting their potential to predict intake.
Table 2. Summary of studies using food intake biomarkers to quantify intake

4DFD, 4 d food diary.
Developing calibration equations to correct dietary data
Another application of food intake biomarkers is the development of calibration equations that can correct self-reported intake data. Previously, this approach has been applied to nutrient data from the women's health initiative and was used to develop biomarker-calibrated equations which uncovered disease associations that were not identified in uncalibrated data(Reference Tinker, Sarto and Howard48). Work from our research group implemented a similar approach using food intake biomarker data to develop calibration equations utilising self-reported intakes and biomarker-derived estimates of citrus intakes from the National Adult Nutrition Survey(Reference D'Angelo, Gormley and McNulty49). Statistical transformations were performed on the data to achieve optimal calibration specifications, which were then applied to correct for the error in self-reported intake data and achieve a more accurate and objective measure of true intake. This work is very promising, demonstrating the utility of food intake biomarkers in nutrition research, however further investigation is required. Application of this method to other food intake biomarkers would enable the correction of self-reported data in large epidemiological studies and improve dietary assessment. This research also developed a framework for determining the amount of biomarker data that would be required to correct for self-reported error in epidemiological studies, as it is not always feasible to collect biofluids from all subjects(Reference D'Angelo, Gormley and McNulty49). Results indicated that biomarker data from approximately 20–30 % of subjects would be sufficient to correct for errors. This important finding will allow improvement in the accuracy of dietary intake estimation, especially in larger study sample sizes.
Biomarker-based classification of dietary patterns
Analysis of dietary patterns allows researchers to gain a broader insight into dietary intake and habits as opposed to a focus on specific foods. Dietary pattern analysis encompasses the quantities, proportion, variety and combination of foods/beverages consumed as well as the frequency of consumption(Reference Hu50). The ability of metabolomics and food intake biomarkers to classify dietary patterns or monitor adherence to pre-defined diets has been investigated using a range of different study designs (Table 3). Application of interventions studies has elegantly demonstrated that metabolomic profiles can distinguish different dietary patterns. Untargeted metabolomic profiles were employed to distinguish between two Nordic dietary patterns used in an intervention study; the new Nordic diet or an average Danish diet(Reference Andersen, Rinnan and Manach51). A multivariate model was established using urinary metabolome profiles, which classified the two dietary patterns with a low misclassification error rate (19 %). A follow-up paper, using a classification model built on plasma metabolic profiles, was capable of assessing dietary pattern compliance between new Nordic diet and average Danish diet (average ROC AUC for positive and negative mode = 0⋅88 and 0⋅74, respectively)(Reference Acar, Gürdeniz and Khakimov52). Similarly, a plasma metabolome-based dietary pattern classification model was performed by Esko et al. on data from a feeding study(Reference Esko, Hirschhorn and Feldman53). Three different diets with varying macronutrient compositions (low fat (60 % carbohydrate, 20 % fat, 40 % protein), low glycaemic index (40 % carbohydrate, 40 % fat, 20 % protein) and very low carbohydrate (10 % carbohydrate, 60 % fat and 30 % protein)) were distinguishable using this model. The models were able to identify which dietary pattern participants were following in 95 % of cases in the test set(Reference Esko, Hirschhorn and Feldman53). In a separate intervention study, a fasting serum metabolite panel was identified that could distinguish between participants consuming a ‘dietary approaches to stop hypertension’ diet, a fruit and vegetable diet or a control diet. Predictability of the model was examined in a test set reporting a C statistic (AUC) of 0⋅961 indicating good ability to classify individuals into the dietary pattern followed(Reference Rebholz, Lichtenstein and Zheng54). Using a controlled intervention, Garcia-Perez et al. developed a model based on urinary metabolomics data that could classify individuals into dietary patterns. The four diets were based on the WHO healthy eating guidelines for the prevention of non-communicable diseases(Reference Garcia-Perez, Posma and Gibson55). The model was validated in two separate population groups. Collectively, these studies provide strong evidence for biomarker-based metabolomic profiling to classify and monitor adherence to dietary patterns.
Table 3. Using food intake biomarkers for the study of dietary patterns

PLS-DA, partial least squares discriminant analysis; ADD, average Danish diet; NND, new Nordic diet; ROC, receiver operating characteristics; AUC, area under the curve; TMAO, trimethylamine oxide; CHO, carbohydrate; GI, glycaemic index; DAG, diacylglycerols; BCAA, branched chain amino acids; DASH, dietary advice to stop hypertension; MCCV, Monte Carlo cross-validation; F&V, fruit and vegetables; aMED, alternate Mediterranean diet score; AHEI-2010, alternate healthy eating index; HEI-2015, healthy eating index; OPLS-DA, orthogonal partial least squared discriminant analysis; CMPF, 3-carboxy-4-methyl-5-propyl-2-furanpropanoate; Med diet, Mediterranean; MDS, Mediterranean diet score; NA, not applicable; PC, phosphatidylcholine; SM, sphingomyelin; GlcCer, glucosylceramides.
Further evidence is also available from studies performed using cross-sectional data. A recent study demonstrated the ability of 1H NMR profiles to distinguish dietary habits related to varying degrees of meat consumption/avoidance(Reference Lindqvist, Rådjursöga and Malmodin56). Serum metabolite profiles were capable of correctly classifying 97⋅5 % of meat eaters compared to non-meat eaters (ROC AUC = 1) and, inversely, 92⋅5 % of vegans compared to non-vegans (ROC AUC = 0⋅98). Work has emerged to support the potential measurement of adherence to pre-defined dietary patterns such as the Mediterranean diet through metabolomic profiles(Reference Macias, Kirma and Yilmaz57,Reference McCullough, Maliniak and Stevens58,Reference Tong, Koulman and Griffin59) . Macias et al. identified fasting plasma metabolites capable of discriminating between low and high Mediterranean diet score and their correlations with food intakes (ROC AUC = 0⋅74)(Reference Macias, Kirma and Yilmaz57). In a study of postmenopausal women in the US, metabolite levels in serum samples were capable of predicting low and high adherence to four healthy diet scores (the alternate Mediterranean diet score, alternate healthy eating index-2010, dietary approaches to stop hypertension diet and the healthy eating index-2015)(Reference McCullough, Maliniak and Stevens58). Examining a test dataset revealed that the serum metabolites discriminated between high and low quintiles of adherence to the four different healthy dietary pattern scores (ROC AUC ≥ 0⋅76 for each diet score individually)(Reference McCullough, Maliniak and Stevens58). Additionally, a fasting plasma metabolite score was correlated with adherence to Mediterranean diet (Spearman's P = 0⋅42) in a UK population(Reference Tong, Koulman and Griffin59). Overall, these studies add to the evidence base supporting the relationship between metabolites and dietary patterns.
Finally, evidence has also emerged to support the ability of a biomarkers-based approach to determine de novo dietary patterns and classify individuals into these. Research from our group identified two distinct dietary patterns (a healthy and unhealthy pattern) using only urinary metabolomic profiles (n 567). Using this model in an independent study revealed that 94 % of subjects were correctly classified into the correct dietary pattern group(Reference Gibbons, Carr and McNulty60). A recent study used reduced rank regression to identify dietary patterns reflecting metabolites that were pre-selected to be associated with a disease(Reference Johnson, Vanderlinden and DeFelice61). The approach identified three dietary patterns and represents an interesting approach for examining disease-related metabolites and dietary patterns.
Collectively, the emerging data from both intervention and cross-sectional studies support the concept that metabolomic-based food intake biomarker models could be used to identify dietary patterns and to further examine the relationship between dietary patterns and health outcomes in larger epidemiological studies.
Future outlook
While the majority of work to date has focused on the identification of new biomarkers of intake there are promising examples of how these biomarkers could be used in nutrition research. The current limitations in applications of food intake biomarkers stem from the limited number of robust biomarkers already demonstrated in the literature; therefore, future work in this area needs to focus on identifying specific and sensitive food intake biomarkers and validating them according to recently outlined criteria(Reference Dragsted, Gao and Scalbert35). Food intake biomarkers have the potential to improve the accuracy of dietary assessment methods. Biomarkers can be used for the correction of measurement error in dietary data collection using statistical transformations. Metabolomic profiles can be used to classify adherence to dietary patterns and habits in large sample sizes and monitor compliance to study protocols or medically prescribed diets. This improved dietary information can help to unravel the impact and interactions of dietary components in metabolic processes and pathways, as well as elucidating the relationship between diet and disease outcome.
Acknowledgements
The authors would like to thank the Irish section of the Nutrition Society for inviting the present review paper as part of the postgraduate review competition.
Financial Support
This work was supported by an H2020 European Research Council (647783).
Conflict of Interest
None.
Authorship
The authors are jointly responsible for all aspects of preparation of this paper.


