Food security is a multidimensional concept( Reference Mallick and Rafi 1 – Reference Maxwell and Frankenberger 4 ). No single measure can encompass all of its aspects( Reference Mallick and Rafi 1 ). Among the various definitions currently in use, the most commonly accepted is that food security exists ‘when all people, at all times, have physical, social, and economic access to sufficient, safe, and nutritious food to meet their dietary needs and food preferences for an active and healthy life’( 5 ). In contrast, food insecurity reflects the uncertainty of having or the inability to acquire adequate food intake for all household members, and it stems in large part from the lack of sufficient resources to obtain food in socially acceptable ways( Reference Carter, Dubois and Tremblay 6 , Reference Gross, Schoeneberger and Pfeifer 7 ).
The FAO definition of food security covers the four dimensions of food security: food availability, economic and physical access to food, food utilization and stability over time( Reference Gross, Schoeneberger and Pfeifer 7 – Reference Barrett 10 ). These metrics may focus on each or some combination of these domains( Reference Jones, Ngure and Pelto 2 ). In terms of access indicators, the US government pioneered the approach of assessing household food security through questionnaire-based items that ask an adult respondent for the household to report behaviours and experience directly( Reference Leroy, Ruel and Frongillo 8 , Reference Olson 11 , Reference Migotto, Benjamin and Gero 12 ). These experience-based measures differ from other approaches in that they attempt to directly measure food security( Reference Jones, Ngure and Pelto 2 ). Subsequently, a number of other countries, including developing countries, have implemented similar methodologies( Reference Leroy, Ruel and Frongillo 8 , Reference Migotto, Benjamin and Gero 12 ).
One of the major predictors of food insecurity is lower income or poverty, which limits financial resources for acquiring food( Reference Ramsey, Giskes and Turrell 13 , Reference Ivers and Cullen 14 ). In this sense, women and girls are typically the primary group to experience the effects of food insecurity( 15 , Reference Siliprandi 16 ). Gender thus deserves marked attention because the restriction on access to education and employment opportunities weakens the economic autonomy of women( 15 , Reference Siliprandi 16 ). It has also been suggested that gender affects access to health care and nutrition outcomes, especially in cultures that discriminate against females( Reference Darnton-Hill, Webb and Harvey 17 ).
From a social perspective traditional discourses about ‘family’ life and ‘women’s work’ include expectations that women are responsible for caring for their family members and managing household tasks( Reference Martin and Lippert 18 ). A key feminine responsibility is ‘feeding the family’, which requires a series of tasks: meal planning, monitoring the supply of household provisions, shopping, cooking and cleaning( Reference DeVault 19 ). Women are typically household food managers, a role that directly affects the way the family feeds( Reference Hanson, Sobal and Frongillo 20 ).
Increased professional and public discussion of the relationship between food insecurity and gender has motivated a search for a better understanding of the magnitude of the gender difference in the prevalence of household food insecurity. Thus, in the present study, we aimed to contribute to the understanding of this association by systematically reviewing and critically appraising the literature on household food insecurity with respect to whether the respondent was male or female.
Methods
The present systematic review of prevalence studies followed by a meta-analysis was conducted using a predefined protocol and reported in accordance with the MOOSE (Meta-analysis of Observational Studies in Epidemiology) guidelines( Reference Moher, Liberati and Tetzlaff 21 ).
Search strategy
We conducted searches between 28 August 2014 and 19 October 2014 in seven electronic databases: PubMed, Scopus, Web of Knowledge, Embase, LILACS, Scielo and CAPES’s Theses Database. The search was updated in April 2016. The full electronic search strategy for all databases is available in Table 1. The descriptors used in the review process were selected after consulting the Health Sciences Descriptors (DeCs) and Medical Subject Headings (MeSH) terms. The search was conducted with words in Portuguese and/or English (depending on the database) using blocks of two concepts: terms derived from ‘Food Security’, and terms derived from ‘Prevalence’. The Boolean operator ‘OR’ was used to match the descriptors in each block, and the Boolean operator ‘AND’ was used to combine the blocks together. References of the identified papers were also searched to locate studies that were not identified by the search. No restrictions on time period or language were imposed.
Table 1 Search strategy syntax used for each database

MeSH, Medical Subject Heading.
Selection of studies and data extraction
The articles were included if they met the following inclusion criteria: (i) surveys that used population-based sampling methods and that reported the prevalence of household food insecurity or that presented data to calculate it; (ii) studies that stratified the analysis of prevalence by the sex of the head of household or the sex of the respondent; and (iii) interviewed individuals were over 18 years of age. Studies with sick populations, with institutionalized people, duplicates and qualitative studies were excluded.
The selection of articles was carried out using a two-stage process. First, two qualified reviewers (N.M.J. and S.P.) independently screened the titles and abstracts of all identified articles. Second, the full text of the pre-selected articles was also independently assessed using the predefined inclusion criteria. A third reviewer (F.S.B.) solved disagreements when necessary.
Data were extracted and tabulated by two reviewers (N.M.J. and S.P.) using a table containing the following variables: author, title, date of publication, city(s)/state(s)/country(s), study design, study population, sample size, percentage male and percentage female, response rate, instruments, food insecurity categories, prevalence and 95 % confidence interval. Described below and summarized in Table 2, we reviewed the experience-based indicators used by the articles included in the meta-analysis and present information on the scale, classification, score range and recall period of each one.
Table 2 Experience-based indicators used by articles included in this meta-analysis

Assessment of methodologic quality
The quality of the studies was assessed by adapting a guideline for cross-sectional studies( Reference Boyle 22 ). Methodological assessment criteria included the target population, sample size, adequate sample size achieved, response rate, validated questionnaire, interviewer training and confidence intervals.
Statistical analysis
A forest plot was built for the odds ratio of food insecurity prevalence for women v. men. To obtain summary measures, we used random-effects models when the heterogeneity test was statistically significant (P<0·05) and fixed-effect models when the test was statistically non-significant (P≥0·05). Begg’s and Egger’s tests assessed the existence of publication bias. In order to minimize heterogeneity, subgroup analyses were conducted by response rate, measurement tool, probabilistic sample, unit of analysis, gender (sex of the respondent without considering if those individuals were the head of household or sex of the head of household), Human Development Index and geographic location. The geographical division adopted were the continents: Asia, Europe, Africa, Oceania, North, Central and South America. The impact of exclusion of each study on the combined effect was also assessed. We do not report these results because the exclusion of any one of the included studies did not attenuate or increase the effect measure significantly. We also conducted sensitivity analysis by study quality, excluding studies that presented four or more items classified as unclear or/and high risk of bias. Data analyses were performed using the statistical software package Stata version 12.1.
Results
Study selection
The literature search resulted in 5145 articles (2298 from PubMed, 401 from Scopus, sixty-nine from Web of Knowledge, 180 from Scielo, 493 from LILACS, 1550 from Embase, 154 from CAPES’s theses database), which yielded a total of 4381 initial records after duplicate items were removed. The first screening excluded 4158 results and the second screening another 184 results, leaving thirty-nine final records for analysis. References of these articles were checked, resulting in three additional articles. A total of forty-two articles were eligible for review. Figure 1 depicts a flowchart of studies retrieved, screened and included in the systematic review.

Fig. 1 Flowchart of studies retrieved, screened and included in systematic review
Study characteristics
Table 3 describes the characteristics of the included studies. Most were conducted in North (n 17; 40·48 %)( Reference Martin and Lippert 18 , Reference Pia Chaparro, Zaghloul and Holck 23 – Reference Guo, Berrang-Ford and Ford 38 ) and South America (n 15; 35·71 %)( Reference de Souza Bittencourt, Chaves dos Santos and de Jesus Pinto 39 – Reference Falcão, Aguiar and Fonseca 53 ). The country with the highest number of included studies was Brazil (n 13; 30·95 %)( Reference de Souza Bittencourt, Chaves dos Santos and de Jesus Pinto 39 – Reference Godoy, Sávio, Akutsu and de 45 , Reference Marin-Leon, Francisco and Segall-Corrêa 48 – Reference Sobrinho, Silva and Abreu 52 , Reference Pinto 54 ), followed by the USA (n 11; 26·19 %)( Reference Martin and Lippert 18 , Reference Pia Chaparro, Zaghloul and Holck 23 , Reference Dean and Sharkey 24 , Reference Gao, Scott and Falcon 26 , Reference Gowda, Hadley and Aiello 27 , Reference Guerrero, Walsh and Malecki 29 , Reference Leung, Williams and Villamor 30 , Reference Robaina and Martin 32 – Reference Mullany, Neault and Tsingine 34 ). Of the remaining articles, four were carried out in Asia( Reference Mallick and Rafi 1 , Reference Kim, Kim and Shin 55 – Reference Vuong, Gallegos and Ramsey 57 ), three in Europe( Reference Martin-Fernandez, Grillo and Parizot 58 – Reference Álvares 60 ) and three in Africa( Reference Omuemu, Onyiriuka and Otasowie 61 – Reference van den Berg and Raubenheimer 63 ). We did not find any eligible studies from other Latin American countries. The majority of the studies (n 35; 83·33 %) had collected their data from 2000 onwards. Five articles did not present information about the year of data collection( Reference Gao, Scott and Falcon 26 , Reference Gulliford, Mahabir and Rocke 36 , Reference Gustavo and Alejandro 47 , Reference Vuong, Gallegos and Ramsey 57 , Reference Omuemu, Onyiriuka and Otasowie 61 ).
Table 3 Summary of study characteristics and methodological approaches (n 42)

NI, no information; HFSSM, Household Food Security Survey Module; EBIA, Brazilian Food Insecurity Scale; HFIAS, Household Food Insecurity Access Scale; CHFSS, Colombia Household Food Security Survey; CCHS, Canadian Community Health Survey; ELCSA, Latin American and Caribbean Household Food Security Scale; FS, food secure/security; FI, food insecure/insecurity.
* Studies that presented four or more items classified as unclear or/and high risk of bias.
† ‘The food that we bought didn’t last and we didn’t have enough money to buy more?’
‡ ‘In the last 12 months, have you been concerned about having enough food for you or your family?’
§ Used the perception of participants on food production, availability, purchasing power and access to common resources, but did not describe how.
|| Study excluded the child-referenced questions.
¶ ‘In the past 12 months, since (date one year ago) did you or other adults in your household ever cut the size of your meals or skip meals because there was not enough money in the budget for food?’
** Spanish and Portuguese Version.
†† Dichotomization as reported by the study. Others studies had their data dichotomized by the author of the present review.
More than half of the articles (n 22; 52·38 %)( Reference Pia Chaparro, Zaghloul and Holck 23 – Reference Leung, Williams and Villamor 30 , Reference Robaina and Martin 32 – Reference Matheson and McIntyre 35 , Reference Mayer, Hillier and Bachhuber 37 , Reference Guo, Berrang-Ford and Ford 38 , Reference Cabral, Vieira and Sawaya 40 , Reference Godoy, Sávio, Akutsu and de 45 , Reference Maria do Rosário Gondim, Ramos and Martins 50 , Reference Sobrinho, Silva and Abreu 52 , Reference Falcão, Aguiar and Fonseca 53 , Reference Vuong, Gallegos and Ramsey 57 , Reference Neter, Dijkstra and Visser 59 , Reference van den Berg and Raubenheimer 63 ) stratified the prevalence of food insecurity by the sex of the respondent without considering if those individuals were the head of household or not. The remaining studies stratified the outcome by the head of the head of household (n 20; 47·62 %)( Reference Mallick and Rafi 1 , Reference Martin and Lippert 18 , Reference Vahabi, Damba and Rocha 31 , Reference Gulliford, Mahabir and Rocke 36 , Reference de Souza Bittencourt, Chaves dos Santos and de Jesus Pinto 39 , Reference Facchini, Nunes and Motta 41 – Reference dos Santos, Gigante and Domingues 44 , Reference Hackett, Melgar-Quiñonez and Taylor 46 – Reference Panigassi, Segall-Corrêa and Marin-León 49 , Reference Santos 51 , Reference Kim, Kim and Shin 55 , Reference Omidvar, Ghazi-Tabatabie and Sadeghi 56 , Reference Martin-Fernandez, Grillo and Parizot 58 , Reference Álvares 60 – Reference Endale, Mengesha and Atinafu 62 ). Sample sizes ranged from fifty to 65 190 households or individuals. Half of them (n 21) had sample sizes of more than 1000( Reference Mallick and Rafi 1 , Reference Martin and Lippert 18 , Reference Dean and Sharkey 24 , Reference Gao, Scott and Falcon 26 , Reference Gowda, Hadley and Aiello 27 , Reference Guerrero, Walsh and Malecki 29 , Reference Leung, Williams and Villamor 30 , Reference Matheson and McIntyre 35 , Reference Mayer, Hillier and Bachhuber 37 , Reference de Souza Bittencourt, Chaves dos Santos and de Jesus Pinto 39 , Reference Facchini, Nunes and Motta 41 , Reference Ferreira Hda, Souza and Moura 42 , Reference dos Santos, Gigante and Domingues 44 – Reference Hackett, Melgar-Quiñonez and Taylor 46 , Reference Marin-Leon, Francisco and Segall-Corrêa 48 , Reference Sobrinho, Silva and Abreu 52 , Reference Kim, Kim and Shin 55 , Reference Martin-Fernandez, Grillo and Parizot 58 , Reference Álvares 60 , Reference van den Berg and Raubenheimer 63 ). Food insecurity was assessed by a range of different instruments.
Prevalence of food insecurity
Of the forty-two studies, thirty-five reported data that enabled the calculation of prevalence of food insecurity. We contacted seven authors for additional information, but only two responded. Of the remaining five articles, four studies reported an OR as the measure of effect. In these studies a logarithm transformation was made in order to get logarithm OR and its se. One study reported the relative risk and this measure was converted into an OR( Reference Zhang and Yu 64 ).
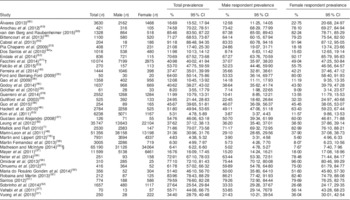
The overall prevalence of food insecurity as well as the prevalence stratified by gender is shown in Table 4. The results of the included studies showed a wide range in the prevalence of food insecurity, from 4·83 %( Reference Martin and Lippert 18 ) to 91·18 %( Reference Cabral, Vieira and Sawaya 40 ). Household food insecurity reported by males ranged from 3·87 %( Reference Kim, Kim and Shin 55 ) to 83·33 %( Reference Cabral, Vieira and Sawaya 40 ), whereas in females it ranged from 5·60 %( Reference Martin and Lippert 18 ) to 96·00 %( Reference Omidvar, Ghazi-Tabatabie and Sadeghi 56 ). In general, prevalence was higher in females than males, except in four studies( Reference Pia Chaparro, Zaghloul and Holck 23 , Reference Gao, Scott and Falcon 26 , Reference Robaina and Martin 32 , Reference Sobrinho, Silva and Abreu 52 ).
Table 4 Prevalence of household food insecurity and food insecurity according to female and male respondents (n 37)

* The analysis of ‘both’ being the household head was not used.
† Data from the South and Northeast region have been grouped.
‡ The prevalence for the year 2003 was considered.
§ Data from married and non-married have been grouped.
The combined OR of household food insecurity by gender of the respondent (women v. men) across the forty-two studies was 1·40 (95 % CI 1·27, 1·54) with the random-effect model (Fig. 2). Heterogeneity was statistically significant (Q=399·56; P<0·001). Similarly, sensitivity analyses excluding fifteen studies with high risk of bias showed an OR of food insecurity by gender of 1·46 (95 % CI 1·32, 1·63).

Fig. 2 Forest plot of the odds ratio of food insecurity prevalence in women v. men from forty-two studies. The study-specific OR and 95 % CI are represented by the grey square and horizontal line, respectively; the area of the grey square is proportional to the specific-study weight to the overall meta-analysis. The circle and dashed line represent the pooled OR
Subgroup analysis
In general, the heterogeneity among studies was not reduced using subgroup analysis (Table 5). Subgroup analysis supported the claim that female gender is associated with household food insecurity when gender analysis is based on the sex of the head of household but not when gender analysis is based only on the sex of the respondent. In this sense, our research demonstrates that female-headed households were 75 % more likely to be food insecure than male-headed households. In addition, important gender differences were observed between the continents.
Table 5 Odds ratio of household food insecurity in women v. men respondents according to subgroups

EBIA, Brazilian Food Insecurity Scale; HFSSM, Household Food Security Survey Module; USDA, US Department of Agriculture; CHFSS, Colombia Household Food Security Survey; HFIAS, Household Food Insecurity Access Scale; ELCSA, Latin American and Caribbean Household Food Security Scale.
* Fixed-effects models were used when the heterogeneity test was statistically non-significant (P≥0·05) and random-effects models when the test was statistically significant.
† The comparison group to female-headed household was male-headed household.
Risk of bias assessment
The quality assessment of the included studies is shown in Fig. 3. Most of the studies had low risk of bias in terms of the definition of target population as well as in terms of use of a probabilistic sample. More than half of the works used validated questionnaires. About half of the authors did not report training of interviewers. The majority of the studies were classified as being at ‘risk’ or having ‘unclear risk’ in the response rate domain.

Fig. 3 Summary of quality assessment of studies included in the review (n 42), according to the risk of bias (![]() , low risk;
, low risk; ![]() , unclear risk;
, unclear risk; ![]() , high risk) in each domain assessed by the instrument proposed by Boyle(
Reference Ramsey, Giskes and Turrell
13
)
, high risk) in each domain assessed by the instrument proposed by Boyle(
Reference Ramsey, Giskes and Turrell
13
)
Publication bias
According to both Begg’s and Egger’s tests, no publication bias was detected. These results were confirmed by funnel plot symmetry.
Discussion
The present meta-analysis assessed the gender difference in the prevalence of household food insecurity. In general, our results showed that the gender of the respondent is a significant predictor of food insecurity. However, subgroup analysis demonstrated that food insecurity was higher when the female respondent was the head of household but not when women were only respondents without considering if they were the head of household or not. This finding is consistent with the worldwide phenomenon of female-headed households. For example, the results of American household food security showed that the prevalence of food insecurity in households headed by women was higher than the national average( Reference Behzadifar, Behzadifar and Abdi 65 ).
It has been argued that this gender difference may be related to economic and cultural factors. As for economic factors, women tend not to receive the same employment opportunities as men, a situation that imposes some restrictions. Women often have jobs with lower pay either because they face discrimination in the labour market or because the obligations of housework and childcare force them to choose jobs that are suited to their responsibilities( 15 , Reference Álvarez-Uribe, Estrada-Restrepo and Fonseca-Centeno 66 ). For example, a population-based study among families living in the Northeast and South of Brazil found lower earning power in female-headed households. The authors reported that the average income per capita in households headed by women was about 30 % lower than in those headed by men. Since males earn more than females, a household lacking male-earned income has a higher probability of being poor( Reference Facchini, Nunes and Motta 41 ). In addition, in some societies, sociocultural factors can prohibit women’s participation in the labor force. In some of the poorest areas of South Asia, cultural restrictions on women’s ability to participate fully in food production activities have left them particularly vulnerable in times of economic crisis( Reference Mallick and Rafi 1 ).
The association between female gender and food insecurity has been addressed in debates about poverty and gender. Women constitute 70 % of the world’s poor( Reference Ivers and Cullen 14 ), a phenomenon known as the feminization of poverty( Reference Siliprandi 16 , Reference de Souza Bittencourt, Chaves dos Santos and de Jesus Pinto 39 ). Some reasons for this are attributed to the lower income earned by women compared with men in the workplace( Reference Siliprandi 16 , Reference de Souza Bittencourt, Chaves dos Santos and de Jesus Pinto 39 , Reference Barros, Fox and Mendonca 67 ). The factors that could explain this income gap include: (i) fewer hours worked by women; and (ii) the tendency for women to work in occupations that pay lower salaries or in lower positions within other occupations( Reference Barros, Fox and Mendonca 67 ). Thus, gender equality remains an elusive goal in many countries and a transformation of traditional gender roles is urgently needed. Such a transformation can be enhanced with improved information about the range of inequalities and specific constraints facing women in the field of food security( 15 ).
From the point of view of cultural issues, it may be assumed that men and women perceive and react to situations differently given their roles in society. The fact that women exhibit greater sensitivity to household needs than men is supported by the observation that women exhibit greater concern than men for the well-being of others( Reference Matheson and McIntyre 35 ). Since females are responsible for a large part of the tasks connected with food, they would likely be more attuned to food security problems of their family( Reference Carter, Dubois and Tremblay 6 , Reference Ivers and Cullen 14 , Reference Siliprandi 16 , Reference Hanson, Sobal and Frongillo 20 ). Women could be considered as the forefront of households to remove poverty and hunger( Reference Behzadifar, Behzadifar and Abdi 65 ). For example, mothers are often the first to cut or skip meals when food access is constrained to ensure that other family members, particularly children, have access to sufficient food( Reference Siliprandi 16 , Reference Hanson, Sobal and Frongillo 20 , Reference Ford and Berrang-Ford 25 , Reference Behzadifar, Behzadifar and Abdi 65 ).
Despite the fact that women contribute to one-half of the world’s food production, in terms of lack of access to productive factors, such as land, credit, inputs, storage and technology, women also face many inequities and constraints, often embedded in norms and practices and encoded in legal provisions( Reference Ivers and Cullen 14 , 15 , Reference Endale, Mengesha and Atinafu 62 ). Besides that, in many developing countries, most resources, including land, are owned by males. Social and cultural norms and gender roles that are imposed must be challenged so that a greater role for women in decision making at all levels can be attained. Women’s empowerment, besides being a priority goal in itself, is an intrinsic human right( 15 ).
To the best of our knowledge, the present article is the first to investigate gender differences in the prevalence of household food insecurity through a systematic review and meta-analysis. The study’s generalizability is strengthened by a large number of included studies from various countries. However, the absence of representative studies from Asia and Africa can be considered an important limitation. We believe this is due to the fact that most of the studies on food insecurity conducted in these continents were with sick populations, which was an exclusion criterion of our study. This skewed distribution of studies might have biased the gender differences in the reporting of food insecurity. A further limitation of our review was the substantial heterogeneity that could not be totally explained by subgroup analysis. Food insecurity was assessed and defined differently across studies, which can be explained by the fact that food insecurity is a multidimensional concept( Reference Barrett 10 ). Different measurement tools have different strengths and weaknesses and can often result in estimations or interpretations that differ significantly( Reference Ivers and Cullen 14 ). A more in-depth understanding of the concept of food insecurity and its measurement would require further studies, potentially using qualitative approaches.
Conclusion
In conclusion, our results confirm the existence of gender differences in reporting household food insecurity. Furthermore, they indicate that households headed by women constitute a segment of the population that is particularly vulnerable to food insecurity. Given the magnitude of the burden of food insecurity, this information is an important element to be incorporated into policies to promote food security and gender equity.
Acknowledgements
Financial support: This research received no specific grant from any funding agency in the public, commercial or not-for-profit sectors. Conflict of interest: The authors have no conflict of interest to declare. Authorship: Each of the authors made a direct contribution to this manuscript. N.M.J., F.S.B. and M.B.N. directed the study and were involved in the study design; N.M.J. and S.P. reviewed the literature and selected the eligible studies; N.M.J. and S.P. extracted the data; N.M.J., F.S.B. and M.P.P. performed the statistical analysis; N.M.J., F.S.B., M.B.N. and M.P.P. wrote the manuscript. All authors reviewed and approved the final manuscript. Ethics of human subject participation: Not applicable.