


As one of the major carotenoids in the human retina, lutein exists in high concentrations in the macula lutea and protects against actinic damage and enhances visual function in shortwave dominant-viewing conditions in both infants and adults(Reference Bernstein, Khachik and Carvalho1–Reference Stringham and Hammond5). Moreover, present research has reported that lutein plays an important role in the early development and maturation of retinal and visual functions in infants(Reference Hammond6, Reference Zimmer and Hammond7). However, lutein is not produced by the human body but is present in high concentrations in green leafy vegetables such as spinach and kale(Reference Perry, Rasmussen and Johnson8, Reference Humphries and Frederick9). Because there is a high amount of lutein in vegetables, high lutein intake might reflect an overall healthy diet(Reference Leermakers, Felix and Jaddoe10). Moreover, according to the WHO, as the primary and preferred source of nutrition for infants through 6 months of age, breast milk provided infants with all essential nutrients, including lutein(Reference Bzikowska-Jura, Czerwonogrodzka-Senczyna and Oledzka11). Therefore, breast milk lutein concentrations depend principally on the nutritional status of the mother.
Several studies have compared the breast milk lutein concentrations in several countries, and the results showed that the mean values of breast milk lutein concentrations were 25 (sd 19) μg/l and the concentrations showed notable differences in different regions, ranging from 3 to 44 (sd 18) μg/l(Reference Canfield, Clandinin and Davies12, Reference Lipkie, Morrow and Jouni13). In China, Xue et al. (Reference Xue, Campos-Giménez and Redeuil14) reported that the concentration range of lutein in breast milk on 240 d postpartum was 22–70 μg/l from a cross-sectional study, but there was no cohort study on the changes in breast milk lutein concentrations over time in Chinese women. Furthermore, some studies reported positive correlations between breast milk lutein concentrations and dietary lutein intake in several countries, such as Italy and South Korea(Reference Cena, Castellazzi and Pietri15, Reference Kim, Yi and Jung16). Compared with the number of studies in foreign countries, there is only one study(Reference Xu, Zhao and Y17) in China that described the relationship between infant plasma lutein level and the corresponding level in milk; however, the association between dietary lutein intake and the levels of breast milk lutein concentrations in Chinese women has not yet been reported.
Considering the importance of lutein for infants, the aim of the present study was to investigate the changes in breast milk lutein concentrations after 12 weeks of lactation and to explore the association between dietary lutein intake and breast milk lutein concentrations among lactating Chinese women.
Materials and methods
Subjects and sample
We conducted a follow-up study for 12 weeks from January 2017 to September 2018. Lactating women were recruited from a local maternal and child care service centre in Liuyang, Human, China. Liuyang is a county-level city located in eastern Hunan province with a total population of 1·37 million. It is also the largest base of fireworks production and trade base in the world, and its county economy and basic competitiveness ranks 19th of the national top 100 counties. With the help of doctors in Liuyang maternal and child care service centre, we invited breast-feeding mothers to participate with a poster and recruited subjects. The concentrations of lutein in breast milk ranged from 3 to 44 (sd 18) μg/l(Reference Canfield, Clandinin and Davies12, Reference Lipkie, Morrow and Jouni13) and 22–70 μg/l in China(Reference Xue, Campos-Giménez and Redeuil14), with a probability of 0·05 and confidence level of 95 %; we calculated a reference range for the sample size according to the sample size calculation equation  $(N = {{2{{\left( {{z_\alpha } + {z_\beta }} \right)}^2}{\sigma ^2}} \over {{d^2}}})$. With references to other studies(Reference Xue, Campos-Giménez and Redeuil14, Reference Jewell, Mayes and Tubman18) (the range of sample size is 13–540), we determined the sample size ranging from thirty to forty per group. Finally, a total of forty-four lactating women were recruited, and thirty-seven of them finished the follow up with seven lost.
The inclusion criteria were as follows: younger than 35 years old, postpartum BMI < 28 kg/m2, the baby was born after 37–42 weeks of gestation, the baby’s birth weight was normal ranging from 2500 to 4000 g and the participant and her baby were in good physical condition with no obvious disease. The exclusion criteria were pre-pregnancy diabetes, fetal anomalies, gestational hypertension, pre-eclampsia, fetal growth restriction, ruptured membranes, postpartum glucose abnormalities, consumption of supplements with lutein, DHA or vitamin E, and insufficient language skills to comprehend the study questionnaires.
All procedures were approved by the Medical Ethics Committee of Peking University. Mothers provided informed consent on their own behalf and on behalf of their infants.
Human milk sample collection
Lutein is very sensitive to both light and oxygen; therefore, precautions were taken to decrease exposure of breast milk samples to air and/or light throughout all phases of the study. We collected 30 ml milk samples every visit, between 09.00 hours and 10.00 hours from lactating women before maternal breast-feeding on postpartum weeks 4, 8 and 12 in a dimly lit room (without direct sunlight exposure) of the Liuyang Maternal and Child Care Service Centre. All samples were collected into polypropylene tubes that were labelled with subject information (including the infant’s birth date, date of milk collection and the initials of the mother). The samples were stored at −80°C and then sent to the Peking University Health Science Center until analysis, which was usually performed within 3 d.
Analysis of lutein in human milk
The determination method of lutein was referred to Khachik classic method and was slightly modified. Validation of characteristics such as specificity, linearity, limit of detection, limit of quantification, accuracy and precision were valued in the previous literature(Reference Xue, Campos-Giménez and Redeuil14, Reference Zou, Xu and Huang19, Reference Zou, Xu and Lin20). Frozen human milk was thawed overnight at room temperature, 0·2 ml of internal standard (2·5 ng/ml in ethanol), 0·02 g of butylated hydroxytoluene (BHT), 1 ml of ethanol containing 0·1 % BHT and 20 µl of aqueous solution of potassium hydroxide (KOH) (20 %, w/w) were added successively to 1 ml of milk in a 5-ml tube. After mixing, the tube was placed for 30 min in a shaking water bath at 25°C for saponification. Then, 1 ml of a mixed solution of hexane and diethyl ether in a 2:3 (v/v) ratio was added to the samples. After mixing, the samples were centrifuged at 3500 rpm for 3 min; two extractions were performed; the samples were washed with distilled water and dried under N2 at room temperature. The residue was reconstituted in 200 µl of dioxane–ethanol (1:1, v/v).
After vortexing for 10 s, the samples were centrifuged at 3000 rpm for 2 min at 4°C and transferred to amber vials. Then, the samples were injected into a HPLC (Agilent 1260 Infinity LC System, Agilent Technologies) and detected at 450 nm. Separation was performed on a Develosil C30 column (150 × 4·6 mm, 5 μm particle size, Nomura Chemical) in series with a Develosil C30 column (10 × 4·0 mm, 5 μm particle size, Nomura Chemical). A 20 µl aliquot of the final extract was injected into the analytical system. The gradient eluting system pumped the mobile phase at a flow rate of 1 ml/min. Mobile phase A was a mixture of acetonitrile–methanol (60:40, v/v), and mobile phase B was a solution of methyl tert-butyl ether. The eluting gradient programme was as follows: 0–15 min, 0 % B; 15–20 min, 42 % B; 20–30 min, 100 % B. External quantification was performed based on the calibration curve of lutein. The linearity of the calibration curve was verified from the regression coefficient of 0·999. Apart from the internal standard, spiking tests were performed using human milk to ensure adequate recovery of lutein. The average recovery of three replicate analyses was 85 %, and the range was 82–88·8 %. Repeatability experiments for the same sample provided a relative standard deviation of 1·86 %. The range of the calibration curve for lutein was 2–50 µg/l, the limit of quantification and limit of detection were 0·6 and 5 µg/l, respectively.
Dietary lutein intake assessment
An FFQ was used to assess dietary lutein intake and daily dietary lutein intake was calculated based on dietary lutein intake. Our FFQ for lutein were derived from the Chinese dietary FFQ from the Chinese Centre for Disease Control and Prevention(Reference Zhao, Huang and Zhang21, Reference Li, He and Zhai22). It contained thirty-five questions related to the top thirty-one common vegetables and top four common fruits rich in lutein, in each question they were asked the frequency of food per d/week/month and average amount per serving during the past 30 d.
Up to now, there is no comprehensive database of carotenoid for Chinese foods; therefore, the daily dietary lutein intake was calculated based on the combination of the lutein content in seventy-seven common vegetables and fruits from Chinese study(Reference Wang, Dong and Sun23, Reference Wang and Lin24) and 140 kinds of non-mixed food in Carotenoid Content of U.S. Foods: An Update of the Database (http://ndb.nal.usda.gov/). After excluded foods undetected or low lutein content (less than 50 ug/100 g) or uncommon in China, finally sixty common vegetables and fruits were listed in the lutein content database for Chinese food (Supplementary Table S1), which was also evaluated in other studies(Reference Ma25, Reference Zhang, Zhu and Cai26). Our FFQ covered 58·3 % common food rich in lutein and can estimate majority of daily lutein intake in China because of the striking difference of lutein content in foods (Supplementary Table S1).
Other information collection
Participants were provided with questionnaires and were asked to answer them while waiting for their check-up at 4, 8 and 12 weeks postpartum. The following demographic and physical characteristic information was collected: age, pregestational BMI, prepartum BMI, gestational weight gain, education level, vision, profession, family monthly income, delivery mode, weight, blood pressure, daily outdoor time and daily sleep time.
The cut-off points for BMI were refer to appropriate body mass index for Asian populations and its implications for policy and intervention strategies(27). We used the suggested categories as follows: less than 18·5 kg/m2 underweight, 18·5–23 kg/m2 increasing but acceptable risk, 23–27·5 kg/m2 increased risk and 27·5 kg/m2 or higher high risk.
For blood pressure, it was measured using a standardised mercury sphygmomanometer (model XJ1ID) recommended by the National High Blood Pressure Education Program Working Group on High Blood Pressure in Pregnancy(Reference Chobanian, Bakris and Black28–30). Blood pressure was measured three consecutive times with an interval of 5 min from the right arm, after each participant had rested for at least 10 min and finally a mean of the three measurements was considered as the blood pressure. The cut-offs for normal levels of blood pressure according to Chinese Guidelines for the Prevention and Treatment of Hypertension (revised 2018) (30): systolic blood pressure is <120 mmHg and diastolic blood pressure is <80 mmHg.
For vision, experienced eye care professionals measured each eye by using a retro-illuminated logMAR (log minimum angle of resolution) chart with tumbling-E optotypes (Precision Vision)(Reference Lougheed31); in the present study, we also followed the definitions for population surveys set by the International Council of Ophthalmology in cooperation with the WHO and the International Agency for the Prevention of Blindness(Reference Colenbrander32).
For daily outdoor time, we asked the young mothers how many hours they go out for walk during the past 7 d.
Ethical statement
All procedures of the present study were approved by the Medical Ethical Committee of the Peking University.
Statistical analysis
Descriptive data are presented as means and standard deviations for continuous variables and percentages for categorical variables. Changes in lutein content of breast milk over different lactation stages were tested with repeated-measures ANOVA. The correlation between breast milk lutein concentrations and dietary lutein intake during lactation was investigated by Pearson’s correlation coefficient. Additionally, a sensitivity analysis was completed to verify the correlation. The general linear relationships between dietary lutein intake and breast milk lutein concentrations were estimated with mixed stepwise regression; model 1 was adjusted for age, prepartum BMI and gestational weight gain; model 2 was further adjusted for level of education, daily outdoor time, occupation and family monthly income. Potential associations between breast milk lutein concentrations and dietary lutein intake are presented using standardised β-coefficients and associated P values. All analyses were carried out using SPSS Statistics Software, version 22.0 (IBM), and a P value of less than 0·5 was considered significant.
Results
Characteristics of the study participants
The mean age of the thirty-seven lactating women was 28·9 (sd 4·27) years, and the pregestational BMI of all of the participants was at a normal level. The gestational weight gain was 16·03 (sd 4·27) kg, and the mean blood pressure was at a normal level. The mean outdoor time daily was 1·03 (sd 0·75) h, and the mean daily sleep time was 8·23 (sd 2·35) h. The characteristics of the lactating women are summarised in Table 1.
Table 1. Characteristics of lactating women at 4 weeks postpartum (n 37)
(Mean values and standard deviations; numbers of participants and percentages)
Concentrations of lutein at different times
Fig. 1 shows the changes in dietary lutein intake and breast milk lutein concentrations. In the present study, the mean values of dietary lutein intake at 4, 8 and 12 weeks postpartum were 5·22 (sd 3·60), 7·28 (sd 4·30) and 7·33 (sd 4·24) mg/d, respectively. Dietary lutein intake increased continuously over time and significant changes were observed in dietary lutein intake during the 12 weeks after delivery (P = 0·046). The mean values of breast milk lutein concentrations at 4, 8 and 12 weeks postpartum were 46·41 (sd 41·36), 57·96 (sd 40·00) and 62·33 (sd 30·10) μg/l, respectively; the change in breast milk lutein concentrations was similar to that of dietary lutein intake.
Fig. 1. Changes in dietary lutein content (![]() ) and breast milk lutein concentrations (
) and breast milk lutein concentrations (![]() ) over time.
) over time.
Association of dietary lutein intake and breast milk lutein concentrations
Breast milk lutein concentrations were positively associated with dietary lutein intake at 4 weeks postpartum (r 0·527, P < 0·05) (Fig. 2(a)), which was consistent with the positive correlations at 8 and 12 weeks postpartum (r 0·444, P < 0·05; r 0·468, P < 0·05) determined by sensitivity analysis (Fig. 2(b) and (c)).
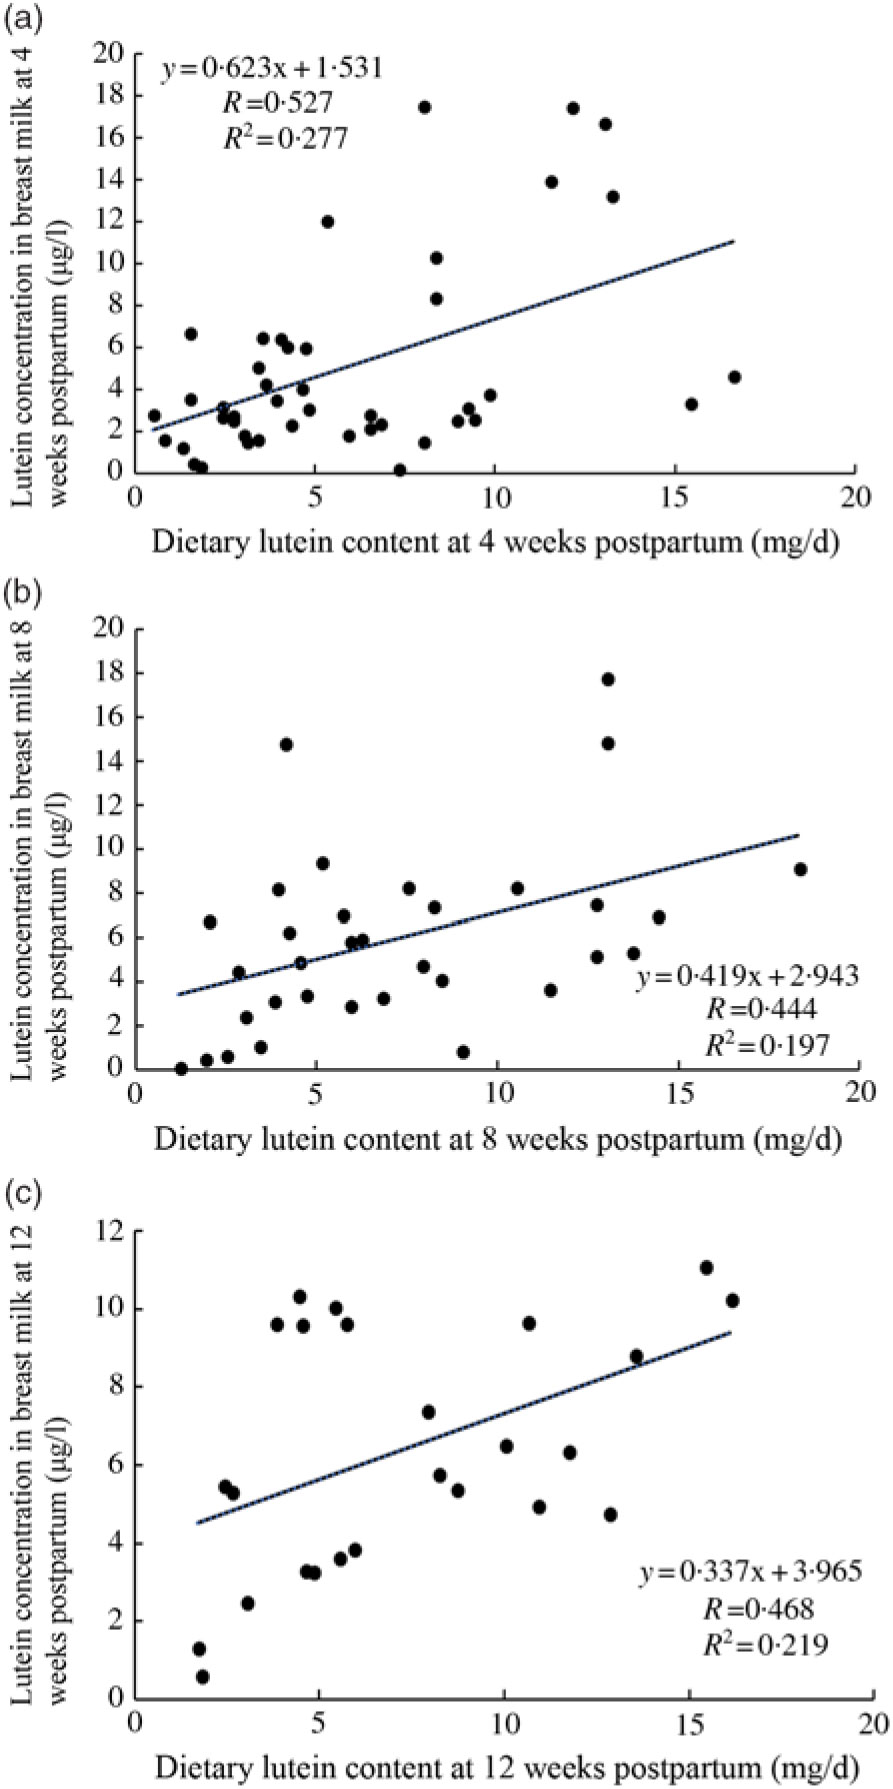
Fig. 2. Association between dietary lutein intake and breast milk lutein concentrations. (a) Association between dietary lutein intake and breast milk lutein concentrations at 4 weeks postpartum; (b) and (c) sensitivity analysis of association of dietary lutein intake and breast milk lutein concentrations.
General linear relationships between dietary lutein intake and breast milk lutein concentrations
Table 2 shows the general linear model results for the association between dietary lutein intake and breast milk lutein concentrations adjusted for related factors at 4 weeks postpartum. In model 1, the standardised coefficient for the association was 0·462 (95 % CI 0·197, 0·857; P = 0·003) after adjusting for age, prepartum BMI, gestational weight gain, occupation, family monthly income, and it remained significant (0·382, 95 % CI 0·074, 0·761; P = 0·019) after further adjustment for level of education, daily outdoor time, occupation and family monthly income in model 2.
Table 2. General linear relationships between dietary lutein intake and breast milk lutein concentrations* (Standardised coefficients and 95 % confidence intervals)
* A general linear regression model was used to calculate the association between breast milk lutein concentrations (dependent variable) and dietary lutein intake (independent variable) at 4 weeks postpartum.
† Model 1: adjusted for age, prepartum BMI, and gestational weight gain.
‡ Model 2: further adjusted for occupation, family monthly income, level of education, and daily outdoor time.
Discussion
In our study, we found that the longitudinal trends of dietary lutein intake and breast milk lutein concentrations increased during the 12 weeks after delivery in Chinese women. Furthermore, breast milk lutein concentrations were found to be positively associated with dietary lutein intake in Chinese lactating mothers, and the correlation coefficient was obtained.
Up to now, there is no comprehensive database of carotenoid for Chinese foods. In our database (Supplementary Table S1), the contents in spinach (12 198 µg/100 g), kale (39 550 µg/100 g) and parsley (11 434·1 µg/100 g) are derived from Carotenoid Content of U.S. Foods: An Update of the Database (http://ndb.nal.usda.gov); the content in spinach is consistent with Perry’s study (12 640 µg/100 g)(Reference Perry, Rasmussen and Johnson8) and higher than a Singapore study (6051 µg/100 g)(Reference Isabelle, Lee and Lim33), while the content in parsley is higher than Humphries’s study (9924 µg/100 g)(Reference Humphries and Frederick9). The results also indicated that dietary lutein intake increased over time and was positively associated with breast milk lutein concentrations and dietary lutein intake at 4, 8 and 12 weeks postpartum; these results were consistent with those of previous studies(Reference Cena, Castellazzi and Pietri15, Reference Kim, Yi and Jung16). In addition, previous research has identified a significant correlation between breast milk lutein concentrations and plasma lutein concentrations(Reference Sherry, Oliver and Renzi34, Reference Mackey, Albrecht and Oliver35). Regarding the reason dietary lutein intake increased over time in Chinese women, this increase may be influenced by inter-individual variability and women’s dietary habits(Reference Meneses and Trugo36, Reference Tucker, Chen and Vogel37). Liuyang is a county-level city located in eastern Hunan province that is deeply affected by traditional Chinese customs, and all lactating women must experience confinement in childbirth for the first month after delivery(Reference Raven, Chen and Tolhurst38). Fruits and vegetables were thought to be cold foods and lactating women ate less fruits and vegetables during confinement; therefore, the dietary lutein intake and the breast milk lutein concentrations would be low and would increase over time with the increased intake of fruits and vegetables after confinement(Reference Sherry, Oliver and Renzi34, Reference Mackey, Albrecht and Oliver35). Based on these studies, dietary recommendations advising a greater intake of fresh fruits and vegetables rich in lutein are extremely useful during pregnancy and lactation.
To date, research on breast milk lutein concentrations in Chinese women has been limited. In our study, the mean breast milk lutein concentration range was 46·41–62·33 µg/l, which was consistent with other studies in China. Lipkie et al. (Reference Lipkie, Morrow and Jouni13) reported the breast milk lutein ranging 22–70 μg/l during 26 weeks postpartum and Xue et al. (Reference Xue, Campos-Giménez and Redeuil14) found the median concentrations ranging 40–102 μg/l from 509 healthy mothers in several cities in China. However, the breast milk lutein concentration was a bit higher than that from other countries, such as Northern Ireland (36·18 µg/l)(Reference Jewell, Mayes and Tubman18), South Korea (35·00 µg/l)(Reference Kim, Yi and Jung16), Japan (29·07 µg/l), Mexico (27·25 µg/l) and the UK (12·73 µg/l)(Reference Jackson and Zimmer39). In addition, most previous studies in other countries reported that breast milk lutein concentrations significantly decreased as the lactation stage progressed, particularly from week 2 to 4 and stabilised at 4–16 weeks postpartum(Reference Lipkie, Morrow and Jouni13, Reference Song, Jouni and Ferruzzi40, Reference Schweigert, Bathe and Chen41), and others reported that the concentration reduced over time(Reference Jewell, Mayes and Tubman18). However, we found that breast milk lutein concentrations increased from 4 weeks to 12 weeks postpartum, which was different from the previous results. This difference may be attributable to differences in several factors, such as distinct dietary patterns, regional differences(Reference Lipkie, Morrow and Jouni13, Reference Jackson and Zimmer39, Reference Jackson, Lien and White42), the availability of fruits and vegetables and preferred dish preparation methods. More studies are needed to confirm the regional differences and illuminate their potential mechanisms.
Previous studies have documented that demographic characteristics (age, sex, race/ethnicity, education), BMI and lifestyle factors (physical activity, sunlight exposure, smoking, alcohol consumption) were also reported to be significantly (P < 0·05) associated with dietary lutein intake(Reference Rock, Thornquist and Neuhouser43–Reference Wang, Chung and McCullough46). In the present study, considering the effect of non-dietary factors on lutein intake, the analyses were adjusted for a substantial number of confounders, including age, prepartum BMI, level of education, occupation, family monthly income, daily outdoor time and gestational weight gain.
The present study has several strengths. Firstly, compared with cross-sectional studies, a longitudinal study is more sensitive to investigate the trends of breast milk lutein concentration during the lactation stage(Reference Lipkie, Morrow and Jouni13). Secondly, an FFQ was used to explore the dietary intake of lactating women in the study. Compared with the 24-h recall method, the FFQ is simple and low cost and it can quickly reveal the types and content of food intake at ordinary times, reflecting the long-term nutrient intake. Moreover, it is more suitable for the evaluation of food and nutrient intake(Reference Crozier, Inskip and Godfrey47, Reference Gabriele, Dorothee and Tilla48).
Our findings should also be interpreted in the context of the following limitations. Firstly, breast milk samples at week 0 were not collected in the present study because of the difficulties inherent to the enrolment of postpartum women and budgetary constraints. Secondly, dietary intake data were not available before the participants were pregnant because we started to collect the data after delivery; the dietary lutein intake may be underestimated due to limitations in the food content data, so some daily dietary food intakes might have been ignored. Furthermore, not all foods were covered in our questionnaire; only the top thirty-one common vegetables and top four common fruits rich in lutein were selected. Therefore, though we only covered 58·3 % common food in the database, the results from top thirty-one common vegetables and top four common fruits rich in lutein can estimate majority of daily lutein intake because of the striking difference of lutein content in foods. Meanwhile, we conducted the dietary frequency survey for three times and the results of lutein data were closely associated with the lutein concentration in breast milk, which indicated that the results were relatively consistent.
In conclusion, dietary lutein intake and breast milk lutein concentrations of lactating Chinese women increased with time after delivery and showed a significant positive correlation. Therefore, women of child-bearing age should be encouraged to increase dietary intake of vegetables and fruits that are rich in lutein during pregnancy and the postpartum period.
Acknowledgements
The authors gratefully acknowledge all the team members and the participating infants and mothers and the great support of Liuyang Maternal and Child Care Service Centre, Changsha.
The present study was funded by the Danone Nutrition Fund (DIC2016-09) and China Scholarship Council.
Z. Z. Y. and Z. Z. F. conceived and designed the project; Z. Y. Q. and Y. J. completed the experiment and prepared the manuscript; X. L. Y., L. H. and L. J. Y. collected the milk samples; Z. Z. Y., Z. Z. F. and L. J. Y. were involved in writing the article and provided a final approval of the submitted and published versions.
None of the authors has any conflicts of interest to declare.
Supplementary material
For supplementary material/s referred to in this article, please visit https://doi.org/10.1017/S0007114519001727


