


Iodine is an essential component of the thyroid hormones which are required for brain and neurological development in fetal and early life(Reference Glinoer1,Reference Williams2) . There is emerging evidence that even mild-to-moderate iodine deficiency in pregnancy is associated with suboptimal child neurodevelopmental outcomes(Reference Bath3). It is also increasingly clear that the role of pre-pregnancy iodine stores is important(Reference Dineva, Fishpool and Rayman4) and that women of childbearing age need to ensure adequate iodine intake to maximise their thyroid iodine stores prior to pregnancy.
As there is no formal universal salt iodisation policy in the UK, dietary sources are more important determinants of iodine intake. In the UK, as is the case in many industrialised countries, milk and dairy products are an important dietary source of iodine, contributing 25–70 % of total daily iodine intake(Reference Van der Reijden, Zimmermann and Galetti5). Results from the National Diet and Nutrition Survey (NDNS) between 2014 and 2016 indicate that milk and dairy products accounted for 34 % of the average daily iodine intake of UK adults (19–64 years) and 51 and 40 % of the iodine intake of children (4–10 years) and adolescents (11–18 years), respectively(6). Although fish is a rich natural source of iodine(Reference Bath and Rayman7), it is not consumed widely and its contribution to iodine intake in the UK is relatively small(6).
Cows’ milk has a low natural iodine content, but various dairy-farming practices, including the use of iodine-supplemented cattle-feed and iodophor disinfectants for teat-cleaning and sterilising milking equipment, increase its iodine content as a result of carry-over into the milk(Reference Flachowsky, Franke and Meyer8–Reference Flachowsky, Schöne and Leiterer10). A recent study that collected milk samples from UK supermarkets in the summer and the winter reported an overall milk iodine concentration of 427 µg/l(Reference Stevenson, Drake and Givens11), providing approximately 85 µg iodine per glass (200 ml), which would contribute 57 % of the WHO recommended iodine intake for adolescents and adults (150 µg/d) and 34 % of that for pregnant and lactating women (250 µg/d)(12). UK milk iodine concentration, however, can vary with season (e.g. milk has a higher iodine concentration in winter than in summer as a result of varying farming practice)(Reference Stevenson, Drake and Givens11,Reference Coneyworth, Coulthard and Bailey13) .
With increasing awareness of the environmental impact of food production(Reference Campbell, Beare and Bennett14) and rising concerns over the health effects and sustainability of current eating habits(Reference Springmann, Wiebe and Mason-D’Croz15), plant-based diets have become an area of growing interest. This shift to plant-based diets is accompanied by an increase in the consumption of plant-based drinks (e.g. soya, almond and rice drinks) as alternatives to cows’ milk(Reference Chambers16). According to Mintel market research, 23 % of UK adults used plant-based milk-alternative drinks in 2019(17) compared with 19 % in 2018(18) and 14 % in 2017(19). The most recent Mintel data also show that plant-based milk-alternative drinks were used mainly by women (26 % v. 19 % of men) and younger age groups (32 % in those under 35 years v. 18 % in those of 35 years or above)(17). People tend to substitute cows’ milk with milk-alternative drinks for various reasons, including environmental, health and ethical concerns(Reference Chambers16).
Milk-alternative drinks, however, unless fortified, have a lower iodine content than cows’ milk (median 7 v. 438 µg/kg, respectively)(Reference Bath, Hill and Infante20). Data from 2015 indicated that the vast majority of milk-alternative drinks available in the UK were not fortified with iodine(Reference Bath, Hill and Infante20), which is of concern because the consumers of unfortified milk-alternative drinks might be at risk of iodine deficiency unless another source of iodine is consumed. This is particularly worrying for women of childbearing age, since it is becoming increasingly clear that the pre-conceptional period may be an important window of opportunity to optimise iodine stores prior to pregnancy and young women are more likely to consume these milk-alternative drinks.
Given the fact that cows’ milk is the principal source of iodine in the UK diet, the aim of this study was to investigate the iodine intake and status of consumers of unfortified milk-alternative drinks in the UK. We hypothesised that those who consumed milk-alternative drinks exclusively would have lower iodine intake and status than those who consumed only cows’ milk.
Methods
Study population
We used data from the UK NDNS Rolling Programme (RP) database from years 7 to 9 (i.e. in the period between 2014/2015 and 2016/2017). The NDNS methodology has been described in detail elsewhere(6,21) . Briefly, the NDNS is a continuous, cross-sectional survey of the UK population that is designed to recruit annually a nationally representative sample of individuals aged 1·5 years and above, and it collects information on UK dietary habits, nutrient intakes and nutritional status(6,21) . The NDNS was conducted according to the guidelines laid down in the Declaration of Helsinki, and all procedures were approved by the Cambridge South NRES Committee (reference no. 13/EE/0016). Written informed consent was obtained from all NDNS participants or from the parent/legal guardian in the case of children under 16 years.
Dietary assessment in the National Diet and Nutrition Survey
Diet of the participants in the NDNS RP was assessed using 4-d food diaries. Participants were asked to record all foods and drinks consumed at home and outside the home for four consecutive days with a randomly assigned start day. The portion sizes were reported using standard household measures or weights from food labels. The diaries were self-completed by adults and children above 12 years, while the diaries of children aged 12 years and under were completed by a parent or carer, with assistance from the child. To ensure the completeness and accuracy of the reported dietary data, the diaries were reviewed in the presence of the participants by a trained interviewer. Participants also completed a computer-assisted personal interview about their eating habits and food avoidance (e.g. whether following vegetarian or vegan diets). The food diaries were coded and analysed by researchers at the Medical Research Council Elsie Widdowson Laboratory.
Iodine intake
Nutrient intakes, including iodine, were available in the NDNS database and had been calculated from the food diaries using the UK Nutrient Databank which is based on the food tables from ‘McCance and Widdowson’s Composition of Foods’, the Food Standards Agency’s food portion sizes and data from manufacturers. In the current study, we used data on the average daily iodine intake from food only (µg/d) (i.e. excluding iodine-containing supplements) as our primary outcome but we also examined the total iodine intake (µg/d) (i.e. from food and iodine-containing supplements).
Iodine status
Iodine status was available in the NDNS database from the urinary iodine concentration (UIC, µg/l) measured in spot-urine samples. From 2012, as part of the NDNS RP, spot-urine samples were collected from participants aged 4 years and above for the purpose of assessing population iodine status. Detailed description of the methods for urinary iodine analysis is available in the NDNS documentation (NDNS Appendix N)(6,21) . Briefly, UIC was measured at Medical Research Council Elsie Widdowson Laboratory using an inductively coupled plasma mass spectrometer. The CV against quality control samples was ≤5 % for each of the NDNS years included in the current analyses (i.e. years 7–9), indicating acceptable accuracy and precision.
Estimation of milk-alternative and cows’ milk consumption
The intakes of milk-alternative drinks and cows’ milk were calculated from the food diaries of the fully productive individuals in the NDNS (i.e. those who completed three or four food diary days) as the average weight consumed daily (g/d). For this analysis, the cows’ milk food group included whole milk, semi-skimmed milk, skimmed milk and 1 % fat milk food groups. In the NDNS data, the consumption of milk-alternative drinks was not recorded as a separate food group but under the food subgroup ‘other milk’ (as part of the main food group ‘other milk and cream’). As the food subgroup ‘other milk’ also included other types of milk that were not plant-based milk-alternative drinks (e.g. goats’ milk, lactose-free milk, evaporated milk, condensed milk, dried milk powder, coffee creamer, milk shakes and others), we further disaggregated this food subgroup to create a separate variable for the consumption of milk-alternative drinks only. This new food group included all types of plant-based milk-alternative drinks that were consumed (e.g. almond, soya, oat, rice, coconut and hemp drinks). We then calculated the total amount of milk alternatives consumed by each individual over the 3 or 4 d of dietary assessment (g) and also the mean daily amount consumed (g/d). These calculations were also done for each type of milk-alternative drink (e.g. soya, almond, rice, coconut drink, etc.). Individuals were categorised as consumers of milk-alternative drinks (i.e. those who consumed a milk-alternative drink in at least one instance during the 3 or 4 d of dietary assessment (average intake > 0 g/d)) and non-consumers (i.e. those who did not consume any milk-alternative drinks during any of the 3 or 4 d of dietary assessment (average intake 0 g/d)). The same categorisation was used to define consumers and non-consumers of the different types of milk-alternative drinks and cows’ milk. We further grouped individuals based on how they used milk-alternative drinks and cows’ milk in their diet in three categories: (i) those who consumed cows’ milk exclusively (reference group); (ii) those who consumed milk-alternative drinks exclusively (exclusive consumers) and (iii) those who consumed milk alternatives, as well as cows’ milk (mixed consumers).
Statistical analyses
We investigated the proportion of consumers of milk-alternative drinks and cows’ milk by NDNS year (i.e. years 7–9 of RP (2014/2015, 2015/2016 and 2016/2017)), sex, age group and diet type (vegetarian, vegan or neither) using χ 2 tests. In the milk-alternative consumer group, we examined the total average daily intake of milk-alternative drinks (g/d) and the differences by sex, age group, diet type and their use in the diet (e.g. used exclusively or used alongside cows’ milk) using Mann–Whitney U tests (for two groups) or Kruskal–Wallis tests (for more than two groups).
The distributions of both the estimated daily iodine intake from food (µg/d) and spot UIC (µg/l) were skewed positively; we therefore reported the medians and 25–75th percentiles and used non-parametric tests throughout. We examined the differences in daily iodine intake and UIC by survey year, sex, age group and diet type using Mann–Whitney U tests or Kruskal–Wallis tests. We also investigated the differences in daily iodine intake and UIC between those who consumed milk-alternative drinks exclusively (exclusive consumers) and those who consumed only cows’ milk using Mann–Whitney U tests. In addition, we repeated these analyses in the women of childbearing age (16–49 years) only. We performed sensitivity analyses that excluded children of 1·5–10 years, as they are high milk consumers. Outliers for iodine intake and UIC were identified using box plots, and their influence on the analyses was investigated by excluding these values in sensitivity analyses.
We performed multiple linear regression models to examine the association of the type of milk consumed exclusively (milk-alternative drinks v. cows’ milk (reference group)) with iodine intake and UIC, using (natural) log-transformed iodine intake and UIC (as the dependent variables) and adjusting for total energy intake (kcal/d), age and sex.
In addition to iodine intake from food only, we also examined the total iodine intake (i.e. from food and supplements); this variable was also positively skewed; hence, we reported the medians and 25–75th percentiles and used non-parametric tests. We investigated whether milk-alternative consumers were more likely to use iodine-containing supplements than non-consumers using a χ 2 test. As with the iodine intake from food, we examined the difference in the total iodine intake (i.e. from food and supplements) between exclusive milk-alternative consumers and cows’ milk consumers using a Mann–Whitney U test.
The NDNS data (15th edition) were obtained from the UK Data Service (www.ukdataservice.ac.uk)(22). All statistical analyses were performed using SPSS Statistics version 25.0 (IBM Corp.).
Results
The current study included a total of 3976 individuals – 1353 from year 7 (2014/2015), 1370 from year 8 (2015/2016) and 1253 from year 9 (2016/2017) of the NDNS RP. In the total sample, milk-alternative drinks were consumed by 4·6 % (n 185) of individuals of whom 2·2 % (n 88) consumed those drinks exclusively (i.e. exclusive consumers), while 2·4 % (n 97) also consumed cows’ milk (i.e. mixed consumers). Soya drink (2·5 %, n 99) and almond drink (1·4 %, n 56) were the most frequently reported milk-alternative drinks consumed (Table 1). There was a non-significant increase in the proportion of milk-alternative consumers from 3·9 % in 2014/2015 to 5·0 and 5·1 % in 2015/2016 and 2016/17, respectively (P = 0·28) (Table 1). Females were more likely to consume these drinks than males (5·4 v. 3·8 %; P = 0·01). There was also a difference by age group (P < 0·001), with the highest proportion of milk-alternative consumers in the 19–64-year age group (6·4 %, n 100) (Table 1). Milk-alternative drinks were consumed by 7·6 % (n 59) of women of childbearing age (i.e. women 16–49 years; n 772). Individuals who followed vegetarian or vegan diets were more likely to consume milk-alternative drinks (17·8 and 75 %, respectively) than were omnivores (i.e. those who did not follow vegan or vegetarian diets) (4·2 %) (Table 1).
Table 1. Consumers of milk-alternative drinks and cows’ milk in the total National Diet and Nutrition Survey (NDNS) sample (years 7–9) and by survey year, sex, age group and diet type
(Numbers and percentages)

N/A, not applicable.
* P values are from χ 2 tests (after continuity correction for comparisons in 2 × 2 tables).
† The percentages and numbers for each type of milk-alternative drink do not add up to the total percentage and number of individuals who consumed any milk-alternative drink (n 185) as some individuals consumed more than one type of milk-alternative drink.
‡ P value from a Fisher’s exact test was reported due to cells with an expected count <5.
The median daily intake of milk-alternative drinks was 92 (25–75th percentiles 38–191) g/d in all consumers of milk alternatives (n 185) but was significantly higher in the group of exclusive milk-alternative consumers than in the group of mixed consumers (i.e. those who consumed milk-alternative drinks as well as cows’ milk): 130 (25–75th percentiles 69–214) g/d (n 88) v. 55 (25–75th percentiles 26–181) g/d (n 97), respectively (P < 0·001). The median daily intake of milk-alternative drinks consumed by vegans was higher (229 (25–75th percentiles 198–398) g/d (n 6)) than that of vegetarians (90 (25–75th percentiles 38–161) g/d (n 16); P = 0·04) and that of those who did not follow a plant-based diet (88 (25–75th percentiles 38–189) g/d (n 163); P = 0·02). Of all consumers of milk alternatives, there were no differences in the daily milk-alternative intake by sex (P = 0·77) or age group (P = 0·61). There was a significantly higher proportion of individuals who consumed fish in the combined milk-alternative consumer group (i.e. exclusive and mixed consumers) than in the group of non-consumers (70·8 v. 59·4 %; P = 0·003). In the combined group of milk-alternative consumers, there was no difference in fish consumption according to the way milk-alternative drinks were used in the diet – the proportion of fish consumers was 69·3 % in the group of exclusive consumers of milk-alternative drinks (only a small number (n 6) of this group were vegans) v. 72·2 % in the group of mixed consumers (i.e. those who consumed milk alternatives as well as cows’ milk) (P = 0·79) and the mean daily fish intake between these groups was similar (28 v. 21 g/d, respectively; P = 0·95).
The median estimated daily iodine intake from food (excluding iodine-containing supplements) was 124 (25–75th percentiles 86–176) µg/d in the total sample (n 3976) and 106 (25–75th percentiles 73–154) µg/d in the women of reproductive age (n 772). Iodine intake differed by sex, age group and diet type (Table 2). Those who exclusively consumed milk-alternative drinks had a lower dietary iodine intake than those who consumed only cows’ milk (median: 94 (25–75th percentiles 63–158) µg/d (n 88) v. 129 (25–75th percentiles 92–181) µg/d (n 3399), respectively; P < 0·001) (Table 3). Women of reproductive age who were exclusive consumers of milk-alternative drinks also had a lower dietary iodine intake than reproductive-age women who consumed only cows’ milk, though this difference was not statistically significant (Table 3). In sensitivity analyses that excluded the 1·5–10-year age group, the results remained largely unchanged (online Supplementary Table S1). Excluding the outliers did not change the results substantially. Adjustment for total energy intake, age and sex in multiple linear regression analyses did not change the conclusions.
Table 2. Iodine intake from food (µg/d) and urinary iodine concentration (µg/l) in the total National Diet and Nutrition Survey (NDNS) sample (years 7–9) and by survey year, sex, age group and diet type
(Median values and 25th and 75th percentiles)
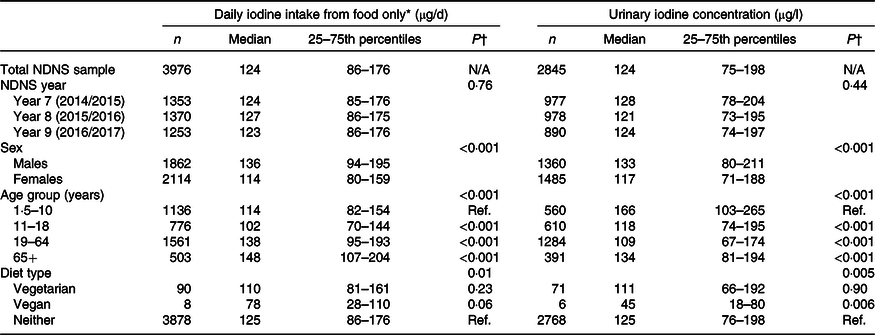
N/A, not applicable; Ref., reference group.
* Estimated daily iodine intake is from food only, excluding iodine-containing supplements.
† P values are from Mann–Whitney U tests or Kruskal–Wallis tests (with a Bonferroni correction for multiple comparisons).
Table 3. Comparison of iodine intake (µg/d) and urinary iodine concentration (UIC) (µg/l) between consumers of cows’ milk and consumers of milk-alternative drinks (exclusive consumers only)*
(Median values and 25th and 75th percentiles)
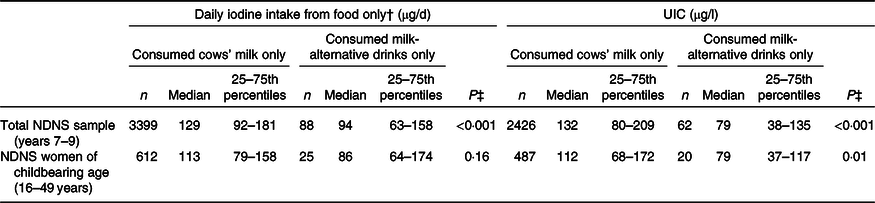
NDNS, National Diet and Nutrition Survey.
* Results shown for the total sample, and for women of childbearing age separately.
† Estimated daily iodine intake is from food only, excluding iodine-containing supplements; when including supplements, total iodine intake was still significantly lower in milk-alternative consumers (98 v. 131 µg/d; P = 0·001).
‡ P values are from Mann–Whitney U tests comparing iodine intake and UIC of the exclusive consumers of milk-alternative drinks v. cows’ milk consumers; the analyses were performed in the total NDNS sample and separately in the women of childbearing age (16–49 years).
Only 3·7 % (n 147) of the included NDNS sample used iodine-containing supplements, of whom 16 were milk-alternative consumers (n 8 were exclusive consumers). The median total iodine intake (i.e. from food and supplements) was 126 (25–75th percentiles 87–180) µg/d in the total sample (n 3976) and 108 (25–75th percentiles 74–159) µg/d in the women of childbearing age (n 772). Milk-alternative consumers were more likely to use iodine-containing supplements than non-consumers (8·6 v. 3·5 %, P = 0·001). Exclusive milk-alternative consumers had a lower total iodine intake (from food and supplements) than those who consumed only cows’ milk (median: 98 (25–75th percentiles 66–164) µg/d (n 88) v. 131 (25–75th percentiles 93–185) µg/d (n 3399), respectively; P = 0·001).
The median spot UIC was 124 (25–75th percentiles 75–198) µg/l in the total NDNS sample in this study (n 2845) and 107 (25–75th percentiles 63–161) µg/l in the women of childbearing age (16–49 years; n 611). There were differences in UIC by sex, age group and diet type. We found that females had a significantly lower median UIC than males (117 v. 133 µg/l; Table 2). Children aged 1·5–10 years had a significantly higher median UIC (166 µg/l) than adolescents (118 µg/l) and adults (109 µg/l). Those who did not follow a vegetarian/vegan diet had a higher median UIC (125 µg/l) than vegetarians (111 µg/l) and vegans (45 µg/l; Table 2), though this difference was statistically significant only for vegans.
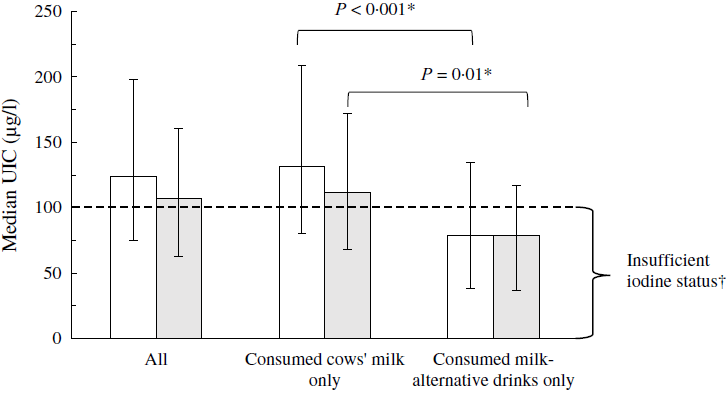
Those who consumed milk-alternative drinks exclusively (n 62) had a significantly lower UIC than cows’ milk consumers (n 2426) (median: 79 (25–75th percentiles 38–135) µg/l v. 132 (25–75th percentiles 80–209) µg/l; P < 0·001) (Table 3). When comparing with the median UIC cut-off defined by the WHO for iodine sufficiency in populations or groups (i.e. median UIC ≥ 100 µg/l)(12), only the group of cows’ milk consumers was iodine sufficient (Fig. 1). The results for UIC were similar in the subsample that included only the women of childbearing age (Table 3; Fig. 1), in the sensitivity analyses that excluded the children in the 1·5–10-year age group, and after excluding the outliers.

Fig. 1. Median urinary iodine concentration (UIC) (µg/l) in the total National Diet and Nutrition Survey (NDNS) sample (![]() ) (years 7–9) and in the NDNS women of childbearing age (16–49 years,
) (years 7–9) and in the NDNS women of childbearing age (16–49 years, ![]() ) according to the type of milk consumed exclusively. Data are presented as medians and 25–75th percentiles for all individuals and separately for those who consumed cows’ milk exclusively and those who consumed milk-alternative drinks exclusively. * P values are from Mann–Whitney U tests comparing UIC of the exclusive consumers of milk-alternative drinks with that of cows’ milk consumers performed in the total included NDNS (years 7–9) sample (
) according to the type of milk consumed exclusively. Data are presented as medians and 25–75th percentiles for all individuals and separately for those who consumed cows’ milk exclusively and those who consumed milk-alternative drinks exclusively. * P values are from Mann–Whitney U tests comparing UIC of the exclusive consumers of milk-alternative drinks with that of cows’ milk consumers performed in the total included NDNS (years 7–9) sample (![]() ) and separately in the NDNS (years 7–9) women of childbearing age (16–49 years) (
) and separately in the NDNS (years 7–9) women of childbearing age (16–49 years) (![]() ). † Based on the WHO median UIC cut-off for iodine sufficiency in populations or groups of school-age children and/or adults (median UIC ≥ 100 µg/l).
). † Based on the WHO median UIC cut-off for iodine sufficiency in populations or groups of school-age children and/or adults (median UIC ≥ 100 µg/l).
The findings and overall conclusions remained unchanged after controlling for total energy intake, age and sex in multiple linear regression analyses.
Discussion
In the current study, we found that those who consumed milk-alternative drinks exclusively had a lower iodine intake than those who consumed only cows’ milk. Furthermore, the median UIC of the exclusive consumers of milk-alternative drinks indicated that this group was classified as iodine deficient by WHO criteria(12), whereas cows’ milk consumers were iodine sufficient.
To our knowledge, this is the first study to report on the iodine intake and status of the consumers of milk-alternative drinks in the UK. Previous studies have investigated the iodine intake and/or status of vegetarians and/or vegans in the UK(Reference Lightowler and Davies23–Reference Bath, Sleeth and McKenna25) and in other countries(Reference Leung, LaMar and He26–Reference Elorinne, Alfthan and Erlund32) and have mostly shown that vegans are at particular risk of iodine deficiency. Although studying these groups provides an insight into how plant-based diets can influence iodine intake and status, it does not necessarily reflect the impact of substituting cows’ milk with milk-alternative drinks. For example, vegetarian diets may include some milk-alternative drinks but usually also include milk and dairy products; vegan diets exclude milk and dairy products and are more likely to include plant-based substitutions, but additionally, vegans do not consume other good sources of iodine, such as fish.
Our results show that milk-alternative drinks were typically consumed by women, particularly women of childbearing age. Although the median UIC in the group of women of childbearing age was above the WHO criterion for iodine sufficiency in the general population (i.e. median UIC ≥ 100 µg/l)(12), this value is lower than the median UIC in the total NDNS sample (107 v. 124 µg/l) and it is well below the WHO criterion for sufficient iodine intake in pregnancy (i.e. median UIC ≥ 150 µg/l)(12). Moreover, as was the case for the total sample, we found that women of childbearing age who consumed milk alternatives exclusively had a significantly lower iodine status (measured by spot UIC) than those who consumed only cows’ milk. These findings are of public health significance as only those women who consumed cows’ milk were iodine sufficient by the WHO criteria. Furthermore, women of childbearing age who were exclusive consumers of milk-alternative drinks had an estimated iodine intake from food (86 µg/d) that was below the estimated average requirement set by the United States Institute of Medicine (95 µg/d)(33) and considerably below the UK Reference Nutrient Intake (140 µg/d)(34); this is of concern because it is important to have sufficient iodine intake prior to pregnancy to ensure optimal thyroidal iodine stores that can be drawn upon to support the higher demand for iodine during gestation(Reference Glinoer35).
Although our results indicate that consumers of milk-alternative drinks might be at risk of iodine deficiency, it is important to note that the influence of consumption of milk-alternative drinks on iodine intake and status will depend on how these drinks are used in the diet (e.g. used exclusively or used alongside cows’ milk) and the composition of the overall diet (i.e. intake of other iodine-rich food sources, such as fish). Though in the current analyses, we found that some 70 % of the consumers of milk-alternative drinks consumed fish, that did not make up for the missing iodine from cows’ milk; hence, their estimated iodine intake and median UIC were lower than those of cows’ milk consumers. We also found that although milk-alternative consumers were more likely to use iodine-containing supplements than non-consumers, only a small proportion (<10 %) took such a supplement and exclusive milk-alternative consumers still had a lower total iodine intake (from food and supplements) than cows’ milk consumers.
The differences between the exclusive consumers of milk-alternative drinks and cows’ milk were more apparent with spot UIC than with the estimated iodine intake from the food diary. This could be because iodine intake from fish, which is usually consumed less frequently, might not be reflected in a casual spot-urine sample which reflects iodine intake only in the last 24–48 h(Reference Zimmermann36). By contrast, milk is usually consumed daily, and therefore, the observed difference in spot UIC between the two study groups (i.e. consumers of milk-alternative drinks v. consumers of cows’ milk) is more likely to reflect the difference in the type of milk consumed.
The overall proportion of milk-alternative consumers in the NDNS was low (4·6 %), but we observed a small increase over the years of the survey (2014–2017). As indicated by more recent Mintel market research data (2017–2019)(17–19), milk-alternative drinks are indeed becoming more popular, with the proportion of UK adults who consume these drinks increasing from 14 % in 2017 to 23 % in 2019. Consumption of plant-based milk-alternative drinks will probably continue to increase as people become more concerned about the environmental sustainability of their diets (e.g. greenhouse-gas emissions, land use and water use from dairy production v. plant-based alternatives)(Reference Poore and Nemecek37). The revised UK Eatwell Guide also aims to address sustainability and now includes milk alternatives in the milk and dairy food group(38). Furthermore, the British Dietetic Association has recently launched the One Blue Dot toolkit which is a guide to an environmentally sustainable diet; one of the sustainable diet recommendations is moderate dairy consumption and use of fortified plant-based alternatives where necessary(39). Although these guides recommend that plant-based milk alternatives should be fortified, they focus mostly on the comparability to cows’ milk in terms of Ca content and do not focus on iodine.
As previously noted(Reference Bath, Hill and Infante20), most milk-alternative drinks on the market are fortified with Ca, vitamin D and vitamin B12 to match the content in cows’ milk but it is rare to match for iodine. Considering our findings, it is important for manufacturers to fortify their plant-based milk-alternative drinks with iodine, so that the iodine content is comparable with that of cows’ milk. It is also essential that the products are fortified appropriately, for example, by the use of potassium iodide, instead of seaweed species (e.g. the brown seaweed, kelp/kombu) because the iodine concentration of the latter is highly variable and can provide excessive amounts(Reference Crawford, Cowell and Emder40,Reference Bouga and Combet41) . Soya and almond drinks were the most frequently reported milk-alternative types in the NDNS, suggesting that more fortified options of these milk alternatives might be needed. The NDNS data we report, however, only go up to 2017, and the situation regarding the consumption of these drinks overall and their popularity by type is constantly changing.
Since there is no iodine-fortification policy in the UK, iodine intake is mainly dependent on individual food choice. Individuals who substitute cows’ milk exclusively by plant-based milk-alternative drinks need to increase their iodine intake from other food sources of iodine (e.g. fish and eggs). This may not be possible for some individuals (e.g. vegans), in which case, iodine-fortified milk-alternatives (if available) or an iodine-containing supplement (not kelp or seaweed) should be considered. Since the publication of our results on the low iodine content of milk-alternative drinks in the UK(Reference Bath, Hill and Infante20), some brands have either started to fortify their plant-based milk-alternative drinks with iodine or have increased the iodine content (e.g. Alpro Soya Original and Oatly drinks are now fortified at 22·5 µg/100 ml; Marks & Spencer plant drinks are now fortified at 30 µg/100 ml), but most milk-alternative drinks available on the market are currently not fortified. Consumers should therefore check the labels of such products as the brands fortifying with iodine may well change over time.
Our study has several limitations that should be considered when interpreting the findings. We categorised individuals into consumers and non-consumers of milk-alternative drinks and cows’ milk based on their reported intakes of these foods in the food diary; misclassification might have occurred as a result of misreporting(Reference Garden, Clark and Whybrow42). Additionally, the food diaries capture only short-term food and nutrient intakes(Reference Shim, Oh and Kim43) (in this case, over 3 or 4 d), and this may not fully reflect the day-to-day variability in dietary iodine intake (e.g. an individual day-to-day variation in 24-h urinary iodine excretion of 33 % is suggested as representative for Western populations with varied diets(Reference König, Andersson and Hotz44)). We used UIC measured in a single spot-urine sample to assess iodine status. Although this measure is misleading when used to estimate iodine status for individuals as a result of variation in hydration status and day-to-day differences in iodine intake(Reference König, Andersson and Hotz44–Reference Vejbjerg, Knudsen and Perrild46), we used this measure at a group level where these differences usually even out(Reference Zimmermann and Andersson47). In the NDNS, the urine samples for the measurement of UIC were not necessarily collected during the 4-d dietary assessment. UIC reflects iodine intake in the last 24–48 h(Reference Zimmermann and Andersson47), whereas the diary data relate to milk alternative and cows’ milk consumption during the dietary assessment. This possible mismatch in the timing of the exposure (i.e. milk-alternative/cows’ milk consumption) and one of the outcomes (i.e. UIC) might have influenced our results; however, this would probably have reduced the observed differences in UIC between the study groups (i.e. milk-alternative consumers v. cows’ milk consumers). Additionally, we cannot completely exclude the possibility that some of the milk alternatives consumed by individuals in the current study were fortified with iodine; however, previous data from 2015 (i.e. during the period when the NDNS data used in this study were collected (2014–2017)) showed that across twenty retail brands, only one brand, not the market leader, was fortifying its products with iodine(Reference Bath, Hill and Infante20). Furthermore, had this been the case, the observed differences in iodine status between milk-alternative consumers and cows’ milk consumers would have been less apparent. Finally, because of the cross-sectional design of the NDNS, the observed association between the type of milk consumed (milk-alternative drinks or cows’ milk) and iodine intake and status cannot infer causality.
In conclusion, the NDNS data, collected prior to the fortification by manufacturers of their milk-alternative drinks with iodine, show that consumers of unfortified milk alternatives are at risk of iodine deficiency. With the continuing rise in consumption of milk-alternative drinks, it is important for manufacturers to fortify their products appropriately with iodine (e.g. potassium iodide or iodate) to provide a similar iodine content to that of cows’ milk and thus reduce the risk of iodine deficiency in milk-alternative consumers. Furthermore, individuals who completely substitute cows’ milk by milk-alternative drinks should ensure that they are buying iodine-fortified versions or should increase their iodine intake from other food sources or iodine supplements.
Acknowledgements
The authors are grateful to the participants of the NDNS.
This work was supported by the Faculty of Health and Medical Sciences at the University of Surrey, UK. The funder had no role in the design, analysis or writing of this article.
S. C. B. and M. P. R. devised the study. M. D. performed the statistical analyses. M. D., S. C. B. and M. P. R. interpreted the results. M. D. wrote the first draft of the manuscript. S. C. B. and M. P. R. contributed to the manuscript. All authors read and approved the final version.
S. C. B. has received an honorarium from Oatly UK and Dairy UK for delivering webinars/online videos for Healthcare Professionals.
Supplementary material
For supplementary material referred to in this article, please visit https://doi.org/10.1017/S0007114520003876


 Open access