


The high incidence and prevalence of type 2 diabetes mellitus (T2DM) are well recognised(1). Ideally, management should include an appropriate diet. The composition of the diet will vary with individual conditions and preferences, but there is often an emphasis on appropriate portion sizes, consuming non-starchy vegetables, minimising added sugars and refined grains and choosing whole foods over highly processed foods as much as possible to improve body weight and glycaemic control(Reference Evert, Dennison and Gardner2). Additionally, replacing saturated fat and foods higher in carbohydrates with unsaturated fats and reducing sodium may help manage diabetes complications, such as elevated blood cholesterol concentrations and blood pressure(Reference Evert, Dennison and Gardner2). Accumulating evidences suggests almond consumption decreases post-prandial glycaemia(Reference Cohen and Johnston3) and may evoke a second meal effect(Reference Mori, Considine and Mattes4), especially when they are consumed at breakfast or as an afternoon snack(Reference Mori, Considine and Mattes4,Reference Tan and Mattes5) , which may aid in long-term glycaemic control. Additionally, almond consumption can decrease total and LDL-cholesterol(Reference Foster, Shantz and Vander Veur6–Reference Lovejoy, Most and Lefevre9), resulting in lower peripheral insulin resistance and cardiometabolic complications from T2DM. However, there is mixed evidence on the effects of almond consumption on HbA1c(Reference Cohen and Johnston3,Reference Chen, Liu and Li10,Reference Wien, Bleich and Raghuwanshi11) , a clinically important endpoint that provides a reliable measure of long-term glycaemia and is correlated with risk of complications from diabetes(Reference Sherwani, Khan and Ekhzaimy12–Reference Sacks14).
Different body fat distributions (BFD) are associated with variable risks for glucose intolerance and development of T2DM. A large android visceral adipose tissue (VAT) depot is consistently positively associated with insulin resistance and T2DM(Reference Wulan, Westerterp and Plasqui15–Reference Liu, Feng and Zhang17). Whether large amounts of android subcutaneous adipose tissue (SAT) are associated with T2DM is disputed(Reference Després, Lemieux and Bergeron18–Reference Porter, Massaro and Hoffmann23). A large gluteal femoral fat depot is not considered to be problematic and is consistently associated with insulin sensitivity(Reference Canoy24–Reference Snijder, Visser and Dekker26). Previous studies measuring the effect of almond consumption on HbA1c did not account for BFD in their analyses and this may be a factor that influences the physiological response to almond consumption. The purpose of this study was to determine whether BFD plays a role in the physiological response to almond consumption and the mixed evidence of almond consumption on HbA1c.
Materials and methods
Study population
Participants were recruited from the greater Lafayette and Indianapolis, IN areas from August 2017 to October 2019. Eligibility criteria included healthy men and women with a BMI ≥ 27 kg/m2, falling within BFD criteria, 18–60 years old, weight stable (±5 kg) for 6 months prior to the start of the study, non-smokers, not taking medication for diabetes, not allergic to tree nuts or peanuts, and regular breakfast and low nutrient density afternoon snack (weighted nutrient density score <8(Reference Arsenault, Fulgoni and Hersey27)) consumers. Whether participants regularly consumed nuts or not was not assessed at screening. Participants were randomised to the almond or control group within their BFD cohort using a random number sequence (generated by S. R. H. at random.org, which was not concealed to S. R. H. or R. V. C., who enrolled and assigned participants to interventions). Due to the nature of the intervention, groups were not blinded.
This study was conducted according to the guidelines laid down in the Declaration of Helsinki and all procedures involving human subjects/patients were approved by the Purdue University and Indiana University School of Medicine Institutional Review Boards. Written informed consent was obtained from all participants. This study is registered in clinicaltrials.gov (NCT03236116).
General protocol
This was a 6-month randomised, controlled, parallel arm clinical trial. After the baseline appointment, participants were randomly assigned to the almond or control group based on their BFD. Those in the almond group were provided 0·75 oz packets of roasted, unsalted almonds to consume twice a day: once with their habitual breakfast and once as their afternoon snack. The total amount of almonds consumed per day was 1·5 oz, based on the FDA’s qualified health claim for nuts and coronary heart disease(28), which provided 1130 kJ. Those in the control group continued their habitual breakfast and afternoon snack routines. Participants were instructed not to consume any other nuts or nut products throughout the study. Body weight was measured approximately every 2 weeks. At this time, subjects in the almond group were provided a 2-week supply of almonds and were reminded to consume them with their breakfast and as their afternoon snack, and not to consume any other nuts or nut products. Those in the control group were reminded to continue their habitual breakfast and afternoon snacking routines, and not to consume any nuts or nut products. Blood samples for fasting and meal-stimulated glucose and insulin, and fasting HbA1c, triacylglycerides (TAG), total cholesterol, HDL-cholesterol and LDL-cholesterol concentration measurement, HOMA-IR and HOMA-%B calculations (measures of insulin resistance and beta cell function) were collected at months 0 and 6. Body composition was measured at months 0 and 6, while dietary recalls and appetite measurements were recorded at months 0, 2, 4 and 6.
Study outcomes
The primary outcomes for this study were the acute effects of almond consumption on the glycaemic response to a meal tolerance test, and the chronic effects of almond consumption on fasting glucose, insulin, HbA1c, TAG, total cholesterol, LDL-cholesterol, HDL-cholesterol, appetite, body weight, body composition, calculated HOMA-IR and HOMA%β in adults with different BFD associated with different risks of insulin resistance and onset of diabetes. A secondary outcome was the effect of substituting almonds for a more traditional, less nutrient dense snack food, on total diet quality. We hypothesised that almond consumption would elicit a significant moderation of glycaemia in response to a meal tolerance test, fasting glucose, insulin, HbA1c, TAG, total cholesterol, LDL-cholesterol, HDL-cholesterol, and calculated HOMA-IR and HOMA-%β in individuals with high VAT, an intermediate effect on outcomes in individuals with a high SAT and no effect on outcomes in individuals with a high gluteal femoral adiposity compared to control groups with similar BFD. We also hypothesised that substitution of almonds for other common snacks would not promote weight gain, and that almond consumption would improve total diet quality compared with the control groups.
Assessment of body fat distribution
BFD cohorts were determined by waist circumference to hip circumference (WH) ratio at the baseline appointment. WH was measured using a flexible tape measure. Waist circumference was measured around the smallest portion of the waist, and hip circumference was measured around the widest portion of the buttocks(29). Men and women who had a WH of <0·85 and <0·8, respectively, were grouped as having high gluteal–femoral adiposity(Reference Liebau, Jensen and Nair30). Men and women who had a WH greater than 0·85 and 0·8, respectively, were grouped as having high android adipose tissue. Once eighty participants with high android adipose tissue completed the intervention, the VAT ratio (VAT mass (g)/android fat (g)), determined by dual-energy X-ray absorptiometry, was used to divide the group into subgroups having high android VAT (high VAT) and high android subcutaneous adipose tissue (high SAT). Those above the 50th percentile of the VAT ratio were grouped as having high VAT, and those in the lower 50th percentile of the VAT ratio were grouped as having high SAT for analysis. The rationale for this classification was based on a study by Kursawe et al. (Reference Kursawe, Eszlinger and Narayan31).
Anthropometrics
Height was measured once at the baseline appointment using a portable stadiometer (Purdue University: Seca; Model 213 1821009; Indiana University School of Medicine: Quick Medical Wall Mounted Stadiometer). Body weight was measured and BMI was calculated using a body composition analyser (Purdue University: Tanita; Model TBF-410; Indiana University School of Medicine: Scale-Tronix) with participants wearing minimal, lightweight clothing. Body composition (total and regional) was assessed using dual-energy X-ray absorptiometry in a Lunar DPX-IQ 240 densitometer (Version Encore GE 15, GE Healthcare). CoreScan software was used to determine android visceral and subcutaneous adipose tissue.
Biochemical assays
Participants arrived at the laboratory after an overnight fast of at least 10 h. An indwelling catheter was placed and fasting blood samples were collected 10 min after catheter placement. Next, the participant consumed an 8-oz chocolate nutrition shake (Ensure Original, Milk Chocolate, Abbot Laboratories) within 10 min. Eight millilitre of blood was drawn at 10, 20, 30, 60, 120 and 180 min after completing consumption of the shake.
Fasting blood samples for HbA1c analyses were collected in an EDTA Vacutainer (Becton, Dickinson and Co.). Whole blood was aliquoted and stored at −80°C until further analysis. Blood samples for a fasting lipid panel (TAG, total cholesterol, HDL-cholesterol, calculated LDL-cholesterol) and fasting and meal-stimulated glucose and insulin concentrations were collected in a Serum Vacutainer (Becton, Dickinson and Co.). The blood samples were allowed to sit for at least 30 min to clot and were then centrifuged (4000 RPM for 8 min). Serum was removed and divided into aliquots that were stored at −80°C until further analysis. HbA1c, glucose, TAG, total cholesterol and HDL-cholesterol were determined on a Roche COBAS Integra 400 Plus analyser. Insulin was determined on a Roche Cobas e411 analyser. LDL-cholesterol was estimated using the Friedewald formula (LDL (mg/dl) = (total cholesterol – HDL-cholesterol – TAG)/5). HOMA-IR and HOMA-%β were calculated using the formula (glucose (mg/dl) × insulin (uU/ml)/405) and ((360 × insulin (uU/ml)/(glucose (mg/dl) − 63)), respectively.
Dietary recalls
Dietary intake was assessed using the web-based ‘Automated Self-Administered 24-hour Dietary Recall’ (ASA24-2016) system (National Cancer Institute). Participants were asked to record dietary intake for three non-consecutive days that included two weekdays and one weekend day for better representation of habitual intake. The Goldberg formula was used to determine if reported energy intake was physiologically plausible(Reference Black32). Dietary intake data from ASA24 were used to calculate Healthy Eating Index 2015 (HEI-2015) scores using a SAS code provided by the National Cancer Institute(33) in a sub-sample of participants due to a collection error where some individuals initiated almond ingestion prior to completion of baseline dietary assessment (n 39 and 32 for the intention-to-treat (ITT) and complier analyses, respectively). HEI-2015 is a measurement of diet quality used to assess how well a set of foods aligns with recommendations of the 2015 Dietary Guidelines for Americans, where a score of 100 indicates the diet aligns with the recommended dietary guidelines.
Appetite sensations
Appetitive sensation ratings were collected during all waking hours during a 24-h period using an online Qualtrics questionnaire that poses questions related to hunger, fullness, desire to eat and prospective consumption on a 100-point visual analog scales (VAS) anchored at 0 with ‘not at all’ to ‘extremely’ anchored at 100. Participants were instructed to complete appetite logs on their computer, smartphone or electronic device using a Qualtrics link provided on the hour, every hour. The mean 24-h appetite ratings were used for analyses. Logs with less than six entries were considered missing data and imputed with group means.
Compliance
Participants in the almond group were considered compliant if they reported consumption of almonds at least once, at any time during the day and did not report ingestion of any other nuts or nut products. Participants in the control group were considered compliant if they reported consumption of breakfast and/or an afternoon snack, and no nuts or nut products. The number of compliant days was divided by number of recalls (12). Participants were considered compliant if the ratio was ≥ 0·57. The ratio of 0·57 was chosen as a comparison of compliance 4 out of 7 days a week (4/7 = 0·57).
Statistical analysis
Baseline data were assessed using a linear mixed model in SPSS (version 24) to determine the effects of treatment, BFD and treatment × BFD. Baseline categorical outcomes were assessed using χ 2 tests. The α level was set at 0·05 for all analyses. Data are reported as means and standard errors unless otherwise stated.
An ITT analysis was conducted on all participants who provided baseline data (n 134), with the overall mean for each dependent variable imputed for missing values. Another analysis was performed on participants who complied with the intervention (n 101). Only participants with HbA1c data at month 0 were included in the analysis (n 120 in ITT analysis, n 101 in complier analysis). A linear mixed model was used to determine time, treatment, BFD, treatment × time and treatment × BFD × time interaction effects with age as a covariate on blood indices (fasting glucose, insulin, lipids, HOMA-IR, HOMA-%β, and meal-stimulated glucose and insulin iAUC) between 0 and 6 months, and on total HEI score, energy intake and 24-h appetitive sensations between months 0, 2, 4 and 6 using proc mixed in SAS (version 9.4). Treatment, BFD and time were treated as fixed effects, and participants were treated as random effects repeated over time using a repeated covariance matrix. iAUC was calculated using the trapezoidal method, with any values below baseline omitted. Additional linear mixed models were used to determine the effects of treatment and treatment × BFD on change values of body weight and body composition variables in SPSS (version 24). In each analysis, when main or interaction effects were significant, pairwise comparisons were conducted with the Bonferroni correction.
When data were not normally distributed, extreme outliers (>3 times the interquartile range) were removed or data were transformed. One extreme outlier in the almond, high VAT group was removed from the HbA1c ITT analysis. Fasting and meal-stimulated glucose data were log transformed, and fasting insulin, meal-stimulated insulin and HOMA-IR data were square root transformed in the ITT analysis. Meal-stimulated glucose data were log transformed, and fasting insulin and HOMA-IR data were square root transformed in the complier analysis.
The sample size calculation for this study was based on a power analyses that indicated a sample of forty participants per BFD cohort (120 participants total) would be sufficient to detect treatment effects equal to 0·4 standard deviations of the mean with 80 % power. The α level was set at 0·05 for all analyses. Hedges g was used to calculate effect size and 95 % CI when P-values were significant. Data are reported as means and standard errors unless otherwise stated.
Results
Participants
In total, 3656 people expressed their interest in participating and completed a screening questionnaire, of which 134 participants qualified and were enrolled in the study. Due to difficulties recruiting participants with high gluteal–femoral adiposity, only thirty-eight participants with high gluteal–femoral adiposity completed the intervention. Overall, sixteen participants withdrew during the intervention (Fig. 1). Attrition rates were 15·7 % for the almond group, and 9·2 % for the control group, which did not differ significantly. Similar numbers of participants dropped out due to lifestyle reasons from each group, but more participants in the almond group dropped out due to illness unrelated to the study, driving the higher attrition rate. There were no differences in sex, race, age, BMI, body weight, total body fat percentage or total fat mass between participants who dropped compared with those who did not; however participants in the high VAT cohort who dropped had a higher baseline lean mass than those in the high VAT cohort who did not drop (P = 0·008). Participants were primarily female and Caucasian. BMI, body weight, total body fat percentage, total fat mass and total lean mass did not differ between BFD cohorts or groups at baseline; however, there were differences in age between BFD cohorts and this was adjusted for in the analysis (Table 1).

Fig. 1. Participant flow chart. High VAT, high android visceral adipose tissue; high SAT, high android subcutaneous adipose tissue; lifestyle, dropped out due to time constraints or unwillingness to continue intervention.
Table 1. Baseline characteristics
(Mean values with their standard errors of the mean)
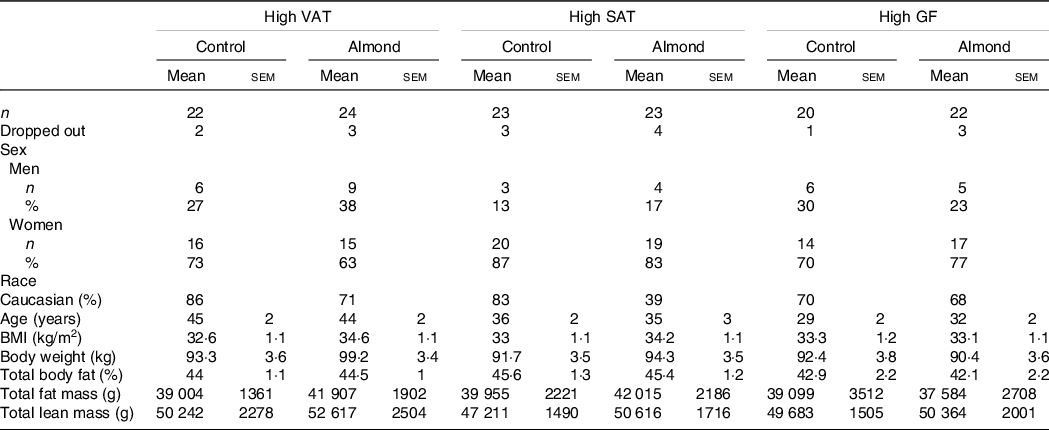
VAT, android visceral adipose tissue; SAT, android subcutaneous adipose tissue; GF, gluteal femoral adipose tissue.
Body fat distribution classification
By design, participants in the three BFD cohorts differed in the amount of android fat mass, and VAT, SAT and WH ratios (Table 2). The 50th percentile of the VAT ratio in the high android fat cohort was 0·33. Participants in the high VAT and high SAT cohorts had significantly more android fat mass compared with participants in the high gluteal–femoral adiposity cohort (P < 0·001 and 0·02, respectively). Participants in the high VAT cohort had a significantly higher VAT ratio and a significantly lower SAT ratio than participants in the high SAT (P < 0·001 for both) and high gluteal–femoral adiposity (P < 0·001 for both) cohorts, indicative of having a greater percentage of android fat mass being VAT as opposed to SAT. Participants in the high gluteal–femoral adiposity cohort had a significantly lower WH ratio compared with participants in the high VAT (P < 0·001) and high SAT cohorts (P < 0·001), indicative of having more adipose tissue in the gluteal–femoral region. There were no differences between groups within each BFD cohort (P > 0·05).
Table 2. Baseline body fat distribution classifications
(Mean values with their standard errors of the mean)
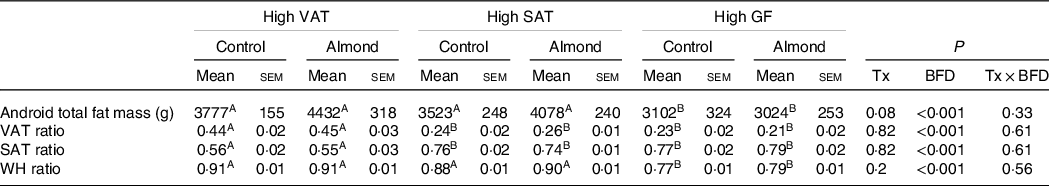
VAT, android visceral adipose tissue; SAT, android subcutaneous adipose tissue; GF, gluteal femoral adipose tissue; Tx, treatment; BFD, body fat distribution; WH, waist to hip circumference ratio.
a,b Different letters indicate significant differences between body fat distribution cohorts (P < 0·05).
Compliance
The compliance rates were higher for participants in the control group (85 %) compared with participants in the almond group (67 %) (P = 0·02). There were twenty-three non-compliers in the almond group, nine with high VAT, nine with high SAT and five with high gluteal–femoral adiposity. There were ten non-compliers in the control group, two with high VAT, six with high SAT and two with high gluteal–femoral adiposity.
Diet quality
Participants in the almond group had a significantly higher total HEI score at months 2, 4 and 6 compared with month 0 (P = 0·001). There were no differences in total HEI scores between participants in the control group at any time point (P > 0·05) in both the ITT and complier analyses (Table 3).
Table 3. Total HEI score
(Mean values with their standard errors of the mean)
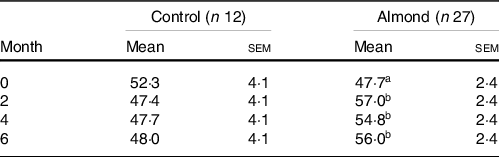
A,B Different letters indicate a difference within a group over time (P < 0·05).
Appetite
There were no significant treatment, BFD, time, treatment × BFD, treatment × time or treatment × BFD × time effects for participants ratings of hunger, fullness, desire to eat or prospective consumption in the ITT or complier analyses (Table 4).
Table 4. Energy intake and appetite ratings
(Mean values with their standard errors of the mean)
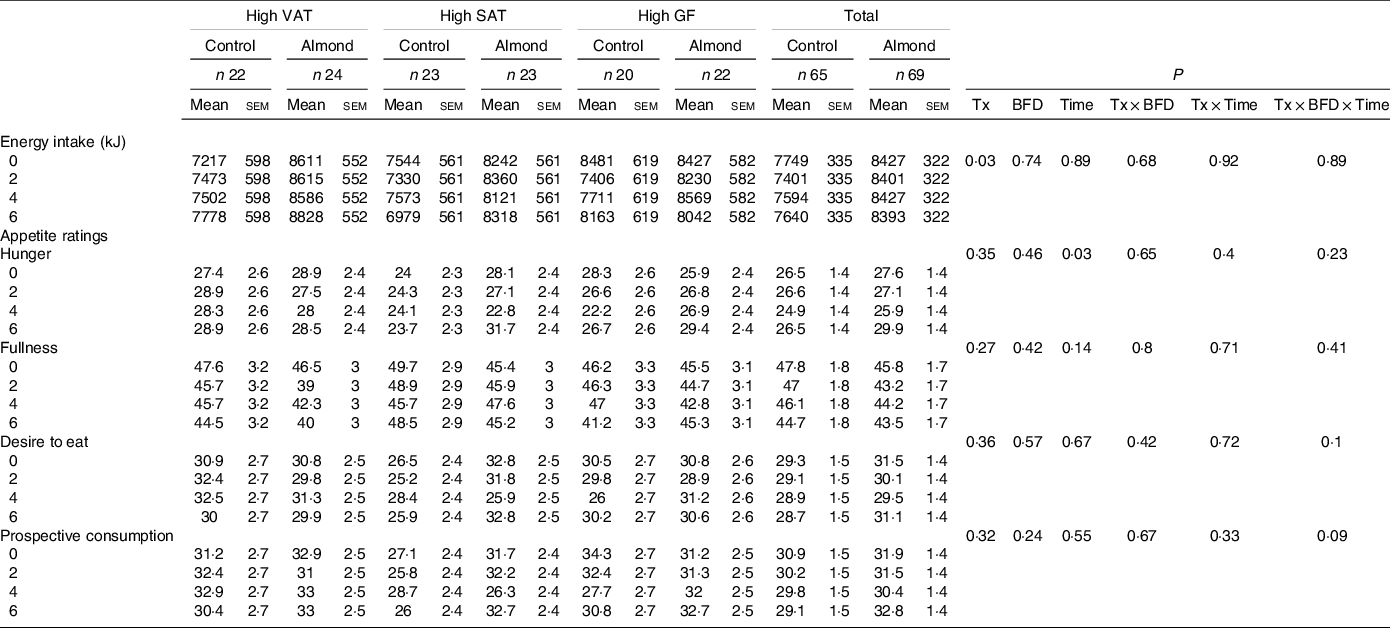
VAT, android visceral adipose tissue; SAT, android subcutaneous adipose tissue; GF, gluteal femoral adipose tissue; Tx, treatment; BFD, body fat distribution.
Energy intake
Participants in the almond group consumed 816 (sem 364) kJ/d more compared with the control group in the ITT analysis (P = 0·03; g = 0·38, 95 % CI 0·04, 0·73) (Table 4). Energy intake did not differ by BFD, time, treatment × BFD, treatment × time or treatment × BFD × time in the ITT or complier analyses (P > 0·6). Notably, only 11 and 12 % of the reported energy intakes fell within the Goldberg cutoffs in the ITT and complier analyses, respectively.
Anthropometric data
Despite higher energy intake during the intervention, there were no differences in body weight between groups in the ITT or complier analyses (P > 0·3) (Fig. 2). In the ITT analysis, there was a trend towards a significant increase in total lean mass in participants in the almond, high SAT group compared with participants in the control, high SAT group (P = 0·08; g = 0·46, 95 % CI 0·12, 1·05); however, pairwise comparison did not indicate any significant differences (P > 0·1) (Table 5). In the complier analysis, participants in the almond, high SAT group increased total lean mass compared with participants in the control, high SAT group (P = 0·05; g = 0·9, 95 % CI 0·17, 1·66). Participants in the almond, high SAT group had significantly decreased android fat mass percentage (P = 0·04; g = 0·72, 95 % CI 0·12, 1·32) and significantly increased android lean mass percentage (P = 0·04; g = 0·65, 95 % CI 0·06, 1·25) compared with participants in the control, high SAT group in the ITT analysis (Fig. 3). Further, participants in the almond, high SAT group tended to decrease android VAT mass (P = 0·08; g = 0·55, 95 % CI 0·04, 1·14) compared with participants in the control, high SAT group in the ITT analysis. There were no differences between participants in the almond and control groups with high VAT or high gluteal–femoral adiposity in the ITT or complier analyses (P > 0·05). There were no significant treatment, BFD or treatment × BFD effects on change in body weight, total fat mass, total fat mass percentage, total lean mass percentage, android mass, android fat mass, android lean mass or android SAT mass in the ITT or complier analyses (P > 0·07).
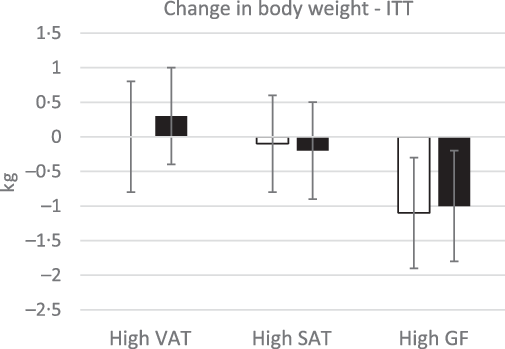
Fig. 2. Change in body weight. There were no significant differences in body weight between treatments, body fat distributions or treatment × body fat distribution (P > 0·05). Data are presented as means with their standard error of the mean. ![]() , control;
, control; ![]() , almond.
, almond.
Table 5. Change in anthropometric data
(Mean values with their standard errors of the mean)
VAT, android visceral adipose tissue; SAT, android subcutaneous adipose tissue; GF, gluteal femoral adipose tissue; Tx, treatment; BFD, body fat distribution.
* Significant difference from control, high SAT (P < 0·05).
† Trend difference from control, high SAT (P < 0·08).
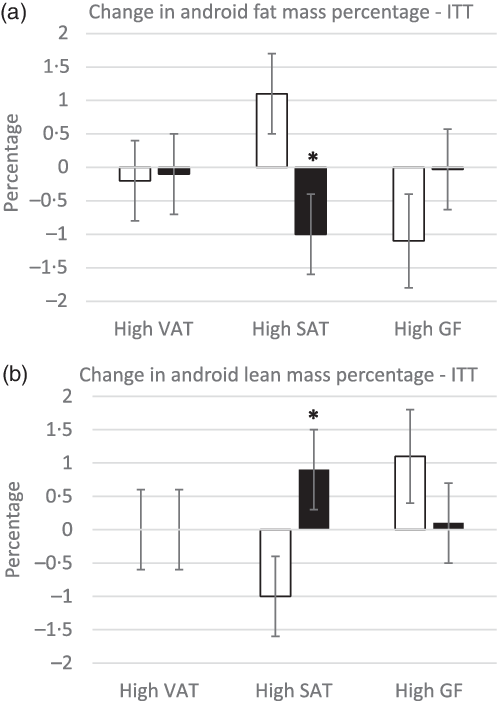
Fig. 3. Change in android fat (a) and lean (b) mass percentage. *Significant difference from control, high SAT group (P < 0·05). There were no differences between groups within the high VAT and GF cohorts (P > 0·05). Data are presented as means with their standard error of the mean. ![]() , control;
, control; ![]() , almond.
, almond.
Blood biochemistries
Fasting glucose, insulin, HbA1c and HOMA-IR, HOMA-%B
Participants with high VAT had higher fasting glucose compared to participants with high SAT (P = 0·02), and higher fasting insulin (P = 0·02) and HOMA-IR (P = 0·02) compared to participants with high gluteal–femoral adiposity (Table 6). Participants in the almond group had higher fasting insulin (P = 0·02) and tended to have higher HOMA-IR (P = 0·05) compared with participants in the control group. However, these did not differ at any time point (P > 0·1). Participants with high SAT tended to have higher HOMA-%β compared to participants with high gluteal–femoral adiposity (P = 0·05), but there were no differences between groups. Participants in the almond group had higher HOMA-%β compared with participants in the control group (P = 0·04) in the complier analysis, but this did not differ among BFD cohorts or at any time point (P > 0·1). There were no significant treatment, BFD, time, treatment × BFD, treatment × time or treatment × BFD × time effects on HbA1c in the ITT or complier analyses (P > 0·1).
Table 6. Blood biochemistry data
(Mean values with their standard errors of the mean)
VAT, android visceral adipose tissue; SAT, android subcutaneous adipose tissue; GF, gluteal femoral adipose tissue; Tx, treatment; BFD, body fat distribution.
A,BDifferent letters indicate a significant difference between BFD (P < 0·05).
† Trend significant difference from control treatment group at same time point (P = 0·08).
Meal-stimulated glucose and insulin
Participants with high VAT had a higher meal-stimulated glucose compared to participants with high SAT (P = 0·02) in the ITT analysis, but did not differ between treatments or at any time point in the ITT or complier analyses (P > 0·05) (Table 6). Participants with high VAT and high SAT had higher iAUC meal-stimulated insulin compared to participants with high gluteal–femoral adiposity (P < 0·001) in the ITT analysis, and participants with high VAT had higher meal-stimulated insulin compared to participants with high gluteal–femoral adiposity in the complier analysis (P = 0·002). Participants in the almond group had higher iAUC meal-stimulated insulin compared with participants in the control group (P = 0·02) in the ITT analysis. There were no significant treatment × time or treatment × BFD × time effects on meal-stimulated glucose or insulin (P > 0·1).
Fasting serum lipids
Participants with high VAT had higher TAG concentrations compared to participants with high SAT and high gluteal–femoral adiposity in the ITT and complier analyses (P < 0·05), but this did not differ between groups (P > 0·2) (Table 6). There was a significant treatment × time interaction effect on HDL in the ITT analysis (P = 0·04), but pairwise comparisons did not indicate any significant differences (P > 0·05). There were no significant main or interaction effects on HDL in the complier analysis (P > 0·1). There were no significant main or interaction effects on LDL, or any significant main or interaction effects on total cholesterol in the ITT or complier analyses (P > 0·09).
Discussion
The apparent inconsistency between short- and longer-term indices of glycaemia in response to almond ingestion led to the hypothesis that almond consumption would improve HbA1c in participants with high VAT, where underlying mechanisms seem to be most amenable to the properties of almonds and where risk for impaired glycaemia is highest. For individuals with high SAT, only moderate improvement of HbA1c was expected because of evidence this condition is less amenable to dietary intervention. No effect was anticipated for the gluteal–femoral adiposity cohort, as individuals in this category are not at elevated risk for insulin resistance and T2DM. However, almond consumption did not improve HbA1c in any BFD cohort. This may be attributable to the fact that participants had normal levels of HbA1c at baseline (<5·7 %). Thus, there may have been limited capacity for HbA1c to decline. Previous studies where there are mixed effects of almond consumption on HbA1c were conducted in adults with prediabetes or T2DM and elevated HbA1c (Reference Cohen and Johnston3,Reference Chen, Liu and Li10,Reference Wien, Bleich and Raghuwanshi11). Studies that assess the effect of nut consumption on HbA1c in adults with normal HbA1c levels report an increase in HbA1c when interventions are less than 3 months, and no effect of nut consumption on HbA1c when interventions are longer than 3 months(Reference Tindall, Johnston and Kris-Etherton34). Recruitment and group assignments in this trial were based on BFD. Participants did not have an anticipated elevation of HbA1c at baseline, possibly due to their relatively younger age. Future studies should assess the effects of chronic almond consumption on HbA1c in adults with different BFD and with elevated HbA1c levels to clarify the role of almond consumption on glycaemic control.
Both epidemiological and randomised controlled trials report that almond consumption increases total diet quality, measured by the HEI. Data from the 2001–2010 National Health and Nutrition Examination Survey (NHANES) reported that total diet quality, measured by the HEI-2010 score, was 15 % higher in almond consumers compared with non-consumers(Reference O’Neil, Nicklas and Fulgoni35). Randomised controlled trials also report higher diet quality, measured by HEI-2010, in adults who incorporated almonds into their diet for 3 weeks compared with when no almonds were consumed in the diet(Reference Burns, Zitt and Rowe36). In our study, incorporation of almonds into the diet increased total diet quality by 8·3 (sem 2·1) % by the end of the intervention. However, nuts are included in the ‘seafood and plant protein’ component and influence the ‘fatty acid’ score component of the total HEI score, thus adding nuts to the diet without changing any other aspect of the diet, by definition, increases total HEI score(Reference McArthur, Higgins and Hunter37). Additionally, despite higher values, the total HEI score was slightly lower than the average American total HEI score (59/100) for most participants throughout the study(38). Participants in this study regularly consumed afternoon snacks of low nutrient density, which could explain their low HEI scores(Reference Nicklas, O’Neil and Fulgoni39). Diet quality is also negatively associated with body weight and body fatness(Reference Drenowatz, Shook and Hand40,Reference Pate, Taverno Ross and Liese41) , which may be another reason for low HEI scores in our participants.
Epidemiological studies report that regular nut consumption is associated with a lower risk of weight gain over time compared with rare or no nut consumption(Reference Freisling, Noh and Slimani42–Reference Martínez-González and Bes-Rastrollo44) and a lower risk of becoming overweight or obese(Reference Freisling, Noh and Slimani42,Reference Bes-Rastrollo, Wedick and Martinez-Gonzalez43) , even though daily energy intake is higher in regular nut consumers(Reference Bes-Rastrollo, Wedick and Martinez-Gonzalez43,Reference Freisling, Noh and Slimani45) . In randomised controlled trials where almonds are added to the diet, there is less weight gain than expected(Reference Fraser, Bennett and Jaceldo46,Reference Hollis and Mattes47) . Consistent with the literature, participants in our study who consumed 1.5 oz of almonds every day for 6 months had higher daily energy intake but did not change body weight as indicated by the ITT and complier analyses. This could be due to compensation for 28 % of the energy from almonds. Coupled with this is evidence that about 19 % of the energy from almonds is not bioaccessible and is lost in the faeces(Reference Gebauer, Novotny and Bornhorst48) and some energy may be dissipated through increased energy expenditure(Reference Hollis and Mattes47), although these were not measured in this study.
Findings on the effects of almond consumption on body composition are mixed. In studies where almonds did not change body weight, there were no effects of almonds on fat mass(Reference Bowen, Luscombe-Marsh and Stonehouse49), fat free mass(Reference Bowen, Luscombe-Marsh and Stonehouse49), abdominal fat(Reference Bowen, Luscombe-Marsh and Stonehouse49) and percentage body fat(Reference Chen, Liu and Li10) compared with control groups or baseline values. In studies where almonds decreased body weight, there were also significant reductions in truncal fat, VAT, body fat percentage and fat mass compared with baseline or the stipulated control group(Reference Wien, Bleich and Raghuwanshi11,Reference Dhillon, Tan and Mattes50,Reference Wien, Sabate and Ikle51) . Participants in this study did not change total fat mass or total fat mass percentage in the ITT or complier analyses, or change total lean mass in the ITT analysis, which is similar to previous studies where there were no changes in fat mass when body weight was stable(Reference Chen, Liu and Li10,Reference Bowen, Luscombe-Marsh and Stonehouse49) . Participants in the almond, high SAT group increased total lean mass compared with participants in the control, high SAT group in the complier analysis. Almonds may increase total lean mass by contributing protein to the diet, which enhances energy expenditure and fat loss(Reference Gilbert, Bendsen and Tremblay52). Although it should be noted that almonds likely have a beneficial effect on body composition due to their nutrient composition, whether almonds are unique in their ability to improve body composition or whether it is due to the nutrients they contribute to the diet could not be dissociated in this study. In the ITT analysis, participants with high SAT who consumed almonds for 6 months decreased android fat mass percentage and increased android lean mass percentage. The effects of almond consumption on android fat and lean mass percentages are similar to those reported by Dhillon et al. (Reference Dhillon, Tan and Mattes50), where healthy adults decreased truncal fat mass percentage and increased truncal lean mass percentage. However, this study was a weight loss study where participants consumed an almond-enriched (15 % of energy from almonds) or nut-free energy-restricted diet for 12 weeks. Despite the differences in almond dose, length of intervention and energy intake, the similar outcomes provide confidence that the effect of almond consumption on android fat and lean mass percentage is robust. In the ITT analysis, participants with high SAT who consumed almonds tended to gain less android VAT mass compared to participants with high SAT on the control customary diet group. While consumption of almonds slightly decreased VAT mass in participants with high SAT, the control, high SAT group gained VAT mass. It is unclear why the control, high SAT group had a large increase in VAT mass over the 6-month intervention. There are limited studies assessing the effect of almond consumption on VAT mass directly, and results are inconsistent(Reference Bowen, Luscombe-Marsh and Stonehouse8,Reference Dhillon, Tan and Mattes50,Reference Liu, Hwang and Ryu53,Reference Liu, Hwang and Kim54) . Other studies on VAT reported that almond consumption prevented a gain in VAT mass, particularly when consumed as a preload to a meal as compared with when they are consumed as snacks(Reference Bowen, Luscombe-Marsh and Stonehouse49,Reference Liu, Hwang and Ryu53,Reference Liu, Hwang and Kim54) . Furthermore, each study that reported an effect of almond consumption on VAT mass was 16 weeks or greater. Future studies of 16 weeks or longer should clarify the role of almond consumption on VAT mass, especially when consumed with meals. Whether the effect of almond consumption on VAT mass is limited to those with high SAT should also be further explored.
This study has limitations. Physical activity was not assessed in this study, although participants were instructed to maintain consistent levels of physical activity throughout the intervention. However, changes in physical activity could have accounted for the lack of change in body weight despite higher energy intake in participants who consumed almonds, and could have resulted in the decreased android fat mass percentage in those with high SAT. Self-reported dietary intake was used to document compliance to the intervention. Such records are notoriously biased and inaccurate(Reference Mattes55), especially for under-reporting snacks(Reference Poppitt, Swann and Black56). Alternatively, participants may have stated that they consumed almonds in their dietary records because they knew that was expected of them, but failed to do so. Another limitation of this study was the use of participants with normal biochemistries. Much of the literature that reports a decrease in glycaemia and lipaemia with almond consumption are in adults with elevated concentrations of these biomarkers. Recruiting participants with elevated glycaemia or lipaemia would have provided better insights on whether the physiological effect of almond consumption differs between BFD in populations where this is most important.
Conclusions
The present findings confirm beneficial effects of incorporating 1·5 oz of almonds into the diet on diet quality without promoting positive energy balance and weight gain. They also provide evidence for a beneficial effect of almond consumption on android fat and lean mass percentages, primarily in those with a high subcutaneous fat depot which may moderate chronic disease risk. This study did not demonstrate that almond consumption, as implemented in this trial, had a robust effect on cardiometabolic health, but baseline indices were largely normal in this sample. The trial also did not demonstrate that testing people with different BFD accounts for the mixed evidence of almond consumption on long-term glycaemic control. Future studies should clarify the role of almond consumption on HbA1c in adults with elevated concentrations.
Acknowledgements
The authors would like to thank Barbara Myers and Sarah Wainscott for assistance with recruiting, and the nursing staff at the Indiana CTSI Clinical Research Center (UL1TR002529) for their help with subject visits. The authors would also like to thank Judy George, Robin Rhine and Pam Lachcik at the Purdue Clinical Research Center for their help with subject visits. The authors also thank Anthony Acton and Judy George for assistance with analytical measures.
This work was supported by the Almond Board of California. A portion of the analyte measures were completed by the Translation Core at the Indiana University Center for Diabetes and Metabolic Diseases (P30 DK097512). The Almond Board of California had no role in the design, analysis or writing of this article.
S. R. H. and R. V. C. carried out the study. S. R. H. analysed the data, interpreted the findings and wrote the article. R. D. M. and R. V. C. formulated the research questions, designed the study, helped interpret the findings and reviewed the written article.
There are no conflicts of interest.


 Open access