


Evaluation of nutritional status during childhood has been shown to be an effective strategy to plan ways to prevent diseases in adulthood and to monitor interventions for weight gain or loss to assure adequate development of the organism(Reference Gracia-Marco, Moreno and Ruiz1,Reference Canfell, Littlewood and Wright2) . However, adequate methods to evaluate nutritional status of children and adolescents must be dynamic and take into consideration the different stages of sexual maturation among people of the same gender and age, as well as the periods of rapid physical growth and development that are characteristic of these two phases(Reference Silva, Fields and Sardinha3,Reference Buffa, Mereu and Comandini4) .
The WHO indicates the use of growth curves considering the BMI broken down by gender and age(5). Most health professionals have used BMI to investigate nutritional status in children and adolescents; however, this method does not make any distinction among fat mass, lean mass and total body water content, so it is not a good method to identify and monitor changes in the body composition of these groups(Reference Javed, Jumean and Murad6).
Among the various ways to investigate and monitor the body compartments, bioimpedance analysis (BIA) stands out for good accuracy and precision, besides having characteristics that favour its clinical application: it is a portable practical equipment, inexpensive and non-invasive(Reference Kyle, Bosaeus and De Lorenzo7–Reference Kyle, Earthman and Pichard9).
In the conventional approach, the bioelectrical impedance measures are converted into body masses and volumes through mathematical equations. However, despite the widespread use, the conventional protocol of BIA is associated with large discrepancies when used in childhood and adolescence(Reference Chula de Castro, Lima and Silva10,Reference Verney, Metz and Chaplais11) . The main drawbacks involve errors in application of the numerical equations or in the assumption of the mathematical constants used to define the hydration status of the tissues, since the water percentage varies greatly in children and adolescents according to their degree of maturation and development, leading to unrealistic values of body compartment estimates(Reference Genton, Hans and Kyle12,Reference Lukaski13) .
An alternative bioimpedance method that directly uses the bioelectrical variables measured by the device – resistance (R) and reactance (Xc) – without the need to use predictive equations and/or assumptions about body composition has been producing promising results since it is less prone to imprecision in paediatric anthropometric investigation(Reference Heavens, Charkoudian and O’Brien14). This is bioelectrical impedance vector analysis (BIVA), which is based on the graphical interpretation of ellipses plotted from vectors formed by the values of R/height (R/H) and Xc/height (Xc/H). This analysis supplies a semiquantitative estimate of lean body mass, fat body mass and total body water content, allowing discrimination of the different body compartments(Reference Silva, Fields and Sardinha3,Reference Buffa, Mereu and Comandini4) .
Many studies have demonstrated the efficacy of interpreting the nutritional status and hydration degree of sick and healthy children and adolescents through the BIVA approach(Reference De Palo, Messina and Edefonti15,Reference Redondo-Del-Río, Camina-Martín and Marugán-de-Miguelsanz16) . This tool may be useful in the daily lives of paediatric health professionals helping to determine children’s body composition. However, there are no parameters designed and validated for these groups. Therefore, the objective of this study is to propose confidence and tolerance BIVA ellipses and investigate its use as a tool to ascertain nutritional status through the BMI/age ratio and the cardiovascular risk through waist circumference (WC).
Methodology
It is a transversal study, covering the years 2018 and 2019, being part of a larger ongoing research project called ‘Study of Nutrition and Health of Children and Adolescents’ (ENSCA in the Portuguese acronym). It is a population study among children and adolescents aged 5 to 19 years, of both genders, who attend public schools in the city of Fortaleza, Ceará, Brazil, at the primary and secondary levels.
The sample units for selection were the municipal public schools determined for the first phase of the ENSCA study. They were selected according to the number of students enrolled (primary level – one school – or secondary level – two schools). According to the flow chart described at Fig. 1.
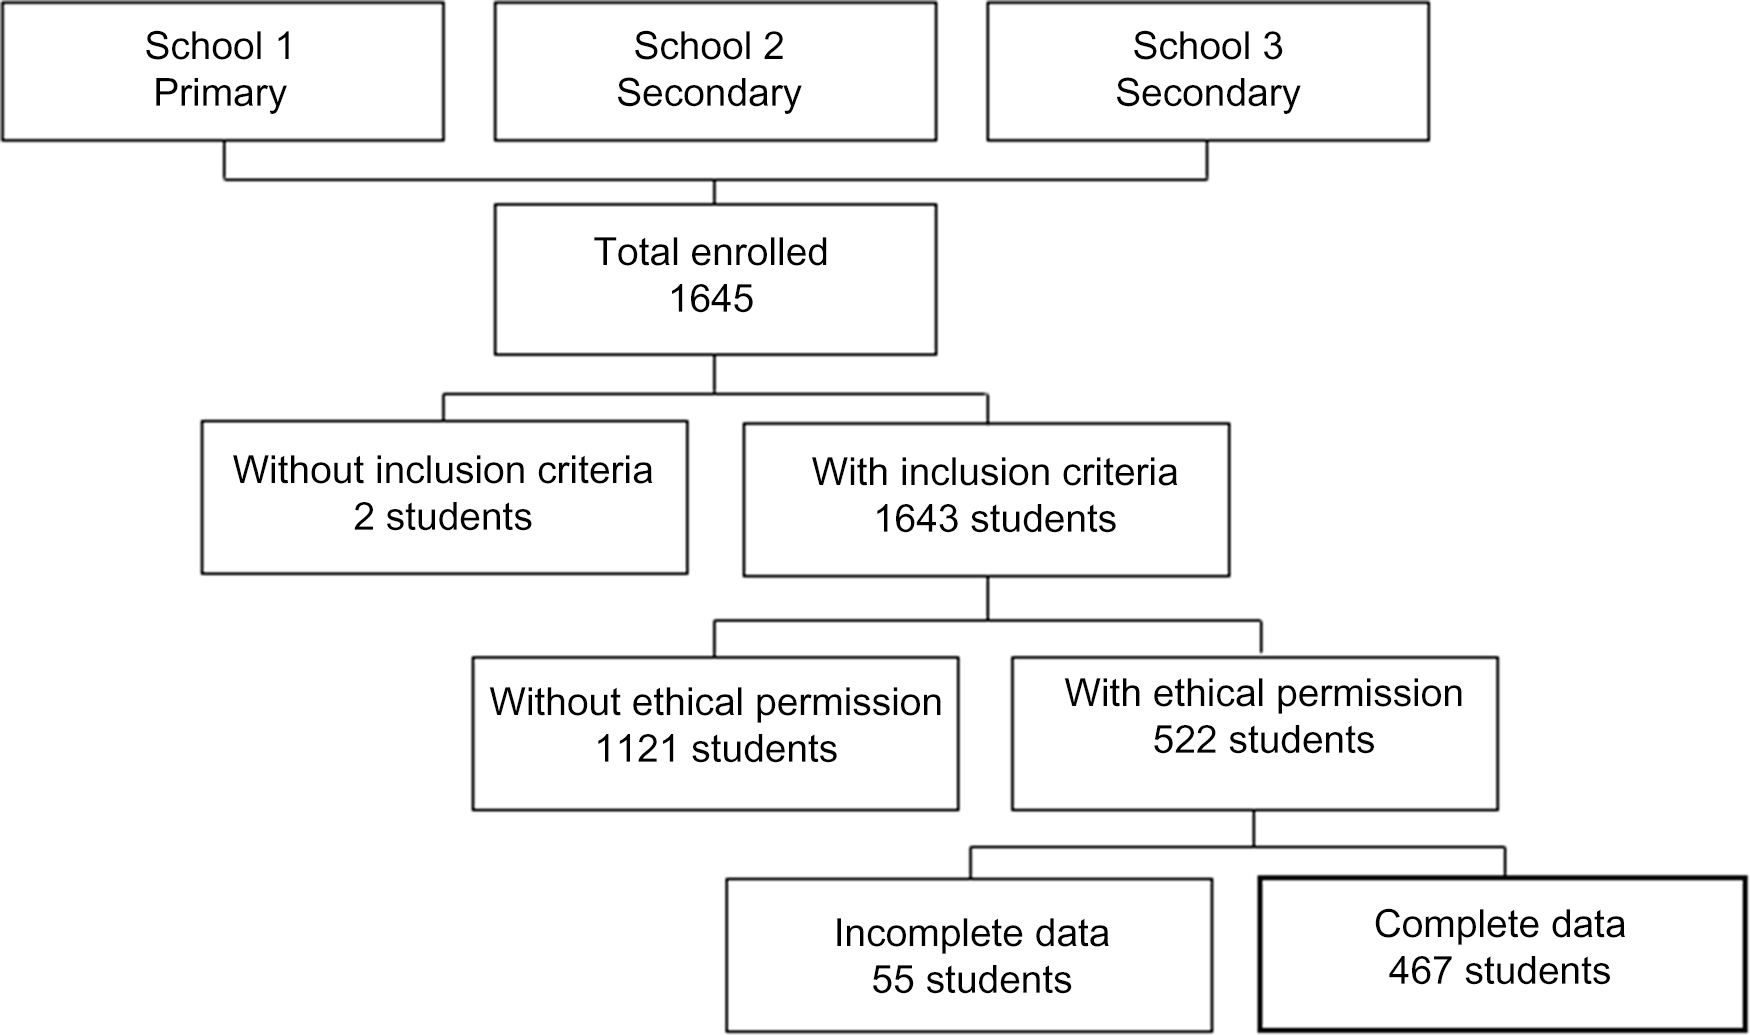
Fig. 1 Sample flow chart
The population base corresponded to 66 587 students enrolled in public schools in 2018, aged 10 to 19 years(17). To calculate the sample, a sample error of 5 % was considered, under a 95 % confidence level and an expected estimate of excess weight of 50 % to maximise the sample size, from the application of the formula:
 $$n = (1 \cdot {96^2}/4\,{K^2})/(1 + (1 \cdot {96^2}/N4\,{K^2})),\,{\rm{where}}:$$
n is the size of the sample of students, considering the sample plan used; N is the total number of students in the register; and K is the desired margin of error.
The sample calculation resulted in 385 individuals. An additional 20 % was added to the sample to cover for possible sample losses, resulting in 462 participants.
The students were selected from three public schools in Fortaleza. The student population was stratified according to the third regional areas that comprise the administrative and political division of the city, called Regional Executive Secretaries III (SER-III), according to the following criteria: (1) participation of schools with the largest number of students; (2) in each school, students were selected in proportion to the number of students enrolled, distributed in the age group of 5 to 19 years; and (3) in each school, students were taken randomly, according to the order of presence in the class diary on the day of the survey. Pregnant and lactating adolescents, those with any physical or mental condition that would disable participation, were excluded from the study. After applying the inclusion and exclusion criteria, 467 adolescents participated in the present study.
The data on weight (Seca® portable electronic scale with a capacity of 150 kg and variation of 100 g) and height (Alturaexata® portable stadiometer, with amplitude of 200 cm and variation of 0·1 cm) were used to calculate the BMI (in kg/m2). All the procedures to obtain these anthropometric measures were based on Pelletiet protocols(Reference Pelletiet18).
The individual anthropometric results were classified according to Z-score tables with the AnthroPlus software, V.1.0.2, from the WHO(5). The BMI/age values were divided into four categories: lean (BMI < Z-score −2), eutrophic (BMI ≥ Z-score −2 and BMI ≤ Z-score +1), overweight (BMI ≥ Z-score +1 and ≤ Z-score +2) and obese (BMI ≥ Z-score +2).
The WC was measured halfway between the last costal arch and the upper part of the iliac crest and the cardiovascular risk was categorised according to the cut-off points proposed by Fernández for combined ethnicity, which is stratified by sex and age and defines the presence of cardiovascular risk as measures above the 75th percentile (p75)(19,Reference Fernández, Redden and Pietrobelli20) . The anthropometric measurements were performed in a single measure by a group of trained evaluators. To reduce changes in water status was used a protocol involved previous preparation aiming to standardise the hydration status undergo the BIA assessment. The evaluation was made with the patient in the supine position according to manufacturer’s instructions, and the study participants were demanded to follow these recommendations: avoid drinking alcoholic beverages as well as caffeine for 24 h before the test, food fasting for 4 h before the test, avoid intense exercising for at least 12 h before the test and participants under medications were excluded.
The bioimpedance was measured with a Biodynamics model 450 tetrapolar bioimpedance analyser (800 µA – 50 kHz), by insertion of the data on sex, age, weight and height, previously collected. The bioimpedance device is accurate to 0·1 % in R, 0·2 % in Xc and 0·2 % in phase angle (PA). The measurement method was standardised according to the protocol described by Lukaski(Reference Lukaski, Whitehead and Prentice21). BIA was performed on only one occasion. The raw data on R, XC and PA supplied by the device were used in the further analysis.
To facilitate understanding of the results, taking into consideration the difference in the body composition expected between the different age ranges of the students, we divided the sample into two groups. Those with ages between 60 and 120 months were classified as children and the others, with age greater than or equal to 120 months, were classified as adolescents(22).
The data on sex, WC, BMI/age, PA, R, Xc, R/H and Xc/H are presented in the form of tables with values of frequency, mean and standard deviation. To investigate the association between qualitative variables, the Chi-square test was used with significance of P < 0·05. For the parametric quantitative variables and linear correlation coefficient (or PA) between R and Xc, Student’s t test was applied, with significance of P < 0·001. Finally, to investigate the variance of the measures, ANOVA was applied with significance of P < 0·05. In all cases, the software IBM SPSS Statistics for Windows, Version 19, was used.
The raw data of R, Xc and PA were obtained from the BIA readings. The R and Xc were standardised by height (R/H (ohm/m), Xc/H (ohm/m)) to create vectors to be represented on an RXc graph (abscissa axis: R/H; ordinate axis: Xc/H), where the PA determines the position of the ellipse and the correlation coefficient (r) between R and Xc determines the major diameter (axis ‘A’)(Reference Piccoli, Pillon and Dumler23).
The descriptive statistics of the vector components R/H and Xc/H were used to calculate and plot in the RXc graph the 95 % confidence ellipses from the average vectors of the groups with a programme supplied by Piccoli and Pastori(Reference Piccoli and Pastori24). Then each individual impedance vector was transformed into a bivariate Z-score (where Z stands for the standard normal deviation or the score of the impedance vector), to plot the 50 %, 75 % and 95 % tolerance ellipses on another graph, called the RXc score graph. Both the RXc and RXc score graphs are probability diagrams that classify an individual vector according to its distance from the mean value of the population(Reference Redondo-Del-Río, Camina-Martín and Marugán-de-Miguelsanz16,Reference Piccoli, Pillon and Dumler23,Reference Piccoli, Rossi and Pillon25) . The Hotelling’s T 2 test was used to compare the significance between two ellipses(Reference Hotelling26). In case of overlap of ellipses, non-significance was assumed (P > 0·05).
The BIVA protocol was also applied to the data on BMI/age and WC to investigate whether these anthropometric variables affect R and Xc in similar fashion to the age ranges. The plotting of viable confidence ellipses for these parameters can indicate the feasibility of these methods for classification of the nutritional status and cardiovascular risk in the investigated group, respectively.
Results
All told, 120 children and 347 adolescents took part in the study, with average ages of 8·2 years (sd ± 1·2) and 12·7 years (sd ± 1·8), respectively. There was an association between age range and sex, with predominance of girls among the children and boys among the adolescents. There also was an association between age range and BMI/age. From the standpoint of BMI/age, the classification of eutrophic prevailed in both groups, with leanness being more prevalent among the children and obesity among the adolescents. In both groups, the absence of cardiovascular risk predominated, but there was no significant association with age range (Table 1).
Table 1 Frequency of the distribution of children and teenagers by sex, waist circumference, BMI/age and height/age
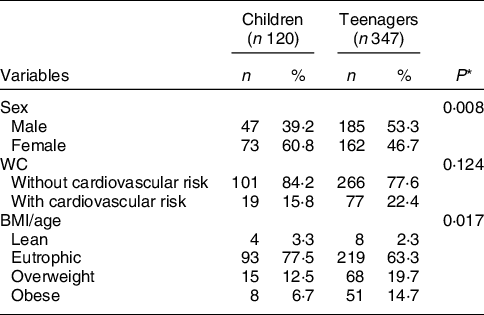
WC: Waist circumference; BMI/A: BMI/age.
* Chi-square test with significance of P < 0·05.
The confidence ellipses in Fig. 2 depict the body metric differences between the age groups. The children presented higher values of R/H and Xc/H than the adolescents. The child group contained greater average vectors and smaller PA, while the teenagers group had lower average R and greater Xc.
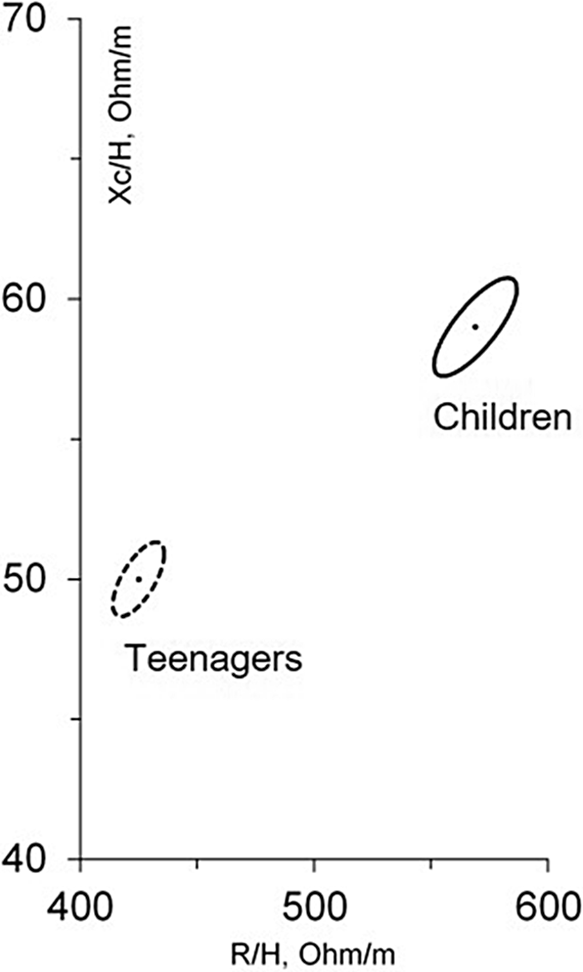
Fig. 2 Bivariate ellipses of the average vectors of 95 % of the individuals in the groups of children and teenagers. Results according to Hotelling’s test (T 2)
Figure 3 presents the plot of the individual vectors of the groups in the 50 %, 75 % and 95 % tolerance ellipses. It was possible to draw the graphs with significance for the different age ranges, since only 2·5 % (n 3) and 3·2 % (n 11) were outside the curves for children (a) and teenagers (b), respectively. The elliptical shape of the tolerance intervals was defined according to correlation coefficients between 0·56 and 0·91 for children and between 0·60 and 0·73 for teenagers.
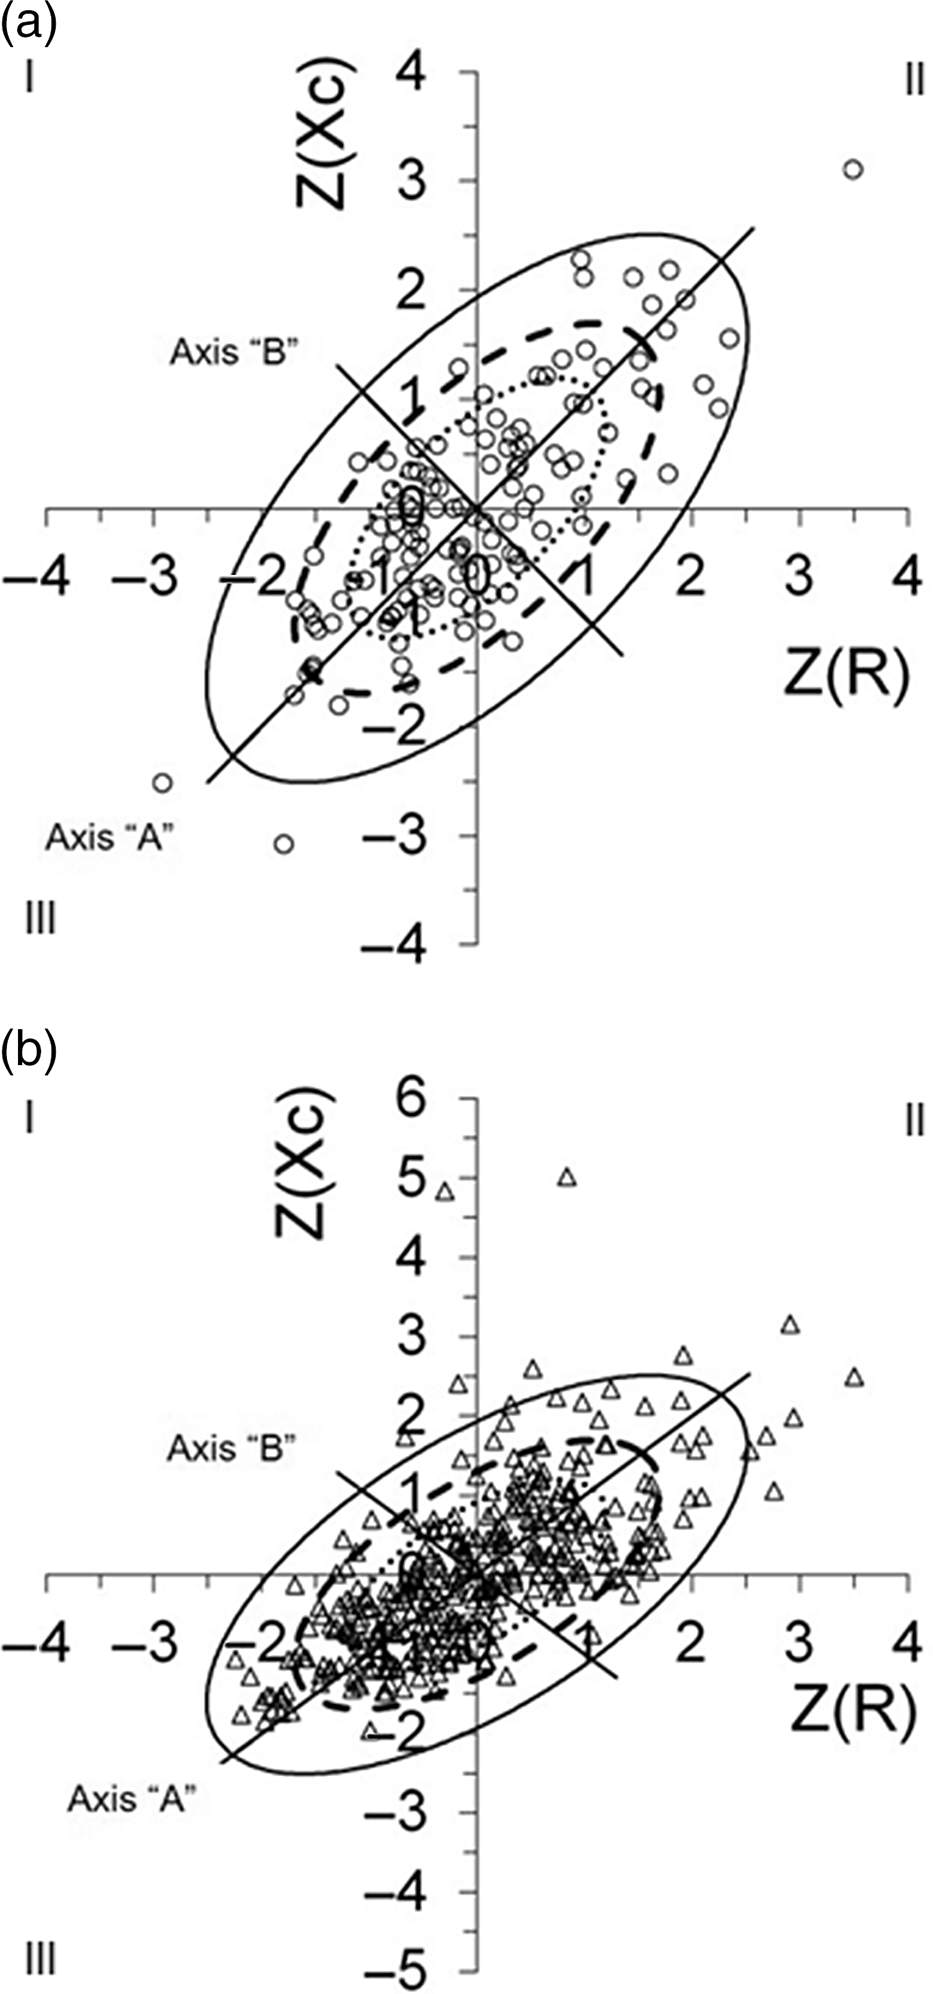
Fig. 3 Plot of all the individual vectors of children (a) and teenagers (b) within the 50 %, 75 % and 95 % tolerance ellipses. Z (Xc): reactance/height (Ohm/m – standardised) and Z (R): resistance/height (Ohm/m – standardised). The quadrants denoting athletic build for I, leanness for II, obesity for III and cachexia for IV. (a) ![]() , 50 % tolerance;
, 50 % tolerance; ![]() , 75 % tolerance;
, 75 % tolerance; ![]() , 95 % tolerance;
, 95 % tolerance; ![]() , Children. (b)
, Children. (b) ![]() , 50 % tolerance;
, 50 % tolerance; ![]() , 75 % tolerance;
, 75 % tolerance; ![]() , 95 % tolerance;
, 95 % tolerance; ![]() , Teenagers
, Teenagers
Fig. 3 shows large saturation of individuals within the 95 % tolerance ellipse, with greater concentration in the 50 % ellipse, where the expectation is normality of body composition. However, in both age ranges, there were tendencies to the quadrants denoting athletic build (I), leanness (II), obesity (III) and even cachexia (IV). For the children, of the three points outside the 95 % curve, two are in the obesity quadrant and the other is in the leanness quadrant. In turn, for the teenagers, the outliers are distributed more among the leanness category, with some having greater accumulation of cell mass, indicative of athletic build. With regard to the 75 % tolerance curves, there was greater concentration of outliers in the dehydration pole, especially among the children (axis A).
Table 2 shows results between the variables and different age groups but compiles all kind of participants’ results within BMI/A and WC groups. There was a directly proportional relationship between BMI/age and PA and an inversely proportional pairwise relationship between BMI/age and the other parameters (Table 2). The mean values of the bivariate vectors of R/H and Xc/H presented progressively lower numbers with increasing BMI. Despite the significant difference between the different BMI classifications, it was not possible to plot the ellipses of this parameter in a confidence graph. The graphs generated contained overlapping ellipses, which according to the BIVA framework indicate non-significant results. In this way, it is not possible to evaluate nutritional status from BMI/age according to ellipses due to its overlaps.
Table 2 Means and standard deviations of the variable used to plot the confidence ellipses

BMI/A: BMI/age; WC: waist circumference.
* Student’s t test with significance of P < 0·001.
** ANOVA with P < 0·05.
The WC data indicated that individuals with higher weight had greater cardiovascular risk. Also individuals without cardiovascular risk had higher mean values of the bivariate vectors R/H and lower Xc/H, but Xc and R in participants without cardiovascular risk were greater than with cardiovascular risk. It was possible to draw confidence ellipses of cardiovascular risk according to the BIVA method. The ellipses for both age groups were similar, with the individuals with cardiovascular risk presenting lower average values of R/H and greater Xc/H. According to Hotelling’s T 2 test, both graphs had significant relationships between the ellipses (P < 0·001), but the cardiovascular risk of the adolescent group was greater than that of the child group, T 2 = 38·2 and T 2 = 22·3, respectively (Fig. 4)(Reference Hotelling26).
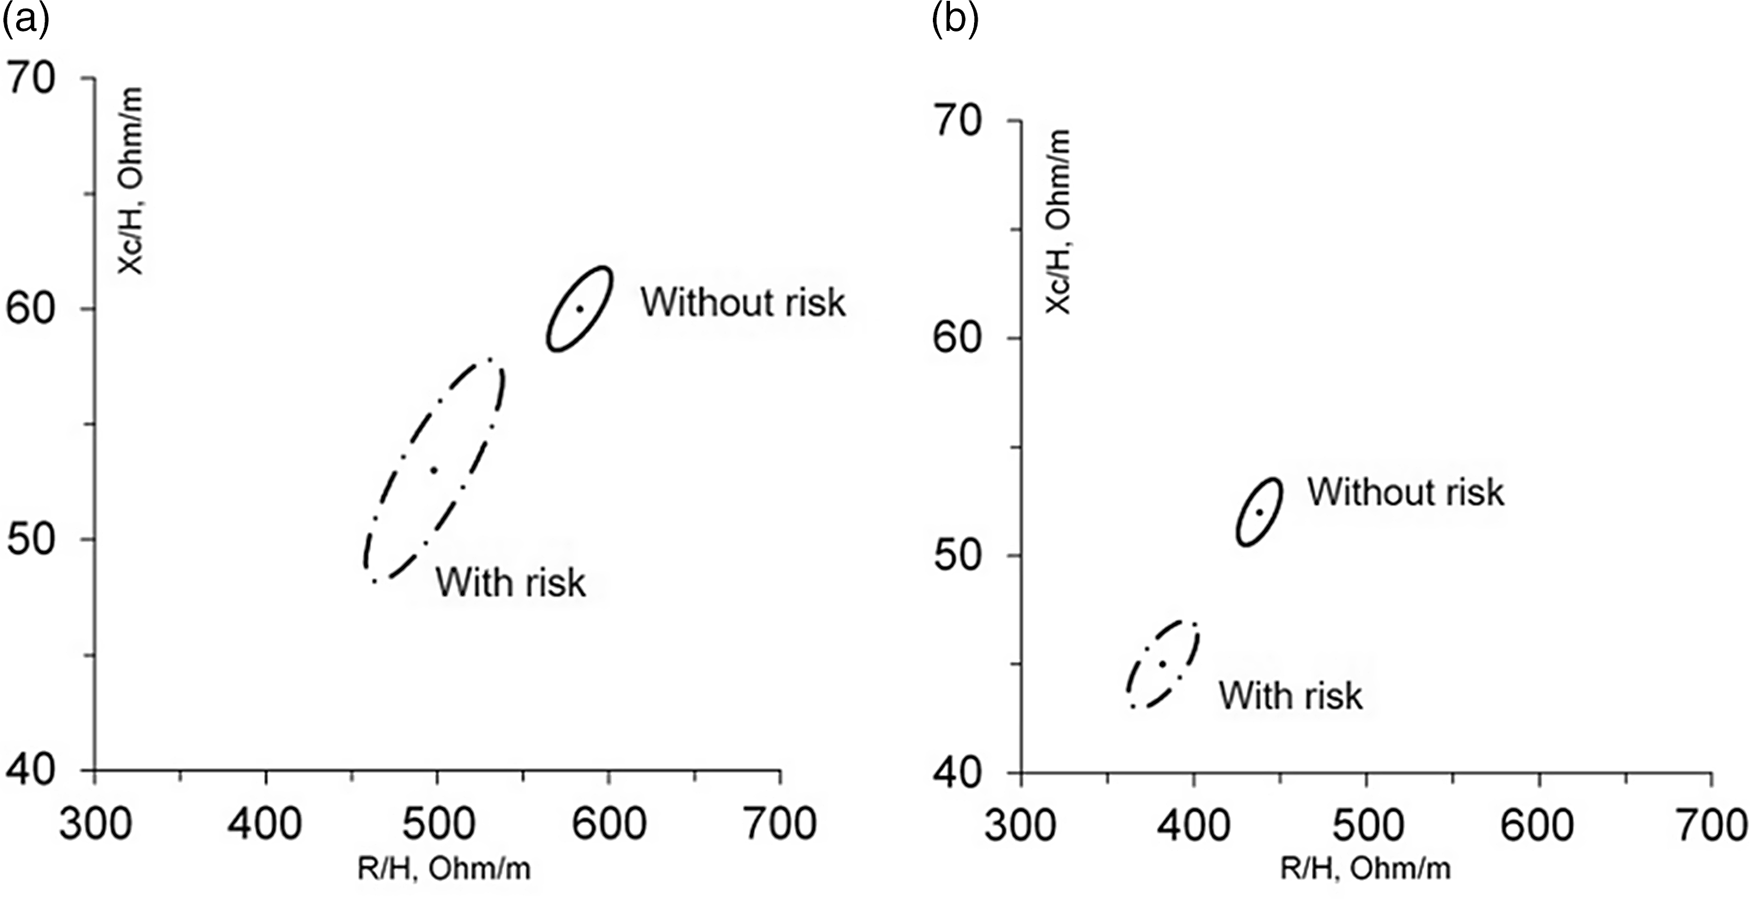
Fig. 4 Bivariate ellipses of the average vectors of 95 % of the individuals present in the groups with and without cardiovascular risk. Results for children (a) according to Hotelling’s test (T 2): (r) with risk of 0·83 and (r) without risk of 0·73; T 2 = 22·3; P < 0·001. Results for teenagers (b) according to Hotelling’s test (T 2): (r) with risk of 0·68 and (r) without risk of 0·64; T 2 = 38·2; P < 0·001
Discussion
It was possible to plot the confidence and tolerance ellipses for both age groups of the studied population. The BIVA tool can also be used to plot a confidence graph for RXc to investigate cardiovascular risk in groups, but in this study, there was no nutritional status ellipses evaluation by using the BMI/age variable.
There was an increase in the PA with greater age. The changes characteristic of adolescence cause an increase in Xc, associated with a larger lean body mass, as well as decreased R, caused by the increase of fat body mass and accumulation of fluids(Reference Cole27,Reference Norman, Stobäus and Pirlich28) .
Also, greater PA was find among participants who were overweight or obese. PA is a parameter that usually represents an indicator of cellular health in chronic inflammatory states(Reference Norman, Stobäus and Pirlich28). In adults, the PA has been inversely related to the accumulation of visceral fat. Thus, obese adults would be more likely to have smaller PA(Reference Barrea, Muscogiuri and Laudisio29). However, the PA is a variable influenced by many factors such as gender and age(Reference Bosy-Westphal, Danielzik and Dörhöfer30). So, in studies with children and adolescents, especially at the beginning of puberty, it has been common to correlate the PA with muscle mass and motor performance(Reference Schmidt, Bosy-Westphal and Niessner31). Other groups have found higher PA in boys than girls(Reference Shtina, Valina and Ustinova32). The PA is quantified as the angular transformation of the relationship between Xc, related to extra-cellular water, and R, related to intra-cellular water, being nearly independent of height and increasing with high body cell mass(Reference Chula de Castro, Lima and Silva10,Reference Bosaeus and De Lorenzo33–Reference Gupta, Lammersfeld and Vashi36) . Thus, in this study group, the prevalence of adolescent over children might be directly correlated with the PA and as the major contribution of individual are male adolescents, the PA be positively correlated with obesity and overweight it might be also related with a better nutritional status due to major fat-free mass or body cell mass.
The position of the confidence ellipse in our study was different from that in other studies of population groups with similar age ranges(Reference De Palo, Messina and Edefonti15,Reference Redondo-Del-Río, Camina-Martín and Marugán-de-Miguelsanz16,Reference Nescolarde, Núñez and Bogónez-Franco37,Reference Barufaldi, Conde and Schuch38) . Both the averages PA found were greater, suggesting that this population body composition was different from others previously evaluated, with a greater quantity of cell mass, greater accumulation of fat mass and higher level of hydration.
There was greater saturation in the 95 % tolerance ellipses for children and adolescents. In plotting the individual vectors within the 50 %, 75 % and 95 % tolerance ellipses, only 2·5 % (n 3) were outside the curve for children, while for adolescents in Fig. 3 was 3·2 % (n 11). According to Picolli et al., when using 95 % ellipses for adequacy, the expectation is that only 5 % of the individuals evaluated will be outside the tolerance found. Since for both age ranges the presence of outliers was smaller than the permitted threshold, the tool is suitable to evaluate the body parameters of the two age groups(Reference Piccoli, Rossi and Pillon25).
Santos et al., using bioimpedance to investigate the body composition of 547 children and adolescents (aged 5 to 19 years) in Brazilian schools, also found high percentages of eutrophic individuals (59 %), followed by overweight (21·1 %) and obese students (19·9 %)(Reference Dos Santos, Forte and Mundstock39). Recent studies have reported an ongoing increase in the rates of overweight and obese people throughout the world. It is estimated that some 254 million children and adolescents will suffer from obesity by 2030, with around 7·6 million in Brazil(40). However, it is also important to consider deviations of the 75 % and 95 % tolerance curves in the quadrants denoting leanness, cachexia and athletic build. For the first two, it must be considered that Brazil is still passing through a demographic transition process, so forms of malnutrition still persist in the country that can be associated with energy shortages or misguided dietary choices(Reference Coutinho, Gentil and Toral41).
Because of the high chances that obesity in childhood will persist in adulthood, the risks-related poor food choices, and spending on health care among adults, it is very important to formulate nutritional assessment strategies that enable knowing the evolution of body parameters of children and adolescents(Reference Shalitin and Kiess42,Reference Tajima and Pawankar43,Reference Farr and Dimitri44) .
The BIVA ellipses allow longitudinal monitoring of individuals to support the application of more assertive nutritional strategies at younger ages, aimed at reducing the prevalence of obesity, leanness, cachexia, fluid imbalance or even pathologies(Reference Carrasco-Marginet, Castizo-Olier and Rodríguez-Zamora45–Reference Nwosu, Mayland and Mason47).
The findings in this study demonstrate the applicability of the curves plotted. The children presented higher rates of leanness in comparison with overweight and obesity, both of which became more prevalent during adolescence. Therefore, nutritional strategies applied during childhood can help avoid future adiposity among this group of people, making BIVA a good indicator for monitoring the nutritional status of this group.
Situations of hypohydration or dehydration are more common among adolescents than children, although this is not directly related to differences in body composition(Reference Feferbaum, de Abreu and Leone48). Studies indicate that water consumption diminishes with age, replaced by carbonated and sweetened beverages or milk(Reference Kavouras, Bougatsas and Johnson49). This change in the ingestion of fluids can be due to alterations of dietary patterns or difficulty of access to good drinking water during study periods(Reference Suh and Kavouras50).
WC is an anthropometric variable widely used to identify high levels of abdominal adiposity. Various studies have indicated that the WC of children and adolescents can be an excellent predictor of health problems related to obesity in adulthood, since increased central obesity causes greater risk of developing type 2 diabetes and CVD in adult life(Reference Ajala, Mold and Boughton51,Reference Patnaik, Pattnaik and Rao52,Reference Fredriksen, Skår and Mamen53,Reference Santos, Severo and Lopes54,Reference Chan, Tarrant and Ngan55) . Therefore, efforts to control this high central obesity in childhood are also important to lower the risk of future negative cardiovascular events.
The WC data of the two age groups in this study enabled plotting confidence ellipses in the RXc graph, thus demonstrating the possibility of using BIVA as a tool to identify cardiovascular risk in children and adolescents. Children and adolescents with no cardiovascular risk were found higher values of R/H, lower Xc/H levels and isolated values of Xc and R greater than the same population with risk (Table 2). The Xc by itself is correlated with the intra-cellular water reflecting the capacitive properties of the cell membrane, as well as its quantity, integrity, function and composition(Reference Heavens, Charkoudian and O’Brien14). Due to WC we have found lower values of Xc but in other studies evaluating wasting conditions(Reference De Palo, Messina and Edefonti15), the Xc was not evaluated by itself, it was observed a deviation of the BIVA vector downwards and to the right (minor axis – axis B). This finding appears after the Xc standardisation by the height of the individuals and in our research after stratification by age group and by height we have found similar results.
Gracia-Marco found results, where regardless of the total adiposity, lower levels of lean mass were positively associated with risk of CVD(Reference Gracia-Marco, Moreno and Ruiz1).
The main limitation of this study is the small sample size. Due to the restriction of the number of individuals evaluated, it was not possible to plot confidence and tolerance graphs stratified by gender and age, as usually found in the literature(Reference De Palo, Messina and Edefonti15,Reference Redondo-Del-Río, Camina-Martín and Marugán-de-Miguelsanz16,Reference Piccoli, Pillon and Dumler23) . However, this study was a pioneer in proposing the BIVA ellipses for the population in the north-east of Brazil. In addition, our research group intends to expand the studies with larger sample numbers.
Conclusion
Confidence and tolerance ellipses were plotted for the population studied, demonstrating the efficacy of the BIVA tool as a way to investigate the body compartments of children and adolescents in the city of Fortaleza. This method enabled monitoring the levels of lean and fat body mass and hydration during the development and maturation of the group studied.
The method was also suitable to identify the cardiovascular risk in these age groups, but it was not possible to stratify the population into different nutritional classifications as was done with the BMI/age curves.
Acknowledgements
Acknowledgements: We thank the Postgraduate Program in Nutrition and Health of State University of Ceará, and the Municipal Education Secretariat of Fortaleza for the technical and financial support. We also acknowledge the support of the staff and students of all the participating schools. Financial support: This research received no specific grant from any funding agency, commercial or not-for-profit sectors. Conflict of interest: There are no conflicts of interest. Authorship: A.Y. and B.N. gathered the data and L.A. and M.C. were responsible for designing the study and providing the necessary logistical support. C.A. performed the statistical analysis. A.Y., L.A. and M.C. wrote the manuscript regarding intellectual content. L.A., M.C. and M.L. participated in revising the manuscript. Ethics of human subject participation: This study was conducted according to the guidelines laid down in the Declaration of Helsinki and all procedures involving research study participants were approved by the Research Ethics Committee of State University of Ceará, according to all the precepts to preserve the security and autonomy of the participants (Finding no. 3.507.172). Written informed consent was obtained from all subjects/patients.


