


Introduction
As detailed in the excellent series on the history of nutritional science by Carpenter(Reference Carpenter1–Reference Carpenter3), following the identification of nitrogen by Rutherford in the late 18thC our understanding of the nutritional importance of protein began in Paris in the early 19thC where the indispensability of dietary N was established by the feeding trials on dogs by Magendie and the balance studies on herbivores of Boussingault. These studies, together with the chemical identification of protein by Mulder, established protein as the determinant of food “quality” and the food constituent which dominated nutritional science for the rest of the 19thC. Recognition of the concept of amino acid essentiality as the determinant of protein quality also arose early in the 19thC through feeding trials with collagen extracted from bones. This showed that collagen protein was demonstrably nutritionally inferior to proteins such as albumin extracted from serum. The advances in chemical analysis of protein and protein hydrolysates in the latter part of the 19thC resulted in the identification of many individual amino acids by the early years of the 20thC with Hopkins isolating tryptophan which in turn enabled the unusual composition of collagen and especially its lack of any tryptophan to be demonstrated. Thus Kaufman showed that gelatin + tryptophan + cystine + tyrosine maintained N balance in dogs and man. The other protein which aroused interest through its inability to allow growth of animals was zein, the principal protein extract from maize. Hopkins had shown that mice fed on zein (which contains very low levels of tryptophan) lived longer if they also received a supplement of tryptophan. This established the concept of protein quality determined by its amino acid content in animals and N balance studies with adults such as those by Thomas with different foods, rapidly established the importance of protein quality in human nutrition. The final refinements of the basic principle that amino acid content was an important determinant of the nutritional quality of protein were the experiments of Osborne and Mendel(Reference Osborne and Mendel4) who demonstrated the different amino acid requirement patterns for maintenance and growth (see Fig. 1). They confirmed that rodents fed zein lost weight and died without tryptophan, maintained weight when supplemented tryptophan and then grew with additional lysine (i.e zein was limited by tryptophan for maintenance and by lysine for growth). After this, the pioneering work of Rose identified all 8 indispensable amino acids needed to maintain N balance in adult humans(Reference Rose5), which was followed up by studies throughout the US which quantified the magnitude of amino acid requirements in adult men and women. These studies also showed that the “efficiency” of utilization of dietary indispensable amino acids (IAA) depends upon the total amount and type of nitrogen in the diet. Thus the higher the total N, the lower the amount of IAA needed for N balance and the most effective “non essential nitrogen” for maintenance is a mixture of dispensable amino acids which is better than one single dispensable amino acid such as glycine which is better than ammonia and/or urea. The clear implication of these studies is that the minimum N intake for N balance is determined by the intake of dispensable amino acids and this was confirmed with the demonstration that at any given level of N intake with egg protein, partial replacement of the protein with DAA improved N balance. This is an important issue in relation to the design of studies aimed at identifying individual amino acid requirements when subjects are fed diets based on purified amino acids. Inadequate DAA in these mixtures could result in an overestimate of the requirement. This is discussed again below in relation to the stable isotope studies.
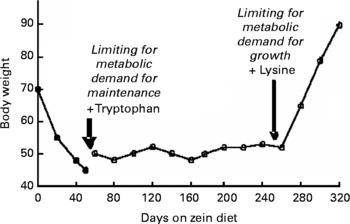
Fig. 1 Demonstration of different limiting amino acids for maintenance and growth(Reference Osborne and Mendel4).
This was the background understanding to and formed the basis of both the 1973 and 1985 FAO/WHO/UNU reports(6, 7) on human amino acid requirements. As described in a companion paper(Reference Millward8), after the 1985 report there was considerable new activity both in relation to trying to better understand the metabolic basis of the metabolic demand for and utilization of amino acids and new stable isotope studies aimed at identifying requirement values and assessing protein utilization more accurately than could be achieved in nitrogen balance studies. These studies were the background to the 2007 WHO/FAO/UNU report(9) which proposed new amino acid scoring patterns to evaluate protein quality for human nutrition. This new report was a consensus view making the best of quite disparate and often unsatisfactory data since, as concluded at the end of the report's review of the available methodologies: “At present, no method is entirely reliable for determining the dietary requirement for indispensable amino acids.” In describing its listing of amino acid requirement values the report stated: “some uncertainty remains over the adult indispensable amino acid requirements.” In what follows I have reviewed the approaches of the three reports which have considered protein quality evaluation and attempted to establish amino acid scoring patterns. I have also summarized some of the debate which preceded the most recent report. The main scoring patterns from all three reports are shown in Table 1.

1 To be used for young and older children and adults recognizing it might underestimate the quality of adults.
2 Calculated with safe protein intakes, (g/kg/d). i.e. children (2–5 years), 1·10, children (10–12 years), 0·99 adults, 0·75.
3 Calculated with average protein requirement values (g/kg/d). i.e. infants 1·12; preschool children (1-2 years), 0·86; children and adolescents (3-10 years), 0·73, adults, 0·66.
4 Requirement as mg/kg/d divided by the safe or average protein requirement as indicated.
The 1973 FAO/WHO report
While FAO/WHO Expert Committees in 1957(10) and 1965(11) proposed amino acid scoring systems based on probable patterns of amino acid requirements, the first detailed examination was made by the 1973 committee. That committee, chaired by George Beaton, recognized that the pattern of amino acids in food influenced the total protein requirement and that the relative quality (utilization) of dietary protein could be predicted from a knowledge of the pattern of amino acid requirements at various ages. The committee had available data on amino acid requirements of infants, (some derived from growth studies with individual amino acids and some calculated values from infant formulas), values for school children compiled from balance studies and the adult values. These latter values involved data on men published by Rose(Reference Rose5) and on women from a variety of authors as summarized by Irwin and Hegsted(Reference Irwin and Hegsted12). These latter values (generally considered to be better than Rose's values) had previously been critically reviewed and recalculated after regression analysis by Hegsted(Reference Hegsted13). No gender effects was identified so that a combined set of values were listed but since the Rose values were higher for each amino acid the combined set was in fact the Rose data and this was calculated per kg on the basis of an assumed body weight of 70 kg. It was recognized that no allowance for dermal losses of nitrogen had been made so that the estimates would be too low but no account was taken of this.
The general paucity of these data was recognized but having assembled these requirement patterns as mg/kg body weight for infants, children and adults, scoring patterns were then calculated in terms of mg/g protein using the safe protein allowance as the denominator which for adults had been set at a new low value of 0·55 g/kg/d. An apparent marked fall with age in the indispensable amino acids to total protein (E:T) ratio of the requirement was immediately apparent. The committee was clearly concerned about the extent of this fall with age and urged caution in its interpretation. It noted that although it was known that N balance could be maintained in adults with egg protein diluted with non specific nitrogen, such studies had not shown the E/T ratio of the requirements to be as low as the adult pattern. The new derived patterns were compared with patterns used previously based on egg and milk protein, observing that while the amino acid requirements of children and adults bear a general resemblance to the relative concentrations of the amino acids in egg and milk protein, neither food protein provides an entirely satisfactory reference pattern which could serve as a reference pattern of amino acid requirements, although might be used for biological testing. Finally the committee derived a single provisional scoring pattern mainly from the data on infants and children which could be used in preliminary evaluations of protein quality in terms of the amino acid composition of the dietary proteins. It was accepted that an evaluation of quality of a protein based on an infant/young child pattern and E/T ratio could underestimate its quality to provide for the adult requirements noting that many balance studies indicated that cereal proteins appeared to be somewhat better utilized by the adult than would be predicted from conventional (animal) studies of assessing protein quality. However because protein quality was viewed as most critical for the young it was concluded that scoring patterns appropriate to preschool children should be used, (not for infants for whom breast milk or equivalent formula were considered appropriate and did not need evaluating in terms of quality).
In identifying a provisional scoring pattern some members argued that the extensive data from rat growth studies of NPU values of various food proteins and diets could be used to adjust the amino acid pattern so that the predicted chemical scores would be in reasonably good agreement with measured NPU. This would mean that the score was a predictor of NPU. However the majority view was that the reference scoring pattern should comprise best estimates of human amino acid requirements expressed in proportion to the safe level of protein intake and this is what was done. Thus the adopted scoring pattern would give a higher estimation of quality for many proteins than with the direct (rat) approach. The provisional scoring pattern eventually identified (see Table 1) derived from estimates of requirements for the infant and school children adjusted in various ways which are not entirely transparent. The report recognized that this pattern overestimates adult protein requirements (and would underestimate quality of proteins for adults) but was not unduly concerned about this and argued it to be appropriate for pregnant and lactating women. It was also not intended to cover the needs of very young infants, not including histidine and would probably need other adjustments. It was suggested that the new scoring pattern was preferable to the use of that based on whole egg or human milk and should be used to calculate the amino acid score of a protein or mixture of proteins as
 $$\begin{eqnarray} Amino\,acid\,score = \frac {mg\,of\,amino\,acid\,in\,1\hairsp g\,of\,test\,protein}{mg\,of\,amino\,acid\,in\,reference\,pattern}\times 100 \end{eqnarray}$$
The lowest score obtained for the indispensable amino acids in a protein or diet, that of the “most limiting amino acid”, would indicate a first approximation of its efficiency of utilization by children, allowing a correction of the protein requirement for the quality of dietary protein, but may underestimate the quality of the protein for adults. Importantly, given the current debate about truncation of amino acid scores to 100 %, the committee recognized that certain proteins may yield an apparent score above 100, but stated that such a value cannot be used to adjust dietary protein requirements, since N intakes would then be less than required to meet N requirements. Thus for any protein or dietary mixture consumed by children their dietary requirement would be their safe level of intake (identified in this report from studies with egg or milk protein), multiplied by 100 and divided by the amino acid score. In practice it was suggested that only lysine, total sulphur-containing amino acids, and tryptophan, the amino acids found to be first limiting in most foods and diets, need to be considered, for calculating the scores of ordinary foods. The report listed amino acid scores for common foods calculated according to the new pattern in comparison with directly measured values of the NPU in children and rats.
Biological testing of protein quality in comparison with amino acid scores
At the time of the report those interested in evaluating the quality of diets had been very active in conducting biological tests of N utilization especially determination of NPU; N retained/N ingested under specified conditions. This is a combined measure of digestibility and the efficiency of utilization of the absorbed amino acids (biological value or BV). Although many of the studies had involved growing rats, it was recognized their different generally higher amino acid requirements meant this underestimated quality of some proteins for man, but it was argued that such studies would rank quality of proteins in the same order especially for the growing infant.
At the time, with the possible exception of Hegsted, very little distinction was made in these animal studies of NPU between the needs for growth as distinct to the needs for maintenance, so clear differences in protein quality of different protein sources were the common experience of those involved in such testing. However most human studies of NPU values used to assess the nutritional quality of proteins had been performed at protein intakes which limited growth or, in the adult, gave a negative N balance and NPU values fell as the intake of protein was increased. These low NPU values at intakes giving N equilibrium in the adult or adequate growth in the child, mean that if such NPU values were used to adjust the safe protein requirement intake, the adjusted value would always be higher, even if the test protein was egg or milk which had been used to establish safe intakes in the first place. This made no sense so that the concept of relative NPU values was introduced i.e.: the safe level of intake of food protein would be predicted as
 $$\begin{eqnarray} \frac {NPU\,of\,egg\,or\,milk}{NPU\,of\,test\,food}\times safe\,level\,of\,intake\,of\,egg\,or\,milk\,protein \end{eqnarray}$$
with NPU comparisons made of values established with the same protocols (e.g. the same limited amount of intake). Because with animal trials of NPU values, very high efficiency values for egg or milk were routinely obtained, the concept of relative NPU was seen as much more relevant for human trials.
The report stressed the distinction between protein quality, a predictable attribute of the protein mainly through its amino acid pattern (and its digestibility), and actual efficiency of utilization of a specific protein, which varies with the protein quality and other factors such as environmental conditions, age and physiological state of the recipient, energy intake and overall protein quantity, and for a mixed diet other dietary factors such as fibre, which might influence digestibility. This means that NPU measurements should be made under standardized conditions, i.e., at sub maintenance levels in adults or with growth limited by the protein intake to half the maximum rate, in otherwise energy and nutrient sufficient diets.
Having given these caveats and arguing that any comparison of the amino acid score with a biological value of protein quality such as the NPU should be made with the ratio
 $$\begin{eqnarray} \frac {NPU\,of\,test\,food}{NPU\,of\,egg\,or\,milk} \end{eqnarray}$$
the report's tabulations of values of the score and NPU measured in children and in rats showed an agreement consistent with the general concept that the content of IAAs determines protein quality.
General comments on the 1973 report
It is generally agreed that this report was the first truly scientific approach to identifying human protein and amino acid requirements. As far as its treatment of amino acid scoring, it had the very difficult task of reconciling the large and quite complex literature on protein quality evaluation in animals and humans with the relatively simple concept of predicting protein quality in terms of its amino acid score. Having identified as well as it could, a pattern of amino acid requirements from which the quality of a protein was predicted, it had to reconcile such predictions with observed values of NPU in N balance trials which were much lower than predicted at the requirement intake of the protein. Hence its introduction of relative NPU values as the most suitable measure of dietary protein quality which the score would predict. In fact it was recognizing the difficulty of interpreting N balance estimates of protein requirements or protein utilization because of the implausibility of the apparent efficiency of utilization at equilibrium, (as discussed in the companion paper(Reference Millward8)). Remarkably not only did the report make no attempt to explain this, in terms of adaptation for example, but with the single exception of Hegsted, none of those involved in protein quality evaluation at the time ever attempted to discuss what they were assessing in terms of utilization for maintenance or growth. Nevertheless the report did recognize it as a problem which had to be dealt with and introduced the concept of relative NPU values.
For the protein requirement, rather than accepting the low apparent efficiency of utilization in balance studies as plausible, which subsequent committees did, it used the much better data on the obligatory nitrogen losses (ONL) which had been evaluated by Scrimshaw and Young at MIT(Reference Scrimshaw, Hussein and Murray14) to predict the protein requirement. Thus the ONL was adjusted with a not unreasonable value of +30 % to account for the inefficiency of utilization. This was the most controversial part of the report because it lowered the protein requirement. As already indicated there was no discussion of adaptation in the report, only reference to the possibility that the fall in time of the ONL to a stable value represented losses of labile protein reserves, a popular view at the time.
In my view this report did advance the process of protein quality evaluation although it was clearly deficient in several areas. Having recognized that the balance studies used to generate amino acid requirement values generally failed to take account of surface losses it made no attempt to correct for them. This would have been a simple task given that the best data on adult women had been thoroughly reanalyzed with regression analysis by Hegsted(Reference Hegsted13). Had it done this the adult values would have been higher and it may then have proposed age dependent scoring patterns rather than the single pattern which it proposed. It also failed to deal with digestibility adequately, focusing almost exclusively on the amino acid score. In fact as recognized in the subsequent report poor digestibility is probably the major determinant of poor dietary protein quality in many plant based diets(Reference Millward15).
The 1985 report
This committee chaired by John Waterlow took a very straightforward approach to the issue of protein quality accepting that both the amino acid composition and digestibility of dietary proteins influenced their nutritional value. The main feature of the amino acid scoring patterns in this report was the inclusion of new values for the amino acid requirements of preschool children, from studies at INCAP(Reference Pineda, Torun and Viteri16, Reference Torun, Pineda and Viteri17) and a recalculation of the Japanese data on older schoolboys listed in the 1973 report. These recalculated values were somewhat lower but both original and new estimates were listed. Overall the limited and unsatisfactory state of knowledge concerning the amino acid requirements of children was emphasized. However, and somewhat surprisingly, the adult values given in the 1973 report were accepted without comment even though the 1973 report had stressed they could be too low.
Digestibility was discussed in terms of both apparent protein (N) digestibility and true protein (N) digestibility (i.e. corrected for the obligatory faecal N loss) with various examples listed for individual proteins and mixed diets, showing variation in true digestibility ranging from 97 % for egg to 77 % for an Indian rice diet. For a mixed diet a digestibility value could be estimated as the weighted mean of the values for individual foods if such values are known or an assumed value of 85 % could be used for diets based on coarse, whole-grain cereals and vegetables, or 95 % for diets based upon refined cereals. The report recommended these corrections were best applied as corrections to the intake to give the digestible protein intake to compare with the safe level of reference protein.
Amino acid scoring patterns were reported for infants, preschool and older children and adults derived from the listed amino acid requirement values and the new values for the safe protein allowance for these age groups. Because the safe protein allowances were increased compared with the 1973 report, the values in the adult scoring pattern were decreased compared with the ones listed in the 1973 report (but not recommended for use). The Consultation suggested that for infants, the amino acid pattern of human milk should be accepted as the requirement. These latter values are shown in Table 1. The new preschool pattern was in closest agreement with the 1973 pattern but values in the patterns for older children and especially adults were lower. When these patterns were compared with the amino acid content of the proteins such as egg, cows milk and beef it was clear that these proteins more than met the suggested requirement patterns. Comparisons with other plant proteins and various mixed diets showed that most scored below 100 for young children for lysine as did some diets for older children but all diets met the adult pattern.
Overall the consultation concluded that the digestibility of protein may have a much more important effect on protein quality, at least for adults, than the amount or pattern of IAAs. It argued that the protein quality of a diet should be estimated from both digestibility and its amino acid score calculated from the limiting amino acid identified from a comparison of the amino acid pattern of the food with the reference pattern.
Subsequently a joint FAO/WHO expert consultation on protein quality evaluation(18) endorsed this protein digestibility-corrected score approach although it rejected the adult scoring pattern identified in the 1985 report arguing that the amino acid requirement values for adults were too low. As an interim measure it suggested that the scoring pattern for preschool children should be used for all age groups apart from infants.
General comments on the 1985 report
The agenda for this committee had been set in terms of restoring the adult protein requirement. This had been lowered in the 1973 report which had resulted in a call for a re-evaluation(Reference Scrimshaw19). A higher value had been identified before the meeting through an international series of short term balance studies(Reference Torun, Young and Rand20). It would appear that given this emphasis on “correcting the error” of the adult protein requirement value, there was insufficient consideration of the issue of protein quality. The information on the amino acid requirements of children was extended, albeit uncritically, given that the new results were in no way robust (and were eventually declared unacceptable in the 2007 report), and the adult values assembled in the 1973 report were not only accepted without comment but by calculating a scoring pattern from them with an increased safe protein allowance (0·75 g/kg/d) all values in the pattern were lowered by 23 % compared with the pattern which had been calculated (but not recommended for use) in the 1973 report.
In retrospect, given that the major focus of the 1985 report was on increasing the adult protein requirement, the abolition of the importance of protein quality in adults might be thought of as a very surprising decision of the committee. In fact the general issue of protein quality evaluation and the specific issue of the lysine requirement and the lysine limitation of cereals and the nutritional importance of such limitation, especially of wheat, is a long standing controversy which has never been entirely straightforward. On the one hand Scrimshaw was commited to the view that cereal proteins were nutritionally inferior mainly due to lysine limitation and had vigorously pursued this problem with lysine supplementation trials of wheat in human adults(Reference Scrimshaw and Young21). Furthermore comparisons of isonitrogenous intakes of wheat and beef showed clear differences in their utilization(Reference Young, Fajardo and Murray22). On the other hand as recently highlighted by Carpenter(Reference Carpenter3) wartime studies in the UK by Widdowson and McCance had shown that 9–10 y old orphanage children studied over 6 months grew in weight and height some 25 % faster than the general population on a bread-based diet with only 14 % of protein from animal (milk) foods, with no advantage observed when nearly half the protein was from milk. In fact, as highlighted in the new report(9), in children, with energy needs much higher than adults, their protein needs can be satisfied by much less protein dense foods(Reference Millward and Jackson23). This is evident by the low level of protein in breast milk (6 % calories) which, because such milk is high in fat and therefore energy dense, mediates rapid post natal growth. Because wheat is a relatively high protein cereal (12-16 % calories) and the energy intakes of children of this age are high, the protein content of the diet of the orphanage children (12 % calories) would have provided them, if consumed to appetite, with 2-3 times their protein needs so that protein quality ceased to be important. More importantly, studies examining the nutritional quality of wheat protein in adults with high levels of energy expenditure and food intake but maintaining bodyweight also concluded that wheat-based diets maintained N balance and fitness(Reference Bolourchi, Friedmann and Mickelsen24, Reference Edwards, Booker and Rumph25).
Background to the 2007 report
Comparative data on amino acid requirement patterns for growth and maintenance
a: Growth
One aspect of the discussions prior to the 2007 report related to comparative information on amino acid requirements (e.g.Reference McLarney, Pellet and Young26, Reference Millward27). This debate had been raised as a result of the introduction of the MIT scoring pattern(Reference Young, Bier and Pellett28) which was based on the amino acid pattern of tissue protein modified with some stable isotope-based data. This was, in effect, a rejection of the basic idea that the IAA pattern for maintenance would differ from that for growth, Clearly any interspecies comparison of amino acid requirements must take into account the markedly different growth rates between species. The new born infant grows at only one tenth of the rate of a new born pig, falling to only one sixtieth the rate after weaning. This means that for humans after the first year of life, IAA requirements for growth approach insignificance and amino acid needs are almost entirely for maintenance. In contrast for fast growing animals amino acid needs are almost entirely for tissue growth with maintenance often a somewhat artificial concept and the pattern of the amino acid requirement is likely to correspond closely to the patterns of tissue protein. In factorial models of the amino acid requirements of infants and children the assumption is made that the pattern for growth is exactly that of tissue protein. Direct measurements of the growth requirement for pigs and rats expressed after equalizing each pattern for threonine are shown in Table 2. For the pig, the requirement pattern for accretion(Reference Fuller, McWilliam and Wang29) is close to the composition of mixed body proteins, relative ratios of growth:tissue IAA patterns ranging from 0·78 to 1·03. This is also the case for the young rat, (Reference Benevenga, Gahl and Crenshaw30) (relative ratios ranging from 0·75 to 1·32 and the adult rat (relative ratios ranging from 0·81 to 1·38) with the exception of the sulphur amino acids. These latter values for the rapidly growing rat requirement are higher than expected presumably reflecting cystine requirements for hair growth. Clearly these experimentally determined values are not identical to the measured tissue patterns but near enough to lend confidence to the use of the tissue pattern to guide IAA requirements for growth.
Table 2 Tissue amino acid composition and requirement patterns for growth, (G) and maintenance, (M)1

1 Amino acid content (mg/g protein) expressed relative to threonine content.
b: Maintenance
Millward and Rivers(Reference Millward and Rivers32) argued that the composition of the obligatory metabolic demand (MD) for maintenance could not be predicted from first principles. Since, as argued by Reeds(Reference Reeds33), there appear to be few major differences between mammalian species as far as the fundamentals of amino acid and protein metabolism, with the obvious exceptions, (e.g. arginine requirements for growing cats and growing and adult dogs, a taurine requirement of the kitten and a high maintenance amino acid requirement in avian species for feather growth), then inter-species comparisons of robust animal data should provide general principles about the nature of human needs. Given the economic importance of optimizing pig-meat production, in fact, most is known about the amino acid requirements of this species.
One approach to identifying the relative importance of each IAA to maintenance involves deletion studies in which individual amino acids are removed from the diet and the extent of the negative balance is monitored. If the maintenance requirement patterns corresponded exactly to the patterns of tissue protein then there should be a similar negative balance on removal of each IAA. If not then negative balance will occur in proportion to the ratio of the obligatory MD of each amino acid to its tissue content. Only one report exists for the adult rat, (Reference Said and Hegsted34) which is high quality based on measured changes in body water. Gahl et al. (Reference Gahl, Finke and Crenshaw35) report data for young rats, while Fuller et al. (Reference Fuller, McWilliam and Wang29) studied 41 Kg pigs with N balances. Table 3 shows the relative losses normalized for the response to a protein free diet. The first second and third limiting amino acids are total sulphur amino acids (TSA), threonine and tryptophan for the pig; threonine, TSA and isoleucine for the growing rat, and threonine, isoleucine and tryptophan, for the adult rat. The most highly conserved, least limiting amino acids are lysine and leucine in the rat and all three branched chain amino acids and lysine in the pig.
Table 3 Responses (extent of negative balance) to the dietary deletion of individual dietary indispensable amino acids or a protein free diet1

1 Losses as gN/kg0·75 normalized for the response to a protein free diet.
Another approach is to perform the deletion and then supplement with each limiting amino acid allowing the slope of the balance curve to be established and the consequent requirement values. These patterns, again normalized for threonine, are shown in Table 2 together with the tissue protein and growth patterns. Leucine and lysine are the two most abundant amino acids in carcass proteins and in the growth requirement patterns for both rat and pig, whereas in the maintenance requirement patterns the most abundant are threonine and TSA in the pig, threonine, isoleucine, valine and TSA in both adult and growing rat.
Yoshida(Reference Yoshida36) also explored the difference between the rate limiting amino acids at maintenance and those which rate-limit growth. Having shown that the most rate limiting amino acids in adult rats fed a protein free diet were threonine and TSA, he then showed that in adult rats fed limiting amounts of rice or wheat diets, the limiting amino acids were threonine and the sulphur amino acids. When these were added to the cereal diets, nitrogen balance was restored and growth initiated. This may explain why attempts to show that lysine is the limiting amino acid in wheat in supplementation trials in human adults, were so disappointing(Reference Scrimshaw and Young21).
The main implication of these animal data is that there are marked differences between the MD for maintenance and for growth. It is clear that in the growing rat and pig and adult rat, leucine and lysine exhibit the biggest difference between growth and maintenance patterns, with these amino acids being most abundant for growth and amongst the least abundant for maintenance. One practical consequence of this, pointed out by Hegsted(Reference Hegstead37), is that the balance-intake curve is extremely shallow for leucine and lysine both in the sub maintenance and growth range, and this means that measurement of a requirement value for maintenance is very difficult, being dependent on the exact criterion for adequacy. While the several early reports of rats maintaining body weight for 6-month periods on very low lysine diets such as zein, (see Fig. 1) or even lysine free diets(Reference Bender38) are probably explained by coprophagy providing lysine from faecal bacteria, given the clear evidence of some metabolic demand for lysine in terms of the rapid onset of symptoms on a lysine free diet in humans(Reference Rose5); no evidence exists for anything other than this metabolic demand for lysine being low.
Although the maintenance requirement values for rapidly growing animals can only be determined under physiologically unusual circumstances, it is nevertheless useful to compare such reported maintenance values with current human values for lysine. Values for the rat, pig and human are shown in Table 4 as mg/kg0·75. The summary of pig values reported most recently(Reference Ringel and Susenbeth40) includes values obtained by a variety of different approaches by 5 different authors some of which include slightly higher values than these summarized here but which the authors identified as potential overestimates. Had these been included the mean of all the studies would be slightly higher at 48 mg/kg0·75 or 15 mg/kg. The human values include the recalculated N balance data and the mean value adopted in the 2007 report mainly derived from the stable isotope studies. The former human value tends to be at the upper end of the range for rats and pigs when expressed as mg/kg0·75 but is similar as a proportion of the total requirements and much lower than tissue total IAA content. The latter, stable-isotope-derived value is by far the highest and approaches that of its proportion of IAA in tissue proteins.
Table 4 Interspecies comparison of lysine requirements

IAA, Indispensible amino acid.
1 60 g weanling rats growing to 180 g(Reference Benevenga, Gahl and Crenshaw30).
2 200 g adult female rats(Reference Millward and Rivers32).
3 30 kg pigs(Reference Fuller, McWilliam and Wang29).
4 Adult pigs(Reference Bender38).
5 Pigs of various weights measured with various methods viewed reliable equivalent to mean value of 12 mg/kg/d(Reference Baker, Becker and Norton39).
6 Recalculated N balance data of 16 mg/kg/d(9).
7 Mean adopted value of 30 mg/kg/d(9).
8 Interspecies summary(Reference Davis, Nguyen and Garcia-Bravo31).
Fuller's work(Reference Fuller, Milne and Harris41, Reference Wang and Fuller42) has pointed to ileal amino acid losses as a partial explanation of the relative metabolic demand for individual amino acids. Table 5 compares ileal losses of the pig and human. These account for some 60 % of pig amino acid maintenance requirements (including most of the pig's maintenance lysine requirement), and it is clear that in each case threonine is the largest component. The patterns do differ to a certain extent but, most importantly, the absolute values are much lower in humans than in the pig. Thus whatever is said about the pig as an inappropriate model for humans, to the extent that ileal losses comprise a component of obligatory MD, these data point to a lower, (certainly not higher), MD for lysine in humans than in the pig.
Table 5 Ileal dietary indispensable amino acid losses of the pig and human
Patterns for growth and maintenance in relation to the adaptive metabolic demand
The inherent difficulty in any discussion of amino acid requirements for growth and maintenance is that the distinction becomes difficult when the metabolic response of humans to varying protein intakes is taken into account(Reference Millward and Rivers32, Reference Millward43, Reference Millward44). We know that the metabolic response to increasing protein intakes involves increasing post absorptive losses which necessitates increasing post prandial gains to replace these losses(Reference Price, Halliday and Pacy45). The consequence of this is that the pattern of the amino acid requirement will increasingly reflect the pattern of tissue, and the obligatory demands of maintenance will form a decreasing proportion of the overall demand. A simple representation of this is shown in Fig. 2. Predicting the impact of the increased losses and gains of body protein throughout the day on the overall requirement pattern is not straight forward however because of the potential recycling of some IAAs such as lysine and threonine(Reference Millward43). However it will be the case that for humans, within the range of protein intakes which occur in practice, the pattern of the demand will to some extent be that of growth, especially for those amino acids which are immediately oxidized on release from tissue protein in the post-absorptive state, such as the branched chain and aromatic amino acids. This means that only at very low protein intakes is it likely that the pattern of the requirement will reflect that of the obligatory demand as identified in the animal studies discussed above. At usual protein takes it will include a component reflecting the needs for post prandial net protein gain but the actual overall pattern will be difficult to predict.

Fig. 2 Amino acid requirement pattern of adults in relation to protein intake levelsa. aFor adult subjects daily balance is achieved by post prandial gains of tissue protein replacing post absorptive losses. Post absorptive losses of body protein occur to meet the obligatory fixed and adaptive metabolic demand which increases with the habitual protein intake(Reference Millward43, Reference Millward44) (not shown in this diagram for simplicity). Dietary protein must meet the obligatory and adaptive metabolic demand and replace post absorptive losses of protein. At low intakes some of the post prandial demand can be met from recycling of amino acids released in the post absorptive state but not oxidized(Reference Millward43). These will be those amino acids with a high Km for their catabolic pathway such as lysine and threonine. Leucine and the other branched chain amino acids and the aromatic amino acids have low Km values and are unlikely to be recycled in the way shown. This means that the requirement pattern will only match the obligatory maintenance demand at very low intakes in fully adapted individuals. Because the adaptive metabolic demand and consequent post absorptive losses increase with increasing habitual protein intakes, the demand will involve an increasing component for net tissue protein deposition and the amino acid profile of the requirement will increasingly reflect the tissue protein pattern.
In summary then as far as the obligatory MD and the minimum maintenance requirement is concerned there is a consistent and extensive body of animal data which shows the maintenance pattern to differ from that for growth, with lower levels of lysine and leucine in the maintenance pattern. Furthermore the effect of this is that the rate limiting amino acids in dietary proteins can differ between maintenance and growth the example being that lysine limits wheat for growth but may not limit maintenance. Such a view is quite different to that of Young and colleagues whose MIT scoring pattern was specifically derived from the patterns of tissue protein adjusted for their early stable isotope studies(Reference Young, Bier and Pellett28). Although their defence of this pattern included an interspecies comparison of the 1973/1985 FAO/WHO/UNU amino acid requirement recommendations with recommendations for other mammalian and avian species(Reference McLarney, Pellet and Young26), the logic of their arguments and the data they used for that comparison did not stand up to scrutiny(Reference Millward27). As discussed elsewhere at this meeting(Reference Millward8) the values in the MIT scoring pattern, especially that of lysine, did appear to influence the design of their subsequent 24 h 13C-1 leucine balance studies especially the most robust of these studies conducted by Kurpad and colleagues in India, which are described as being conducted to verify the initial estimate of the adult lysine requirement of 30 mg/kg/d lysine and which were underpowered to identify a lower value.
The 2007 report
The agenda of the most recent WHO/FAO/UNU expert consultation(9) was to rectify what were widely seen as two errors in the 1985 report, namely the overestimation of the protein requirements for infants and the underestimation of the amino acid requirements for adults. After a detailed critical analysis of the reported amino acid requirement values for infants, children and adults and the methodologies used in their derivation, the committee's report endorsed the 1985 report(7) in recommending the breast milk content of amino acids as the best estimate of infant amino acid requirements but was unable to identify reliable requirement values for any other age groups apart from adults. It therefore adopted a factorial approach for infants and children based on the amino acid requirements for maintenance and growth. Maintenance was assumed to exhibit the same pattern at all ages on a mg/kg body weight basis, so that the adult requirement pattern was adopted, while growth was assumed to reflect the pattern of human tissue protein. On this basis scoring patterns for children aged 0·5, 1–2, 3–10, 11–14, 15–18 years, and for adults were defined as total amino acids in the dietary requirement for maintenance and growth, divided by the mean protein requirement (see Table 6 for the derivation of the values and Table 1 for the patterns in comparison with the previous reports). The report recommended that these scoring patterns, together with a measure of digestibility, be used to assess protein quality, when the available protein in specific diets is calculated or when diets are being assessed in terms of their adequacy to match requirements.
Table 6 Amino acid scoring patterns for infants children adolescents and adults from the 2007 WHO/FAO/UNU report(9)

His, histidine; Ile, isoleucine; Leu, leucine; SAA, sulphur amino acids; AAA, aromatic amino acids, Thr, threonine, Trp, tryptophan; Val, valine
a Amino acid composition of whole-body protein(Reference Davis, Nguyen and Garcia-Bravo31).
b Adult maintenance pattern calculated from amino acid requirements per kg divided by the mean protein requirement (see Table 1).
c Calculated as average values for the age range: growth adjusted for protein utilization of 58 %.
d Sum of amino acids contained in the dietary requirement for maintenance (maintenance protein x the adult scoring pattern) and growth (tissue deposition adjusted for a 58 % dietary efficiency of utilization x the tissue pattern).
e Amino acid requirements/minimum protein requirements for the selected age groups. Note that these are the correctly calculated values and that in the published report, the value for the SAA requirement for children aged 3-10 is incorrect (18 mg/kg/d) as are the SAA patterns for infants preschool and school children up to 10, (28, 26 and 24 mg/g protein).
f pattern to be used for all school children and adolescents.
Because values for preschool children had been adopted as a scoring pattern for all ages in the 1991 report on protein quality evaluation(18) the new factorial values for both the requirements and for the scoring pattern for this age group (1–2 years) were compared with the previous values for this age group from the 1985 report. This showed that whilst the new values for the requirements were lower (average 73 % of previous values, 70 % for lysine), the new scoring pattern for this age group is closer to the 1985 scoring pattern because the new values calculated the scoring pattern with the mean protein requirement rather than the higher safe allowance employed in the 1985 report, (91 % of previous values on average, 90 % for lysine).
The comment was also made that because growth falls to ≤ 10 % of the protein requirement after the age of 2 years there is very little further change in requirement or pattern until adulthood is reached. Thus because the scoring pattern differs to only a minor extent from that of adults it is probably more practical to use just one pattern, when judging protein quality for school children and adolescents (i.e. that derived for the age group 3–10 years). These values are shown in Table 1 and highlighted in Table 6 (note that there are minor errors in the published report which have been corrected in this table).
Comments on the 2007 report
a Protein quality evaluation by the PDCAAS approach
The report endorsed the protein digestibility corrected amino acid score (PDCAAS) approach for the prediction of protein quality suggested in the 1985 report and formalized by a joint FAO/WHO Expert Consultation on protein quality evaluation(18), but highlighted that a number of conceptual and technical difficulties had not been fully resolved, as well as some errors in the 1989 report.
One important conceptual difficulty is that identified in the 1973 report, discussed above, i.e. that predicted values of the quality of proteins or dietary mixtures which may be 90-100 % for protein sources such as egg or milk do not relate to the actual utilization observed in balance trials. This is often < 50 % in adults and only approaches expected values during very rapid growth in the new born or during catch-up growth. This means that in practice prediction of protein quality can only establish relative utilization of different protein sources rather than absolute values.
Another conceptual difficulty relates to what the PDCAAS value actually means and how it is used in practice. In theory it should predict the overall efficiency of protein utilization in terms of its two components, digestibility and biological value (BV), with BV = N utilized/N absorbed, a function of its amino acid score. Thus protein utilization is first limited by digestibility, which determines available amino acid nitrogen from food, and BV describes the degree of match between the pattern of the absorbed amino acids and that of the metabolic demand. Thus BV can never exceed 1, since for any quantity of absorbed nitrogen the best that can be achieved is an exact match with requirements, allowing all amino acids to be utilized. The major use of the PDCAAS value calculated in this way would be to adjust dietary protein intakes to meet requirements, i.e.
 $$\begin{eqnarray} safe\,intake\,of\,any\,diet\quad = safe\,protein\,requirement/PDCAAS\,value\,of\,diet. \end{eqnarray}$$
In this case a PDCAAS value >1 would never be used, since this would mean that for “high quality” diets based on egg or milk for example, the safe intake of that diet would be lower than the safe requirement level though it was established with egg or milk in the first place. This point was made in the 1973 report in relation to the use of just the amino acid score to adjust intakes.
In fact, while score is determined only from IAA content (and usually only for those few amino acids that limit protein quality in practice), the metabolic demand is for both IAA and dispensable amino acids, i.e. non-essential nitrogen. Because of this, when any or all IAAs are present in excess of the demand, the absorbed mixture is unbalanced and limited by dispensable amino acids. It is assumed that these will be supplied from oxidation of surplus IAAs. If such interconversion occurs, then all of the absorbed nitrogen will be utilized in the same way as that of an absorbed mixture which exactly matches the demand (the reference pattern). On this basis it might be concluded that there can be no benefit from an amino acid score >1 with the theoretical possibility of a disadvantage if interconversion were incomplete.
The 1989 FAO report did use score values >1 but truncated the PDCAAS value to 1. This implies that a PDCAAS value can be obtained that is greater than the digestibility value, with any excess IAAs somehow making up for loss of total nitrogen during digestion and absorption. This is clearly incorrect if digestibility is first limiting. For example a soyabean concentrate with values for digestibility and amino acid scores of 95 % and 1·04 was given a PDCAAS value of 0·99. Another example was a beef-rapeseed mixture with a digestibility of 95 % and a score of 1·12 given a PDCAAS value of 1. Thus the PDCAAS value should be calculated from a truncated amino acid score to a maximum value of 1 (100 %) so that the PDCAAS value for each of these above examples should be 0·95, i.e. the digestibility value. Although the issue of truncation has remained an issue in relation to assessing the relative qualities of proteins with scores in excess of 1, it is clear that when PDCAAS values are used to adjust the intakes of the dietary mixtures to meet the safe level, the score of the mixture should not exceed 1 so that the PDCAAS value can never exceed the digestibility value. Whether there is a case for defining an index of protein quality in terms of non-truncated amino acid scores >1 for individual proteins is a separate issue but is not relevant to the process of the application of the PDCAAS method as currently established.
Another error in the 1989 report was that when calculating the amino acid score for a dietary protein mixture, especially where the digestibility of individual constituents varies, because digestibility is first limiting, the composition and consequent amino acid score of the absorbed available amino acids will reflect the relative digestibility of the individual food protein constituents. Thus the amino acid score for food mixtures should be calculated from the weighted average digestible amino acid content not from the overall amino acid profile of the dietary amino acid mixture as was done in Table 10 of 1991 report. Although the error resulting from this miscalculation is only small in this particular case, if the digestibility of individual dietary constituents varies markedly, the error could be significant.
One important unresolved and difficult problem relates to digestibility. It was recognized that whilst in practical terms, faecal digestibility is likely to remain the appropriate measure of overall nitrogen digestibility, its relative biological significance as compared to ileal digestibility has become a major issue. On the one hand there may be a lowering of actual digestibility of some amino acids below that indicated by faecal digestibility through amino acid catabolism in the colon while on the other hand colonic urea salvage and bacterial IAA biosynthesis has the potential to increase IAA availability(Reference Millward, Forrester and Ah-Sing46). Within the 2007 report's Conceptual Framework (Chapter 1), the potential difficulties of identifying meaningful measures of digestibility are highlighted and it is concluded that the concepts of both ileal digestibility and faecal digestibility are subject to important limitations under certain conditions. These conditions are most likely to apply where there is a need to determine the critical nutritional value of foods at the margins of satisfying dietary requirements, and therefore these methods cannot be used with any confidence in the development of policy options, unless the limitations of the underlying assumptions have been taken into account adequately.
b. The amino acid scoring patterns
As reviewed in the companion paper(Reference Millward8) the scoring patterns shown in Tables 1 and 6 include considerable uncertainty for several reasons. Firstly the growth component of the amino acid demand may be overestimated through use of an efficiency factor for dietary protein utilization of 58 % which is arguably too low. Secondly it is by no means clear that the values selected for the adult amino acid requirement values are minimum requirement values which relate to the minimum protein requirement which is used to calculate the reference pattern. In fact there was no specific rationale discussed in the 2007 report for using the mean rather than the safe protein requirement which had been used in all other reports. Young and colleagues had proposed using the mean protein requirement in their formulation of the MIT scoring pattern(Reference Young, Bier and Pellett28) and this influenced all subsequent discussions. It is an important issue since this approach increases the values of all amino acids by 20 % over those calculated with the safe protein allowance. While the stable isotope study values identified in the report were not identified as safe amino acid requirement values, in fact they all were obtained in studies in which the subjects were fed protein intakes much greater than the minimum protein requirement and greater than the safe intake: i.e. about 1 g/kg of an amino acid mixture based on the pattern of egg. My own view is that as shown in Fig. 2 this level of protein would have generated a metabolic demand for amino acids which would be higher than minimum values with a pattern which to some extent includes that of growth. In any case the values as reported cannot be identified as minimum values in the same way that the protein requirement is defined as the minimum value. This means that these new scoring patterns calculated with the minimum protein requirement, contain values which are at least 20 % too high and may underestimate the quality of dietary protein to meet human needs for both children and adults. One simple way to remedy this is to recalculate the scoring pattern with the safe protein allowance as was the case in the 1973 and 1985 reports. Whilst this would not remove the need for continuing research on amino acid requirements it would provide scoring patterns which conform more closely to the current best estimates of human needs. The recalculated values are shown in Table 7.
Table 7 Amino acid scoring patterns for infants children adolescents and adults calculated with the safe protein requirementa

a Values as in Table 6 except that the pattern for the maintenance amino acid requirements and the age related scoring patterns are calculated from the safe protein intake values for maintenance and growth as shown.
Conclusions
Protein quality evaluation for maintenance: accounting for adaptation
Historically protein scoring as a means of predicting net protein utilization (NPU) was adopted after it was demonstrated that it worked (more or less), in that score was closely correlated with experimentally determined NPU within a relatively simple animal model in which tissue growth dominated needs. Thus dietary amino acids provide for net protein synthesis. Indeed for animal production the accurate prediction of the protein quality of feedstuffs is of great economic importance which is why, for example, so much is known about the amino acid needs of the pig. Within human nutrition after the first year of life our understanding of amino acid requirements remains poor because the metabolic basis of these needs is complicated, poorly understood and difficult to measure. Whilst it is the case that protein synthesis constitutes the major demand for amino acids at all stages of human development most of this demand is accounted for by protein synthesis within protein turnover so that the demand is largely satisfied by amino acids recycled after proteolysis. The periodic diurnal nature of human feeding does mean that some post-prandial net protein synthesis occurs to replace post-absorptive losses so that the amino acid demand for maintenance does include some net protein synthesis in addition to metabolic consumption in other pathways. However post-prandial utilization of dietary protein must satisfy an overall demand for amino acids which is not straight forward, involving components some of which can be considered fixed, such as obligatory metabolic consumption in various biosynthetic pathways (e.g. tryptophan conversion to serotonin), and some of which are variable and adaptive, i.e. net protein deposition to balance post absorptive losses, and oxidative losses. It is evident from the body of published studies that most approaches to the measurement of amino acid needs (either with 24 h balance studies or with studies in the post prandial state) do not result in clearly identifiable endpoints in adults or in children. Also the observed post prandial utilization of amino acid limited dietary proteins such as wheat does not conform with values predicted from amino acid content of the food and tissue protein(Reference Millward, Fereday and Gibson47, Reference Millward, Fereday and Gibson48). Recent studies of the protein intakes and height growth of children in Denmark(Reference Hoppe, Udam and Lauritzen49) showing that protein intakes from milk but not from meat predicted sIGF-1 and height, raise the possibility of important aspects of amino acid needs of children which are simply not being identified in current studies of amino acid oxidation or balance. Milk contains twice the tryptophan content of meat but whether this explains these findings is unknown. This means as argued previously(Reference Millward43), that it is not only inherently difficult to identify secure amino acid requirement values which can be used to identify a scoring pattern, but amino acid scoring itself is unlikely to work very well in a predictable way.
Nevertheless a balance must be struck between what we can do with absolute confidence and a council of despair and inertia. My own view is to accept the consensus view of the amino acid requirement values identified in the new report, notwithstanding their uncertainty. However, recognizing that such values are, if not overestimates, then unarguably not proven minimum values, the scoring pattern should be calculated from the safe protein intakes, as shown in Table 7. This would enable the nutritional value of dietary proteins in terms of a PDCCAS value to be at least provisionally assessed with more confidence than with the patterns adopted in the 2007 report. Ultimately the key test of adequacy of proteins or diets must be the long-term response in terms of the specific function of interest. Such studies, of child growth for example, have been performed with QPM maize for both young South American(Reference Graham, Lembcke and Morales50) and more recently Ethiopian children(Reference Akalu, Taffesse and Gunaratna51). Only in this way can the nutritional value of the human diet be assessed with confidence.
Acknowledgements
The author declares no conflicts of interest.
The research associated with this review received no specific grant from any funding agency in the public, commercial or not-for-profit sectors.


