


INTRODUCTION
Ross River virus (RRV) (family Togaviridae, genus Alphavirus), is the most common mosquito-borne virus in Australia, with the largest burden occurring in the tropical north [Reference Knope1]. Symptoms in humans include debilitating fatigue, muscle and joint pain that persist between 3–6 months, and up to a year in some cases [Reference Westley-Wise2], leading to significant morbidity and economic loss [Reference Jacups, Whelan and Currie3]. However, 55–75% of cases are asymptomatic [Reference Harley, Sleigh and Ritchie4].
In the southeastern State of Victoria, RRV is endemic with seasonal incidence. Most cases occur during the Southern Hemisphere summer and early autumn, so reporting of arbovirus notifiable disease surveillance data typically refers to Australian financial years (1 July to 30 June the following calendar year) [Reference Knope1]. In the period July 2005–June 2010, a mean of 214 human cases were notified per year in Victoria (3·8/100 000 people per year), with the majority acquiring infection in either northern regions of the State (the Murray Valley) or southeastern coastal regions [Reference Knope1]. Outbreaks occurred in 1992/1993, 1996/1997, and more recently in 2010/2011 when 1312 cases were notified across the State (23·3/100 000 people) [5].
The epidemiology of RRV is complex with the disease maintained in wildlife reservoirs and transmitted to humans by mosquitoes, with human–mosquito–human transmission potentially occurring during epidemics [Reference Harley, Sleigh and Ritchie4]. The virus has been isolated from over 40 different mosquito species; however, only a small number are thought to be competent vectors [Reference Russell6]. The predominant mosquito vector species vary by location and season. Macropods are thought to be the major wildlife reservoir, which also vary by ecological niche. Other marsupials, rodents and flying foxes may also be involved [Reference Russell6], particularly in urban areas [Reference Harley, Sleigh and Ritchie4]. Horses can also be clinically infected [Reference El-Hage, McCluskey and Azuolas7]; however, their role in amplifying the virus is unclear.
Arboviral surveillance and intervention in Victoria
RRV is a notifiable human disease under the Public Health and Wellbeing Regulations (2009). In Victoria, doctors and/or pathology laboratories must notify all laboratory-confirmed cases to the Department of Health and Human Services (DHHS) within 5 days of diagnosis. According to the nationally agreed case definition [Reference Knope1] laboratory definitive evidence confirming a case requires either:
-
• isolation of RRV, or
-
• detection of RRV nucleic acid, or
-
• immunoglobulin G (IgG) seroconversion or a significant increase in antibody level or a ⩾fourfold rise in titre to RRV, or
-
• detection of RRV-specific IgM, in the absence of Barmah Forest virus IgM, unless RRV IgG is also detected, or
-
• detection of RRV-specific IgM in the presence of RRV IgG.
Control of arboviruses relies on early detection of increased levels of mosquitoes and/or virus activity, prompting public health interventions including vector control and public education for bite prevention [Reference van den Hurk8]. Under the Victorian Arbovirus Disease Control Program (VADCP) local governments across Victoria implement surveillance and control strategies on vector mosquito populations during the peak season between November and April each year when most human arbovirus notifications are received [Reference Lynch9]. This programme has been providing standardized adult mosquito monitoring and sentinel chicken surveillance targeted at Murray Valley encephalitis (MVE) and other endemic arboviruses since 1991 in a One Health model of collaboration. The Victorian Department of Economic Development, Jobs, Transport and Resources (DEDJTR) provides virological and entomological support to the VADCP, funded equally by the DHHS and the local governments involved, overseen by a multidisciplinary Task Force. Surveillance involves weekly mosquito trapping using carbon dioxide and light-baited traps in eight local government areas across Victoria. Mosquitoes are counted and identified by species and viral isolation is attempted in an effort to detect the presence of RRV.
Before and during each peak season for arboviral activity, the VADCP analyses three broad environmental indicators [Reference Lynch9–Reference Nicholls11] of conditions suitable for increased MVE virus activity in southeastern Australia. Meteorological data [rainfall in the catchment basins of the four main river systems in eastern Australia and proxy measures for the Southern Oscillation Index (SOI) and La Niña events] are considered by DHHS and councils to inform of likely disease occurrence and when to instigate interventions. No models are currently available to combine these data for RRV prediction, with public health interventions being informed by routine notifiable disease surveillance and mosquito monitoring through the VADCP.
Modelling and prediction
Due to the climatic dependence of wildlife and mosquito populations, models using climate and/or entomological variables to predict RRV incidence may be helpful for informing disease control activities and forecasting the impact of climate change. A detailed review [Reference Jacups, Whelan and Currie3] describes previous models for RRV. Most predictive models for RRV have used logistic regression to estimate the odds or probability of an outbreak within a season, using seasonal variables at fixed points in time [Reference Bi12–Reference Woodruff16]. Others have explored prediction of disease using time-series analysis techniques [Reference Bi12], such as seasonal autoregressive integrated moving average and polynomial distributed lag (PDL) time-series models [Reference Hu17], and also negative binomial regression [Reference Werner18], to predict rates of disease, rather than simply whether or not an outbreak might occur in a season. Models tailored to conditions at the local level have tended to have better predictive capacity than broader geographical models [Reference Woodruff13]. All previous models based on RRV surveillance data for southern Australia have estimated associations with annual case counts, with only two incorporating both entomological and climatic variables (for the southwestern region of Western Australia [Reference Woodruff13] and southern South Australia [Reference Williams, Fricker and Kokkinn15]). None of the models for RRV in southern Australia have attempted to model monthly counts and none have explicitly undertaken out-of-sample validation (forecasting); however, their outputs have informed surveillance and control activities.
Models combining mosquito count and climate data have produced better results than models considering climatic variables alone [Reference Woodruff13, Reference Hu17]. For example, Woodruff et al. [Reference Woodruff13] developed early and late warning models for RRV outbreak years in 14 statistical local areas of Western Australia and found climate data alone had 64% sensitivity for an early warning model, and the addition of mosquito surveillance data increased the sensitivity to 85%. Previous models for predicting RRV in Victoria [Reference Woodruff16] have used only climatic data at one time point per season (total rainfall in July, maximum temperature in November) to estimate the probability of an outbreak during peak transmission season for two adjacent areas in the Murray Valley, achieving in-sample sensitivity (internal ‘rotational’ validation) of between 64% and 96% for predicting an outbreak season.
The aim of this analysis was to develop predictive models for monthly counts of human RRV notifications in a highly affected inland location. Specific objectives included estimating the association between notified case counts and explanatory climatic, environmental and entomological variables, evaluating the usefulness of mosquito count data for informing public health interventions by estimating trigger points for action and, last, developing a forecasting tool.
METHODS
Data
Mildura Local Government Area (LGA), located inland in northwest Victoria (Fig. 1) was selected for this analysis as it has the highest RRV disease burden in the State. RRV notifiable disease surveillance data for the period July 2000–June 2015 were provided by the DHHS including the following variables: estimated date of onset, 5-year age groups, sex and residential address (or exposure address where ascertained at interview by health officials). These data were geocoded utilizing the Google Maps® application programming interface, aggregated by month of onset and divided by annual Australian Bureau of Statistics estimates of the resident LGA population.
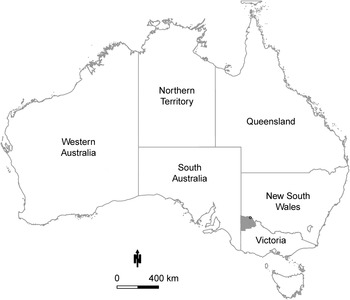
Fig. 1. Study extent of predictive modelling of Ross River virus cases in the Mildura Local Government Area (LGA) (shaded grey), Victoria, Australia, for the period 1 July 2000 to 30 June 2015. The black circle represents the location of the Mildura airport weather station. The Murray River forms the northern border of the Mildura LGA.
Weekly mosquito trapping count data were provided by DEDJTR for the same time period, for four traps in the Mildura LGA. Six species of interest were investigated for predictive value, including two thought to play a major role in Victoria in RRV transmission [Reference Harley, Sleigh and Ritchie4] (Aedes camptorhynchus and Culex annulirostris), two mosquito species with possible roles in transmission (Ae. notoscriptus, Coquillettidia linealis) and two further species with unknown importance for RRV transmission (Cx. australicus, a vector of MVE, and Cx. globicoxitus). Mosquitoes are only counted during November–April each year. The median, mean and maximum counts across the four traps located in the Mildura LGA were calculated each month and categorized as follows for each species: ‘no mosquitoes trapped’ (the reference category), ‘1–9 mosquitoes’, ‘10–99 mosquitoes’, ‘100–999 mosquitoes’, and ‘⩾1000 mosquitoes’.
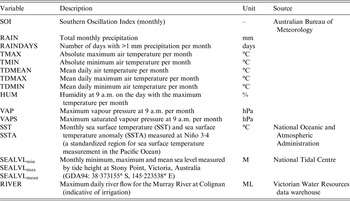
Climatic and environmental variables were selected following a review of previous models, and are summarized by source in Table 1. Weather station data were obtained from the Australian Bureau of Meteorology weather station with the most complete data in Mildura LGA (Mildura airport; Bureau of Meteorology Station no.: 076031; geo-coordinates 142·0867° E, −34·2358° S, see Fig. 1).
Table 1. Climatic and environmental variables tested as predictors in models of monthly Ross River virus notifications for the Mildura Local Government Area, Victoria, Australia
Descriptive and univariable statistical analyses
The distribution of each variable was examined and described, using contingency tables for categorical variables, collapsing categories where appropriate. Summary statistics and histograms were inspected for continuous variables and these transformed as required.
Data for the period July 2000–June 2011 were used to train the model. Owing to overdispersion, negative binomial regression models were constructed to predict the monthly count of notified RRV cases each month for Mildura LGA (y), of the form:
 $$Y\, \sim \,{\rm Poisson(mu{^\ast}),}$$
 $$\ln ({\rm mu}{^\ast})\, = \,\beta _0 \, + \,\beta _1 x_1 \, + \,\beta _2 x_2 \, +... \, + \beta _p x_p \, + \,v,$$
 $$\exp (v) \sim \,{\rm Gamma}\,\Bigg(\displaystyle{1 \over {{ \alpha}}},{\alpha \Bigg),}$$
where the p predictor variables x 1, x 2 , …, x p are given, and the population regression coefficients β 0, β 1, …, β p are estimated, applying a dispersion parameter (α) to represent the ratio of the variance of the expected counts to their mean. The dispersion parameter affects the variance of the expected counts, not the expected counts themselves. Exponentiation allows expression of the coefficients as incidence rate ratios (IRRs).
Climatic and entomological variables were lagged by 1–12 months and screened for entry into multivariable modelling. For each putative predictor variable, the lag with the strongest statistical association was selected using Akaike's Information Criterion (AIC) [Reference Akaike19] – as this criterion may be applied to non-nested models – and entered into multivariable models if they were crudely statistically associated with RRV case count based on a liberal P value threshold (P < 0·25). The linearity of the univariable relationship with the outcome variable was assessed graphically for each continuous variable and by comparing the AIC of univariable models including a linear term vs. those with the variable categorized into quintiles. Where appropriate categorized variables were retained for further analyses and category levels collapsed.
All continuous covariates were tested for collinearity in pairs by calculating Spearman's correlation coefficient (ρ s ). Among pairs of highly correlated predictors (ρ s ⩾ 0·70), only the variable with the strongest statistical association with the outcome was retained for further analysis [Reference Armitage, Berry and Matthews20].
Multivariable analyses
Multivariable models were constructed including all retained variables and trimmed for parsimony using manual backwards-stepwise regression to P < 0·20.
Each removed variable was re-entered individually into the preliminary main effects model and retained if P < 0·15. At this point, pairwise interactions were tested among all retained terms, categorizing continuous variables as required, and the model was reconstructed as a generalized linear model to implement regression diagnostics (deviance-based goodness-of-fit to the training data, assessment of residuals, influence and leverage). Maximum likelihood R 2 was used as a robust measure of fit (no universally accepted adjusted R 2 measure is available for negative binomial models [Reference Grimshaw21]). The final ‘estimation’ model was checked for serial autocorrelation (AC) by including case counts in immediately preceding months [Reference Dohoo, Martin and Stryhn22] after testing for non-stationarity and trend in the time-series following the Dickey–Fuller (DF) approach [Reference Dickey and Fuller23].
Prediction, validation and adjustment for overfitting
The final estimation model was used to predict monthly notified human RRV case counts notified in each month in the 4-year validation dataset (July 2011–June 2015) for Mildura LGA, and 95% prediction intervals (PIs) were estimated adapting the method of Farrington et al. [Reference Farrington24] to the negative binomial distribution. External (‘out-of-sample’) forecasts and their 95% PIs were then compared to observed data (not used in model development) using Pearson's correlation coefficient (ρ p ) [Reference Axelsen25], and models were tested for their proportional agreement with subjectively defined ‘outbreak alerts’ (months with >2 notified cases and where the count of cases exceeded the 5-year mean plus 1 s.d. for that month estimated excluding known outbreak years, i.e. 2010/2011, assuming a negative binomial distribution) [Reference Yohannes26]. The final estimation model was pruned to account for overfitting by removing variables sequentially, and the comparisons repeated, to arrive at the final ‘prediction’ model, selected based on its forecasting ability.
Analyses were undertaken using Stata v. 14.0 (StataCorp., USA) and the R statistical package v. 3.1.1 [27] using the libraries ‘MASS’ [Reference Venables and Ripley28] and ‘epiR’ [Reference Stevenson29].
RESULTS
There were 479 notified cases of RRV in Mildura LGA during the study period. The outbreak during the 2010/2011 financial year accounted for 251 notifications (52·4%) (Fig. 2). The mean notification rate (excluding 2010/2011) was 63·9/100 000 person years (32·6/100 000). Cases were notified year-round however 87% had estimated dates of onset between November and April. There were 31 outbreak alerts in the study period, six of these in 2010/2011 and 16 in the model validation period.
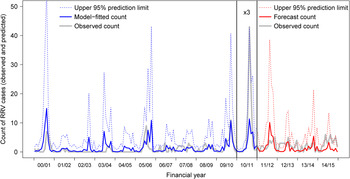
Fig. 2. Monthly time-series, predictions and forecasts of notified Ross River virus cases in the Mildura Local Government Area, Victoria, Australia, for the period 1 July 2000 to 30 June 2015. Data for the Australian financial year 2010/2011 have been rescaled by a factor of 3. Dotted lines represent upper 95% prediction intervals.
Among those species investigated, the predominant mosquito species trapped in Mildura LGA during the study period were Cx. annulirostris (n = 142 638), Ae. camptorhynchus (n = 24 349), Cx. australicus (n = 6768) and Coquillettidia linealis (n = 5249). Univariable associations between RRV incidence in Mildura LGA and lagged counts of the mosquito species and climatic and environmental variables are provided in Supplementary Tables S1 and S2).
The final estimation model for Mildura LGA is presented in Table 2. A doubling of maximum vapour pressure was associated with a 3·5-fold rise in the rate of notifications in the following month (IRR 3·47, 95% CI 1·57–7·66). Mean trap counts of Cx. annulirostris ⩾1000 were associated with a sevenfold increase in the rate of RRV notifications in the following month. When the mean Ae. camptorhynchus count was ⩾10, RRV notifications 2 months later were increased 55%. A doubling of precipitation and more rain days, were associated with 25% and 8% rises in RRV notifications, 4 and 6 months later, respectively. Two interaction terms were retained in the final model. The main effect of Murray River flows in the highest quintile (maximum daily flow in a month ⩾16 268 ML) was an 85% reduction in RRV notifications 3 months later (IRR 0·15, 95% CI 0·03–0·81), whereas when the SOI (measured 6 months prior) was greater than its median across the study period (⩾1·7 units) Murray River flows in the highest quintile were associated with a 5·7-fold increase in the rate of RRV notifications 3 months later. The main effect of Pacific Ocean sea surface temperatures ⩾26·8 °C was a 68% reduction in notifications 2 months later, whereas when minimum monthly sea levels (measured 7 months prior) were ⩾13·2 cm and sea surface temperatures ⩾26·8 °C were associated with a fourfold rise in RRV notifications 2 months later.
Table 2. Final negative binomial regression (‘estimation’) model for monthly Ross River virus notifications in the Mildura Local Government Area, Victoria, Australia, July 2000–June 2011
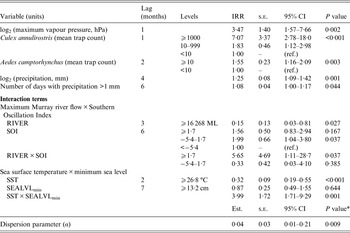
IRR, Incidence rate ratio; s.e., standard error of IRR or dispersion parameter; CI, confidence interval.; Est., point estimate of dispersion parameter.
AIC = 318·564, n = 132, degrees of freedom = 16, log likelihood (model = −143·282; null model = –226·598), maximum likelihood R 2 = 0·717, deviance-based goodness-of-fit (P = 0·50).
* P value for dispersion parameter estimated using a likelihood ratio test that α is non-zero.
There was no long-term trend in the time-series (P = 0·14) and the null hypothesis of non-stationary was rejected (DF test statistic = −5·856, d.f. = 132, P < 0·001). Moderate serial AC was detected (lag 1, AC = 0·61) with each case 1 month prior being associated with a 12% increase in RRV incidence the following month (IRR 1·12, 95% CI 1·05–1·19). An AC term was included then eliminated (owing to P > 0·20) from the final estimation model.
Forecast ability of the model was improved by pruning to the final forecasting model (presented in Table 3 with a comparison of observed data and forecasts). Total observed annual counts were within forecast prediction intervals in all four validation years (Fig. 2), and at a monthly resolution observed counts were within the forecast prediction intervals in 39 of 48 months in the validation period (81%), compared to 129 of 132 months in the model training period (98%). In two of the validation years (2011/2012 and 2013/2014) there was excellent agreement between forecast and observed case counts and outbreak alerts, proportional agreement of 0·92 and 0·83, respectively. The model under-predicted case counts in 2012/2013 and 2014/2015, all 9 months with observed counts above the forecast prediction interval occurred in these two years, resulting in poorer proportional agreement (0·50 in both cases) with observed outbreak alerts in these two years.
Table 3. Final negative binomial regression (‘forecasting’) model for monthly Ross River virus notifications in the Mildura local government area, Victoria, Australia. Trained on data for the period July 2000–June 2011, validated on data for the period July 2012–June 2015
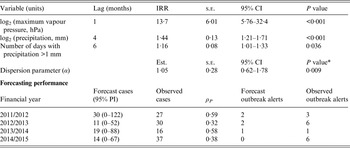
IRR, Incidence rate ratio; s.e., standard error of IRR; CI, confidence interval; PI, prediction interval; ρ P , Pearson's correlation coefficient.
AIC = 367·6142, n = 132, degrees of freedom = 5, log likelihood (model = −178·807; null model = −226·598), maximum likelihood R 2 = 0·515, deviance-based goodness-of-fit (P = 0·81).
* P value for dispersion parameter estimated using a likelihood ratio test that α is non-zero.
DISCUSSION
Climate, environmental and entomological variables were used to develop prediction models for monthly RRV incidence rates for the Victorian inland LGA with the highest notification rates. To our knowledge, this study was the first to integrate mosquito count data into Victorian RRV predictive modelling and the first to attempt out-of-sample forecasting of monthly counts of RRV for a location in southern Australia.
The most robust way to assess predictive model accuracy is to review a graphical representation of observed vs. predicted events using external data [Reference Moons30], as adopted for assessing the current models. The final forecasting model performed extremely well at tracking the observed counts in the validation period, and clearly fit the data well (differentiating between the outbreak year 2010/2011 and other years with relatively low counts). Forecast prediction intervals encompassed the observed monthly counts in 39 of 48 months in the validation period. Of the 9 months with observed counts falling above the predicted interval, five in 2012/2013 and two in 2014/2015 had very low notified case counts (⩽4) and raised outbreak alerts merely on the basis that these low counts were well outside the typical RRV activity season (when typically ⩽1 case was observed in most other years). The subjectively defined outbreak alert threshold is likely to be oversensitive, so direct comparisons can only be interpreted with caution. Raising the alert threshold to >2 s.d. than the long-term mean did not resolve the issue, as such a threshold was largely insensitive at detecting months that appeared to be clearly in excess of normal.
Statistical epidemiological modelling is often applied to address questions of causality (estimation and hypothesis testing) with fewer examples where the explicitly stated aim is modelling for prediction of future observations [Reference Dohoo, Martin and Stryhn22]. When forecasting (predicting into the ‘out-of-sample’ future), a modified approach may be required, as was the case in this study, reducing the focus on the relationships between individual variables. While model fit remains important there is a trade-off, external validity is paramount (models constructed based on historical data must hold into the near future) and overfitting to training data may well come at the expense of robust future prediction [Reference Dohoo, Martin and Stryhn22]. For this reason the final ‘estimating’ model, used for assessing the relationships between variables, was pruned to produce a more parsimonious ‘forecasting’ model.
Other models of RRV in southern Australia have been restricted to providing early warning of outbreak years, rather than attempting to forecast monthly counts. As presented, the forecasting model will be utilized each year to provide forecasts to the DHHS. Further modelling will be required to refine the variable selection and improve the robustness of forecasts. Other more complex approaches may be required [Reference Axelsen25], perhaps following the PDL modelling approach that Hu et al. [Reference Hu17] implemented for Brisbane, Queensland.
Rainfall and vapour pressure were key factors for forecasting RRV notifications in Mildura LGA. Rainfall has been included as an important predictor in all previous RRV models for southern Australia [Reference Bi12, Reference Woodruff13, Reference Williams, Fricker and Kokkinn15, Reference Woodruff16], and underlies one of the broad early warning indicators [Reference Forbes10] considered by DHHS for years of increased MVE activity. Vapour pressure is a measure of air humidity that depends on temperature and air pressure, similar variables have been included in all previous prediction models [Reference Bi12, Reference Williams, Fricker and Kokkinn15, Reference Woodruff16] developed for regions along the Murray River (that forms a natural border between the states of Victoria and New South Wales). It is biologically plausible that these variables are related to arbovirus transmission, as mosquitoes require a minimum temperature and moisture for breeding. The lags of these variables likely reflect effects of water, temperature and climatic conditions on local ecology, for example through their effects on vegetation and wildlife reservoir host populations along with their direct effect on mosquito populations. While it is difficult to identify causal links between distally lagged precipitation variables and the timescales of vector development and transmission of RRV, the main purpose of the models developed here was as predictive tools rather than to draw explicit conclusions regarding causation. Including rainfall parameters with lags between 4 and 6 months provided the model with the best predictive performance at a monthly resolution. When we evaluated rainfall variables over lags of 1–3 months (in univariable analysis), very similar estimates were obtained as those included in the final model (for total monthly precipitation lagged 4 months, and number of days with >1 mm rainfall lagged 6 months). There were only low levels of temporal AC observed between these variables, so these were included in multivariable estimation and prediction models at shorter lags (as secondary effects of rainfall over different time-scales). However, these variables representing shorter lags of rainfall were subsequently eliminated. Owing to weak correlations between climatic variables (rainfall, vapour pressure, humidity and temperature) in our data, it is also likely that some of the proximal effect of rainfall is represented by other variables in the final models.
Cx. annulirostris and Ae. camptorhynchus are the two major mosquito vectors for RRV in Victoria [Reference Harley, Sleigh and Ritchie4]. Their inclusion in the final estimation model at proximal lags is consistent with their role in transmitting virus to humans from wildlife reservoirs and the time taken for mosquitoes to develop, the ~2 week extrinsic and 1- to 2-week intrinsic incubation periods of RRV [Reference Hu17]. The univariable associations presented in Supplementary Table S1 represent useful trigger points for action by the local council (such as mosquito larvicidal treatments and public announcements about the risk and appropriate preventative actions). Risk of RRV is likely to be greatly increased in months subsequent to those when mean weekly trap counts of Cx. annulirostris and Ae. camptorhynchus exceed 100 and 10 mosquitoes, respectively. Contrary to the findings of previous modelling studies of RRV notifications in other Australian states [Reference Woodruff13, Reference Hu17], we found that inclusion of variables representing mosquito numbers provided no improvement in model forecasting ability (although strongly statistically significant associations were observed between lagged mosquito count variables and RRV notifications in the final estimation model). Hu et al. [Reference Hu17] noted the limitations of including mosquito count data in early warning forecasting models (cost of collection and proximal lags limiting the extent of early warning).
Two interesting interactions were present in the final estimation model, both of which appear indicative of periods of extreme climatic conditions. Elevated SOI (i.e. a La Niña event) 6 months earlier and maximum Murray River flow 3 months prior were associated with increased rates of notification for RRV. A severe flooding event affecting the Murray River valley occurred in the 2010/2011 outbreak year. Interestingly, on its own, high maximum Murray River flows (indicative of low amounts of irrigation) were associated with substantially decreased rates of RRV notification.
Weather patterns in the study region are heavily influenced by the development and intensity of El Niño/La Niña events in the Pacific Ocean [31]. Across eastern Australia, El Niño events are often associated with drier than normal conditions while La Niña events are associated with wetter than normal conditions. Lower sea surface temperatures in the Niño 3·4 region (SST) are an indicator of La Niña events and in this analyses were associated with increased rates of RRV notification, which is biologically plausible as wetter conditions favour mosquito larval development. Sea surface temperature was considered as a potential model covariate, even for this inland study area, as it was identified by Woodruff et al. [Reference Woodruff16] as a predictor in their model of RRV for the Murray region in Victoria, and for its role in the El Niño Southern Oscillation phenomenon that influences weather patterns across Australia.
Of interest, another biologically plausible and statistically significant interaction was detected, between SST and sea levels (when both were increased, rates of notification of RRV cases were also likely to be increased). Sea-level changes are driven by complex processes including thermal expansion of water, input of water into the ocean from glaciers and ice sheets, and changed water storage on land [Reference Rahmstorf32]. Variables representing sea level were considered for inclusion in these models because sea levels are correlated with SST and the SOI [Reference Lombard33]. Again, this interaction term may indicate periods of extreme climatic conditions, with extremes in sea levels and sea surface temperature being a feature of cyclones (as experienced in the 2010/2011 outbreak year when cyclones in Queensland caused major flooding in the Murray–Darling river basin immediately preceding extremely high arbovirus activity). The DHHS utilizes another sea surface temperature measure, the Indian Ocean Dipole (IOD), which is based on the difference between sea surface temperature in the western and eastern tropical Indian Ocean, as a predictor for MVE virus activity in southeastern Australia [Reference Lynch9]. Negative IOD events generally coincide with La Niña events.
The study was subject to a number of limitations: notification data may be undoubtedly understated and biased toward cases with typical clinical symptoms – those with less severe illness may not seek medical help or may be misdiagnosed. For this reason model outputs are interpreted as notification rates (rather than incidence rates). Residential location was accepted as a proxy for place of infection as this information was not available for a majority of cases. Misclassification of place of infection for some cases may have altered the measured associations between model covariates and disease, thus reducing predictive accuracy. The model did not account for mosquito control activities, as a reliable, consistent measure of these activities was unavailable. It is likely this omission has reduced the predictive accuracy of the models and ideally these should be accounted for in future research. Despite these limitations, the model presented appears a useful forecasting tool for RRV in region investigated with 81% of observed monthly counts in the validation period falling within forecast prediction intervals.
Changing climatic conditions over the coming decades are likely to alter the current patterns of arboviral disease in Australia [Reference Jacups, Whelan and Currie3, Reference Woodruff, Bambrisk and Garnaut34], although the nature of this change is controversial [Reference Russell35]. The effect on arbovirus transmission is likely to vary regionally. For example, the impact will differ in arid compared to temperate, and coastal versus inland regions, reflecting variation in the effect of climate change on local ecological conditions [Reference Woodruff, Bambrisk and Garnaut34]. Advanced tools, such as the models presented here, will be required to monitoring the changing relationship between notified cases and local conditions, and to provide early warning of periods of high arbovirus activity.
SUPPLEMENTARY MATERIAL
For supplementary material accompanying this paper visit https://doi.org/10.1017/S0950268816002594.
ACKNOWLEDGEMENTS
The authors gratefully acknowledge the following for preparing and providing data necessary for these analyses: the Victorian Government Department of Health and Human Services (particularly Nicola Stephens, Rebecca Feldman and Katherine Gibney), and the Department of Economic Development, Jobs, Transport and Resources (particularly Karen Brown, Joe Azuolas, Kim Andrews and Elwyn Wishart), the Mildura Rural City Council (Dale Hutchinson and Stuart Maher), the Victorian Arbovirus Taskforce and the Australian Bureau of Meteorology's National Climate Data Service. Human notifiable surveillance data was provided by the Department of Health and Human Services in accordance with its privacy act after ethical approval for all procedures used in this study was obtained from the Human Research Ethics Committee of the University of Melbourne (1339794).
This research received no specific grant from any funding agency, commercial or not-for-profit sectors. Dr Simon Firestone is supported by an Australian Research Council Discovery Early Career Researcher Award (project number DE160100477).
DECLARATION OF INTEREST
None.


