


Introduction
Nuclear fuels operate under extreme temperature, pressure, and radiation conditions. In such environments, it is important that the fuels maintain their thermal and mechanical properties, exhibit dimensional stability, and maintain integrity of the fuel-cladding system, critical to which is the fission gas transport and release to the fuel rod plenum [Reference Turnbull and Tucker1]. Ceramic UO2 is the conventional nuclear fuel used in modern nuclear reactors. Microstructure of ceramic fuels is inherently polycrystalline and typically with ≤ 5% porosity [Reference Nichols2], where the length scales of both the grains and pores have heterogeneous spatial distributions within the fuel rod. These heterogeneities can result in anisotropic responses of the fuels when subjected to operating conditions.
One of the microstructural features that has an obvious effect on fuel properties and has been extensively studied is the grain size. It is found that grain size has a major influence on fission gas release and fuel swelling rates [Reference Khoruzhii3]. At the interfaces of distinct grains, open channels exist, where the diffusion coefficients of fission products drastically change from that in the bulk of the grain, resulting in increased transport and release rates. Thus, increasing the grain size both increases the diffusion distance from interior-to-boundary and decreases the overall interfacial area, reducing release rates at grain boundaries. This makes fuel microstructure consisting of large grains preferable [Reference Khoruzhii3–Reference Campbell5].
The microstructure of ceramic nuclear fuel, both fresh and post-irradiation, has traditionally been studied with light and electron microscopy techniques [Reference Liu6, Reference Nerikar7, Reference Rudman8]. However, these techniques are inherently destructive, making it impossible to perform evolutionary studies of the microstructure of a specific sample. In contrast, high-energy synchrotron X-rays have the capability to non-destructively probe bulk microstructures [Reference Poulsen9, Reference Suter10] and provide information on crystal orientations, elastic strains, phase densities, and their evolution in polycrystalline metals [Reference Pokharel11–Reference Hefferan14]. These methods were recently demonstrated on ceramic samples of high-Z materials [Reference Brown15]. Furthermore, complementary pulsed neutron based imaging techniques are being developed that can non-destructively characterize ceramic and metallic nuclear fuel-cladding systems before and after irradiation [Reference Vogel16].
In the present work, we probed the three-dimensional (3D) bulk microstructures of three as-sintered UO2+x samples with varying O/U ratios (2+x) using near-field high-energy X-ray diffraction microscopy (nf-HEDM) and micro-computed tomography (μ-CT) techniques, obtaining non-destructive 3D volumetric measurements and spatially resolved orientation and density reconstructions at unprecedented resolution (~s3 μm, 0.1 deg). Oxygen-rich, hyper-stoichiometric UO2+x was expected to sinter faster, resulting in higher-density fuel. In addition, hyper-stoichiometric samples showed higher rate of grain growth for the same sintering conditions. The motivation was to study the effect of oxygen content on sintering microstructure (mainly grain size and porosity) using non-destructive techniques and to demonstrate the kind of information that can be extracted from probing high-Z materials with the intent of providing 3D microstructure data to the modeling community in general, where such data are currently lacking.
Materials and Methods
Sample preparation
For this study, UO2+x fuel pellets, where x is the degree of hyper-stoichiometry, were fabricated from powders with varying stoichiometry. The samples were prepared from an as-received AREVA depleted UO2 powder with an oxygen/metal (O/M) ratio of 2.16. The powder feedstock was milled in a zirconia spex mill jar with one .375 mm zirconia ball for 15 minutes followed by sieving. The powder was then pressed at 40 MPa in a 5.7 mm dual-action custom punch and die set. The pellet was sintered in a gettered argon atmosphere at 1450°C for 4 hrs. The sintered density of the pellet was approximately 10.19 g/cc (~93% theoretical density), and a calculated O/M of 2.04 was based on mass losses during sintering. Then a witness sample and the fuel pellet were put in a thermogravimetric analyzer (TGA) connected to a gas mixing system to achieve a specific oxygen partial pressure to obtain the desired O/M ratio for each sample. The witness sample was then reduced in the TGA using the ASTM C1430-07 standard to confirm the final attained O/M of each stoichiometric adjustment to the pellets. Each pellet was then cut using a slow-speed diamond saw and polished using a 30 μm diamond film with water as a lubricant to the final sample dimensions, nominally 0.5 × 0.5 × 1 mm. The final compositions and initial processing conditions of the three samples are summarized in Table 1, including sintering temperature, time, and resulting bulk density.
Table 1 Initial state of the bulk as-sintered samples.

High-energy X-ray techniques
Analysis of the specimens was performed at the advanced photon source (APS) 1-ID-B beam line, where the sample was illuminated with high-energy (85 keV) X-rays. To ensure that data from all of the grains in the illuminated section was captured, the sample was rotated about a vertical axis, perpendicular to the incident beam, and diffraction patterns were collected at 1-degree integration intervals. 3D data were collected by translating the sample in vertical steps of 4 μm, with 2D diffraction data collected for each slice. Tomography data were collected on the near-field detector by removing the focusing optics and increasing the beam height to cover 500 μm in the vertical direction.
The diffraction data obtained from the near-field detector was analyzed using IceNine software [Reference Li17], which uses the forward model method (FMM) to obtain orientation field maps in both two and three dimensions [Reference Suter10,Reference Li and Suter18]. Simulated diffraction is compared with the measured diffraction pattern; the ratio of overlap between simulated and measured diffraction is given by the confidence index of the fitted microstructure. Since the measurements were performed in a layer-by-layer basis, the fitted layers were stacked in the vertical direction to obtain a 3D volume. Tomographic reconstruction to obtain the density maps was performed using RECON software, developed at LANL [Reference Hunter19].
Results
3D microstructure characterization
Initial states of the samples were characterized using nf-HEDM and μ-CT techniques. Crystallographic orientation field information was obtained from the nf-HEDM method, where for each sample, 10 layers were measured approximately spanning a 0.35 × 0.35 × 0.04 mm3 volume with an in-plane resolution of ~3.0 μm and an out of plane resolution of 4 μm. The results are shown in Figure 1, where colors correspond to specific crystal orientations and clusters of similar orientations represent a single grain. The sintering process resulted in UO2+x pellets that were not 100% dense, as noted in Table 1, which can be seen as white spaces in the 2D orientation field maps. Visually, the orientation maps show large variability in grain sizes between the stoichiometric and hyper-stoichiometric microstructures.
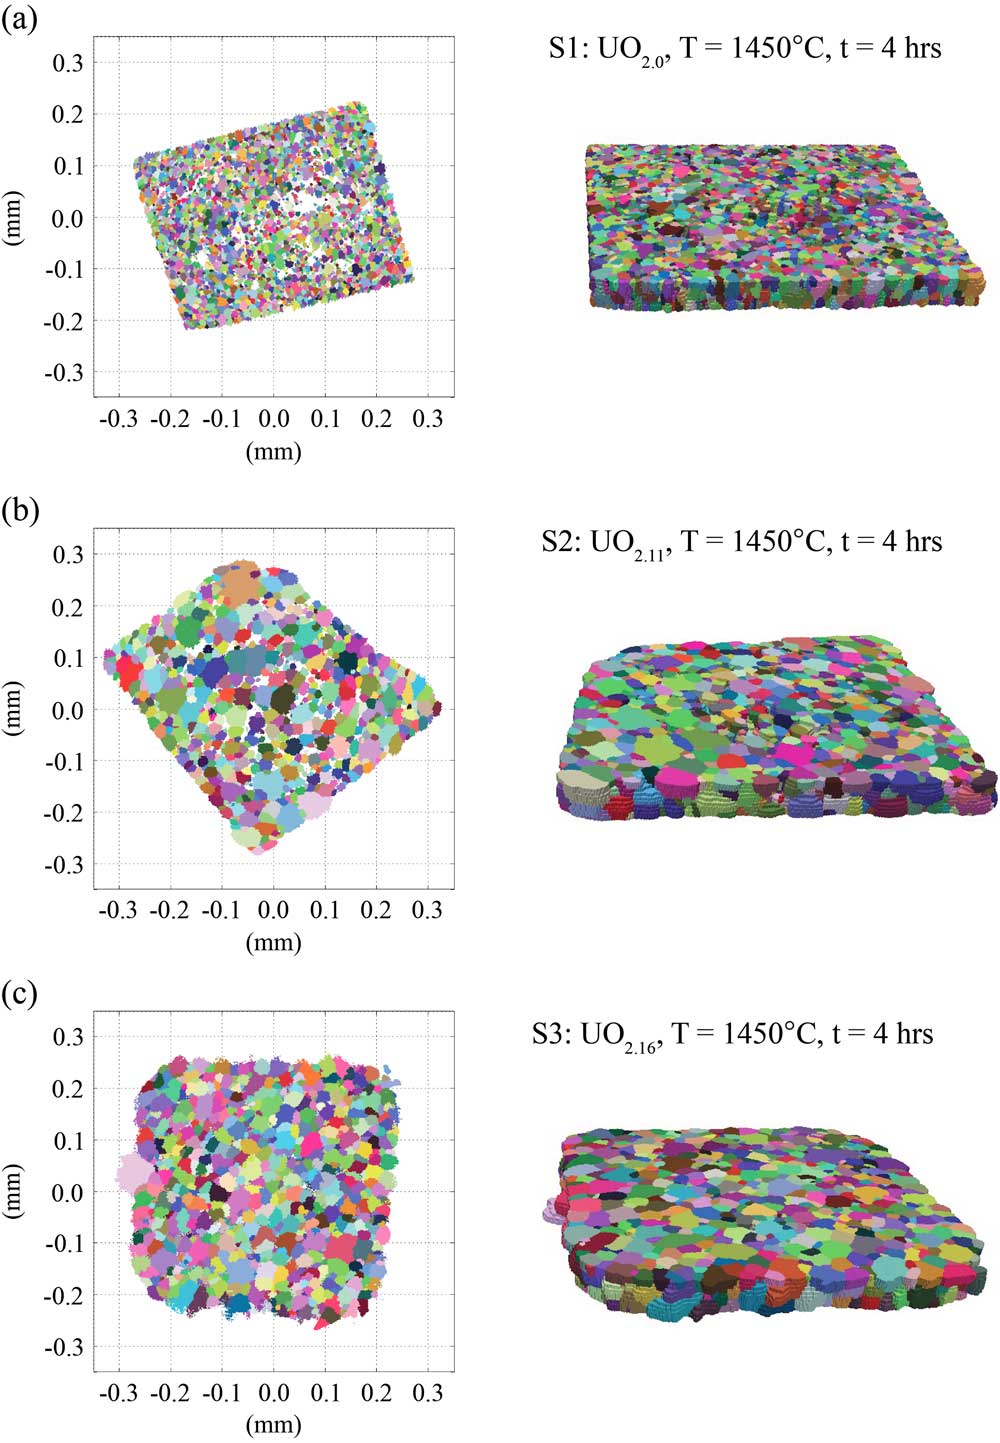
Figure 1 Measurements of 3D microstructures of UO2 pellets with varying oxygen content and sintering temperatures for samples (a) S1, (b) S2, and (c) S3. Left: a single layer in which white areas indicate void locations. Right: entire 3D volumes for S1, S2, and S3. Note that the sample sizes are not all the same.
The μ-CT measurements were performed on all three samples to obtain density maps. Figure 2 illustrates both single slice and volumetric density maps, which further confirms the presence of interior pores. The color bar represents pore volume. Isolated pores as well as clusters of large voids are obvious from these density maps, indicating heterogeneous porosity distribution. However, the limited quality of the absorption data restricted us from extracting reliable statistics from the reconstructed 3D volumes.
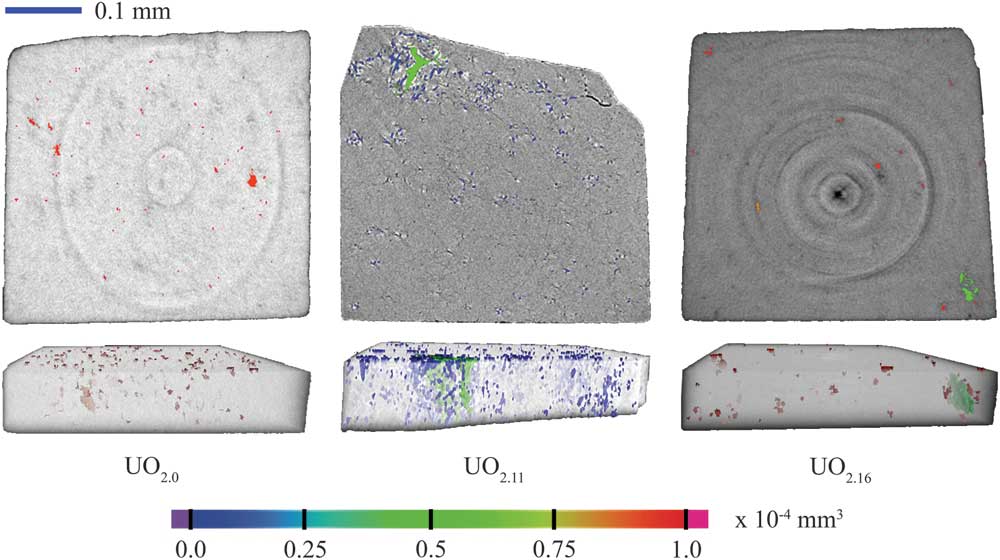
Figure 2 Volumetric density maps of UO2+x fuel pellets showing that porosity decreased as the stoichiometric ratio changed from UO2.0 to UO2.16.
For this study, relative porosity statistics were estimated using the microstructure maps shown in Figure 1. Elements that were not indexed by the FMM software were regarded as pores. Note that limitations in the diffraction data can result in counting voxels belonging to either grain boundaries or small grains as pores. Therefore, the porosity content estimated from orientation maps would inherently be larger than the actual value, except that it ignores pores that are smaller than 3 µm, which can add up to being a significant amount. Regardless, it provides a quantitative comparison relative to individual samples.
Table 2 gives the approximate porosity present in each of the three measured samples, which are in close accord with the estimated bulk density. For S3, the estimated porosity deviates largely from that of the bulk measurements. This could be because of homogeneously distributed smaller pores, which are below the resolution limit of HEDM measurements. This assumption is further justified by the tomography map, which shows smaller pore sizes randomly distributed throughout the S3 sample. On the other hand, S2, which has smaller porosity compared to S3, shows good agreement with bulk measurements. This could be because of the presence of large voids in the sample, some of which can be seen on the tomographic images that have slightly higher resolution than the nf-HEDM maps.
Table 2 Estimated porosity from measured microstructures, where a voxel below 0.25 confidence index is considered as unindexed.
Grain-size distribution
Individual grains were segmented from the nf-HEDM orientation map, and grain size was given by sphere-equivalent diameter. Figure 3 shows a quantitative comparison of grain size distributions extracted from the three measured microstructures. Individual colored markers represent the binned grain sizes for each distribution, and the solid curve is a Gaussian distribution fit to the experimental data. The statistical parameters obtained from the fit are summarized in Table 3. First-order moments were calculated from each fit shown in Figure 3.
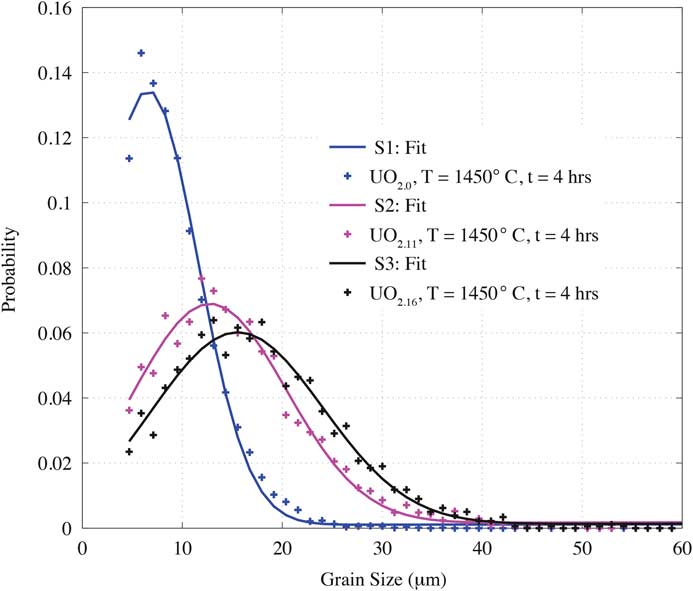
Figure 3 Probability distributions of grain size for the three UO2+x samples where solid line indicates a fit to each measured distribution.
Table 3 Statistics from grain-size distributions. Note the error corresponds to the difference between the measured and the fitted distributions.

Specimens S1, S2, and S3 exhibit significant differences in grain-size distributions, despite being created under the same sintering conditions. Assuming similar volume measurements, the stoichiometric sample has more than three times as many grains as either of the two hyper-stoichiometric samples. The total grain numbers for S1, S2, and S3 were 7798, 2164, and 1828, with average grain size of 6.6 μm, 12.7 μm, and 15.4 μm, respectively. Average grain size increased as a function of x, and with increasing x the distributions seemed to have broadened as suggested by the standard deviations 4.6 μm, 7.1 μm, and 7.9 μm for S1, S2, and S3, respectively.
Misorientation distribution
From the measured microstructures, a preference for a specific boundary type after sintering is quantified by calculating grain-boundary misorientation between two adjacent grain boundary voxels. The grain-boundary misorientation distributions are shown in Figure 4 for the three measured samples. Besides a small perturbation in the form of random noise, in general all of the distributions resemble a Mackenzie distribution [Reference Mackenzie20], indicating random texture or no preference for any particular boundary orientations at this stage.
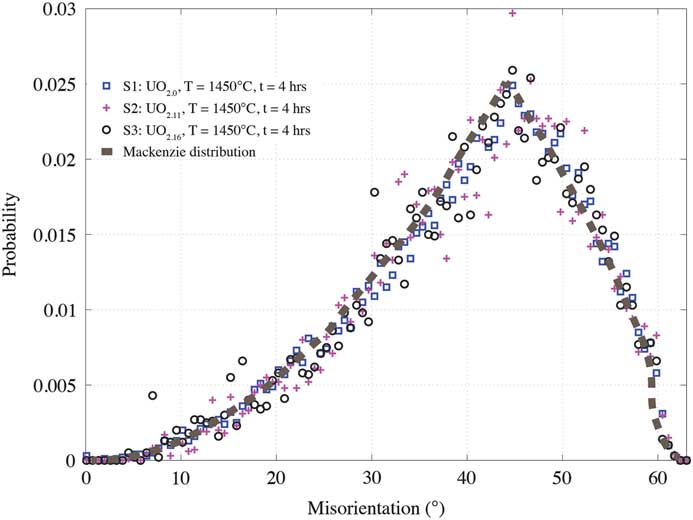
Figure 4 Grain-boundary misorientation distribution for the UO2+x samples. The distribution of misorientation angle is random, closely resembling a Mackenzie curve.
Discussion
Current microstructure data infer that average grain size increases with x in UO2+x , provided the sintering conditions, density, and porosity are similar. Normally, the grain growth in stoichiometric UO2 is expected to be slower than in specimens with x > 0 [Reference Bannister and Buykx21] because of the requirement of having to overcome a higher energy barrier for the x = 0 specimen [Reference Amato22]. The grain-size distribution in Figure 3 shows a clear trend of increasing average grain size with increasing x. The observed trend suggests that increasing oxygen content contributes to accelerating thermally activated densification, leading to decreased porosity in hyper-stoichiometric samples, as seen in Table 1. For the as-sintered samples, the grain-boundary misorientation distribution was found to be random. Note that the pressing direction during sintering might have been expected to impart some anisotropy at some point, but that was not observed.
Although absorption data were collected for all three samples, because of the novelty of the samples and the measurements, apparently the optimal experimental setup was not realized, resulting in measurement inconsistencies (such as variable sample-to-detector distances) during data collection for the three samples. Thus, quantitative information on pore sizes could not be extracted for these samples. Therefore, nf-HEDM orientation maps were used for porosity quantification, but this method is significantly limited by its spatial resolution. As a result, a large discrepancy between the estimated and bulk porosity was observed, especially for sample S3. The limited spatial resolution of nf-HEDM maps could have missed all pores that were smaller than ~3 μm. In addition to that there is a higher chance that the grain-boundary voxels could have been unindexed and counted toward porosity volume. However, future measurements could be improved by determining a fixed sample-to-detector distance that is suitable for all samples, improving the absorption contrast by collecting transmission data with higher angular resolution, increasing integration time, and reducing the sample-to-detector distance.
Conclusion
In this work, we have demonstrated the viability of the HEDM techniques on a high-Z material. Non-destructive techniques enabled both spatially resolved orientation and density measurements of the UO2+x samples. We observed increased sintering kinetics for hyper-stoichiometric samples. The measurements shown here push the limits of both HEDM and μ-CT techniques because we have measured grains and pores below 5 μm for a high-Z material. Work is in progress to develop next-generation instrumentation in order to perform in-situ experiments mimicking operating conditions such as high temperature and radiation environment.
Acknowledgements
This work was supported by Los Alamos National Laboratory’s (LANL) Laboratory-Directed Research and Development (LDRD) program and the fuel cycle R&D program under the Office of Nuclear Energy (NE). This research used resources of the Advanced Photon Source (APS), a U.S. Department of Energy (DOE) Office of Science User Facility operated for the DOE Office of Science by Argonne National Laboratory under Contract No. DE-AC02-06CH11357. Shiu Fai Frankie Li, James Hunter, and Levente Balogh are acknowledged for their contributions during experimental data acquisition at APS, beamline 1-ID-B. The reconstructions were performed on the Darwin cluster at LANL and Orthros cluster at APS.


