


Puberty is defined as the physiological process of hormonal maturation and somatic growth. It can manifest itself in different forms and at different periods for every individual due to hormonal, genetic and environmental influences( 1 , Reference Oliveira, Frutuoso and Gambardell 2 ). Normally the onset of puberty, with hormonal and body changes, occurs between the ages of 8 and 13 years in girls and between 9·6 and 13·6 years in boys, thus comprising the end of childhood and the beginning of adolescence in both sexes. In addition, this is a period involving physical, psychological and social changes among girls and boys, along with changes in body composition( 1 , Reference Oliveira, Frutuoso and Gambardell 2 ).
The maturation process causes changes in body composition and differences between sexes, in which boys have a higher proportion of fat-free mass and girls a greater amount of fat mass( 1 ). Therefore, the correct estimation of body composition is important in the evaluation and monitoring of the health and nutritional status of children and adolescents, considering the relationship between CVD, diabetes mellitus, dyslipidaemias, hypertension and metabolic syndrome( Reference Jaeger and Barón 3 , Reference Kim and Caprio 4 ), which usually remain in adult life( Reference Oliveira, Franceschini and Rosado 5 ).
Increased prevalence of obesity and metabolic changes have been reported in all age groups. According to the Brazilian Institute of Geography and Statistics, based on data from the Consumer Expenditure Survey (POF) conducted during 2008–2009, the prevalence of overweight and obesity in children aged 5–9 years was 33·8 and 14·2 %, respectively, and overweight was present in 20·6 % and obesity in 5·0 % of adolescents( 6 ).
Different methods exist for assessing body composition. Among the low-cost methods, BMI has been the most criticized in recent years for not analysing the components of body composition, as has skinfold thickness for its applicability and reliability( Reference Dias, Ávila and Damasceno 7 ).
Because of these difficulties in nutritional assessment, Bergman et al.( Reference Bergman, Stefanovski and Buchanan 8 ) proposed the body adiposity index (BAI) for adult subjects, a new parameter to evaluate body composition from two anthropometric measures, both of which are easily reproducible: height, in metres, and hip circumference, in centimetres. It is a simple, fast, relatively inexpensive and non-invasive method. In 2013, the paediatric body adiposity index (BAIp)( Reference El Aarbaoui, Samouda and Zitouni 9 ) was also proposed to predict body fat in children and adolescents aged 5–12 years because the BAI, initially used for adults, overestimates body fat in the paediatric population( Reference Dobashi, Takahashi and Nagahara 10 ). BAI has been widely used for adults( Reference Dias, Ávila and Damasceno 7 , Reference Bergman, Stefanovski and Buchanan 8 , Reference Sulino, Silva and Ramos 11 ); whereas BAIp has still been scarcely used and no studies have been found which compare the use of BAI and BAIp in the evaluation of body composition with dual-energy X-ray absorptiometry (DXA) in Brazilian children and adolescents.
Thus, in view of the importance of body composition evaluation in clinical practice and population studies, the present study aimed to evaluate the agreement of BAI and BAIp compared with DXA and to propose cut-off points for these indices aiming at classification of excess body adiposity in Brazilian children and adolescents, by age and sex.
Methods
Population and study design
The present study was of cross-sectional design and carried out with children and adolescents, between 8 and 19 years of age, enrolled in public and private schools in the urban and rural area of Viçosa, Minas Gerais, Brazil. This municipality is located in the Zona da Mata Region at 227 km from the capital, Belo Horizonte. According to the 2010 Census, Viçosa has a land area of 299 km2 and 72 244 inhabitants, of whom 93·2 % live in urban areas. The gross domestic product per capita in Viçosa is R$ 7704·50( 12 ).
The 8- and 9-year-old participants of the present study were selected from the Survey of Health Assessment of Schoolchildren (Pesquisa de Avaliação da Saúde do Escolar – PASE), a cross-sectional study carried out to evaluate the cardiovascular health of children enrolled in urban schools of Viçosa, Minas Gerais, Brazil. The statistical program Epi Info (version 7) was used for sample calculation, considering the total number of children aged 8 and 9 years enrolled in urban schools in 2015 (n 1464), prevalence of obesity of 10·7 %( Reference Novaes, Priore and Franceschini 13 ), tolerated error of 3 %, confidence level at 95 % and 20 % increase to cover losses, totalling 392 children in the final sample. The selection of children has already been described previously( Reference Filgueiras, Suhett and Silva 14 , Reference Milagres, Rocha and Filgueiras 15 ). Briefly, stratified random sampling was carried out to select the schoolchildren, in which the number of children to be sampled in each school was weighted by school according to its size. Subsequently, a draw was carried out using a random number table to complete the number of students needed per school. After the selection, those responsible for children were contacted by telephone and invited to participate in the study. Parents or guardians who allowed the participation of their children in the study signed the Informed Consent Term, in accordance with the Declaration of Helsinki, and we started data collection at the Health Division of the Federal University of Viçosa. At the end of the data collection, loss of 4·2 % was recorded because some children did not accomplish all stages of the study. The final sample consisted of 378 students.
Adolescents aged 10–19 years were selected from rural and urban public and private schools (fifth year of elementary school to third year of secondary education) of the municipality of Viçosa, Minas Gerais, Brazil. The sample size was calculated using the Epi Info program (version 6·04) using the specific formula for cross-sectional studies, considering the total adolescent population of 11 898 from Viçosa( 16 ), with expected prevalence of outcome of 50 %( Reference Luiz and Magnanini 17 ) (since the study considered multiple cardiovascular risk factors as outcome) and a tolerated error of 5 %, resulting in a minimum sample of 628 adolescents, at 99 % confidence level. The sample consisted of 671 adolescents.
Adolescents were selected through the stratified random sampling process. The number of students to be sampled in each school was determined according to the sex, age and school size. The research was divulged in the classrooms of primary and secondary education, at which time the Inform Consent Term was made available to students. Subsequently, the consents signed by each adolescent and his/her parent/guardian, in the case of minors under 18 years, were collected by the research team on previously scheduled days. The draw of the adolescents was carried out using the table of random numbers, based on the list of students who gave their consent( Reference Faria, Faria and Franceschini 18 , Reference Pereira, Faria and Faria 19 ).
Inclusion criteria were: no regular use of drugs that altered glycaemia, insulinaemia, lipid metabolism and/or blood pressure levels; no participation in weight-reduction and weight-control programmes; no physical, cognitive or multiple disabilities; no regular use of diuretics/laxatives; and for female adolescents, not being pregnant or having been previously pregnant.
Studies were approved by the Human Research Ethics Committee of the Federal University of Viçosa (case numbers 0140/2010 and 663.171/2014).
Anthropometric assessment and body composition
Anthropometric measures were taken in a suitable room by a trained examiner, with participants barefoot and wearing light clothes, using standardized international techniques( Reference Lohman 20 ). Weight was measured on a digital electronic scale, with a capacity of 150 kg and accuracy of 0·1 kg. Height was measured using a stadiometer graduated in millimetres. Weight and height measurements were used to calculate BMI. Children’s nutritional status was classified using the cut-off points of BMI-by-age, according to the WHO Z-score recommendation( 21 ).
Hip circumference was measured on the largest part of the gluteus, with an inelastic measuring tape with a 0·1 cm precision, with participants standing, feet joined and body weight supported by both legs( Reference Lohman 20 ).
Percentage of body fat (%BF) was estimated by BAI, BAIp and DXA.
BAI was calculated from the hip circumference (in centimetres) and height (in metres), according to the equation of Bergman et al.( Reference Bergman, Stefanovski and Buchanan 8 ):
 $${\rm BAI}{\equals}{{{\rm hip\, circumference\, (cm)}} \over {{\rm [height \,(m)]}^{{{\rm 1}\cdot{\rm 5}}} }}{\minus}18.$$
BAIp was calculated with the equation( Reference El Aarbaoui, Samouda and Zitouni 9 ):
 $${\rm BAIp}{\equals}{{{\rm hip \,circumference \,(cm)}} \over {{\rm [height \,(m)]}^{{{\rm 0}\cdot{\rm 8}}} }}{\minus}38.$$
DXA (Lunar Prodigy Advance; GE Medical Systems Lunar, Milwaukee, WI, USA) was considered as the reference method; the evaluation was conducted by a specialized technician, using the device’s software for body composition analysis. The participants remained supine on the table and rays were emitted and measured by an energy-discriminating detector. Participants also followed a laboratory protocol for the examination and wore light clothes without any metal ornament. The participants whose %BF obtained by DXA was greater than or equal to the 85th percentile, by age and sex in the sample, were considered to have excess body fat. Some studies with children and adolescents have shown that use of the 85th percentile is able to identify those with excess body fat( Reference McCarthy, Cole and Fry 22 , Reference Flegal, Ogden and Yanovski 23 ).
Data analysis
Statistical analysis was performed using the statistical software package IBM SPSS Statistics for Windows version 20.0 and MedCalc version 9.3, at 5 % significance level for all tests. Variables were evaluated for normality using the Kolmogorov–Smirnov test.
Descriptive analysis of data using estimates of relative frequencies and medians (interquartile range) was performed according to the nature of the variables. The Mann–Whitney test was used to compare the median %BF obtained by BAI, BAIp and DXA in both sexes.
The areas under the receiver-operating characteristic curve determined the validity of BAI and BAIp in predicting total body fat excess using DXA. The receiver-operating characteristic curves were also used to identify BAI and BAIp cut-off points for the classification of excess body fat according to age and sex.
The contrasting groups method was used to evaluate if proposed cut-off points were able to identify excess android fat according to age and sex. This method is based on the interpretation of several computed statistical indices: (i) probability of correct decisions; (ii) misclassification of errors; (iii) validity coefficient; and (iv) utility analysis( Reference Berk 24 ).
The Bland–Altman plot method was used to evaluate the agreement of the estimates from each method tested in relation to DXA. The bias represents the mean difference between the two methods; agreement limits of 95 % (sd multiplied by 1·96) were calculated from the sd of the mean difference. It is required that bias should be statistically equal to zero (paired t test) for a method to be considered as having a good agreement, and it is important to consider agreement limits in the interpretation( Reference Bland and Altman 25 , Reference Monaghan, Delahunt and Caulfield 26 ). To complement the analysis, we proceeded to perform linear regression to assess the occurrence of proportional bias, and values with statistical significance lower than 5 % were considered as proportional bias.
Results
The study included 1049 children and adolescents (52·4 % girls), with median age of 11·2 years (interquartile range: 9·4–15·1 years). In relation to sex, girls had a higher %BF (P<0·001) than boys, regardless of the evaluation method used (Table 1).
Table 1 BMI and percentage body fat (%BF), by sex, estimated using different methods among children and adolescents aged 8–19 years (n 1049), Viçosa, Minas Gerais, Brazil, 2010–2012/2015

IQR, interquartile range; DXA, dual-energy X-ray absorptiometry; BAI, body adiposity index; BAIp, paediatric body adiposity index.
*P<0·05 (Mann–Whitney test).
Table 2 shows the comparison between the performances of BAI and BAIp in identifying high adiposity. In general, both indicators showed satisfactory performance; however, in the 18–19 years age group, BAIp had a better predictive capacity compared with BAI.
Table 2 Areas under the receiver-operating characteristic curve (AUC) of the body adiposity index (BAI) and the paediatric body adiposity index (BAIp) to identify high adiposity, by age and sex, in children and adolescents aged 8–19 years (n 1049), Viçosa, Minas Gerais, Brazil, 2010–2012/2015
*P<0·05 (Z test).
Table 3 shows the cut-off points for BAI and BAIp to classify excess body fat according to age and sex. In girls, the BAI cut-off points ranged from 27·6 to 30·7 % and those of BAIp from 20·9 to 27·8 %. In boys, the BAI cut-off points ranged from 21·2 to 30·1 % and BAIp cut-off points from 17·4 to 24·6 %. A summary of analytical steps of the contrasting groups methods showed that the proposed cut-off points were adequate to identify excess android fat, except for BAI in boys aged 18–19 years (Table 4).
Table 3 Cut-off points, sensitivity (Sens.), specificity (Spec.), positive predictive value (PPV) and negative predictive value (NPV) of the body adiposity index (BAI) and the paediatric body adiposity index (BAIp) for the classification of high adiposity, by age and sex, in children and adolescents aged 8–19 years (n 1049), Viçosa, Minas Gerais, Brazil, 2010–2012/2015
Table 4 Probabilities of correct decisions and misclassification errors, validity coefficients, and expected utility, disutility and maximal utility for cut-offs points of the body adiposity index (BAI) and the paediatric body adiposity index (BAIp) for the classification of high adiposity, by age and sex, in children and adolescents aged 8–19 years (n 1049), Viçosa, Minas Gerais, Brazil, 2010–2012/2015
The agreement analysis demonstrated that BAI overestimates, on average, the %BF obtained by DXA by 2·64 %; while BAIp underestimates it by 3·37 % on average (Fig. 1). The mean differences were statistically different from zero by the paired t test (data not shown). The linear regression analysis showed that both indicators had proportional bias (P<0·05); that is, using BAI and BAIp in children and adolescents with extreme values of body fat can lead to errors of overestimation and underestimation, respectively.
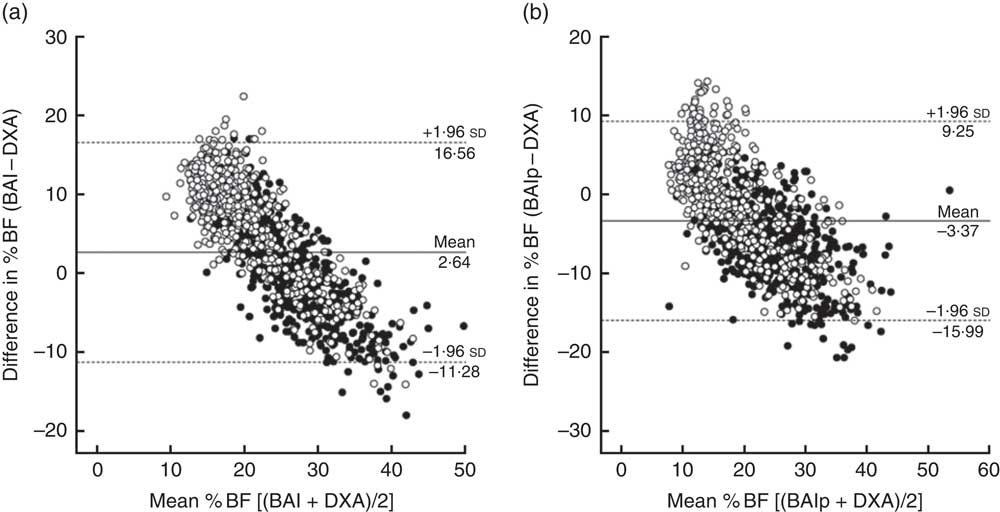
Fig. 1 Bland–Altman’s agreement analysis between percentage body fat (%BF) values estimated by (a) the body adiposity index (BAI) and (b) the paediatric body adiposity index (BAIp) with %BF values estimated by dual-energy X-ray absorptiometry (DXA), by sex (•, girls; ○, boys), in children and adolescents aged 8–19 years (n 1049), Viçosa, Minas Gerais, Brazil, 2010–2012/2015. The difference in %BF between the two methods is plotted v. the mean %BF from the two methods; —— represents the mean difference (bias) and - - - - - represent the limits of agreement
Discussion
The BAI and BAIp equations were developed to evaluate body composition and be an alternative to BMI in the diagnosis of overweight and obesity in individuals( Reference Bergman, Stefanovski and Buchanan 8 , Reference Souza, Tajes Junior and Mascarenha 27 ). Therefore, studies to evaluate the performance and agreement of BAI and BAIp in predicting excess adiposity in different populations are important, since these indices are indirect methods developed to determine adiposity easily, using only hip circumference and height.
The results of the receiver-operating characteristic curve analysis showed that BAIp and BAI had the ability to predict excess body adiposity in children and adolescents, especially BAIp, with a better performance in the 18–19 years age group compared with BAI. However, the Bland–Altman test showed no good agreement of these indices with the values obtained by DXA, identifying both an overestimation of %BF by BAI and an underestimation by BAIp.
El Aarbaoui et al.( Reference El Aarbaoui, Samouda and Zitouni 9 ) assessed individuals aged 5–12 years to verify the effectiveness of the BAI equation and a possible need for another equation more efficient for the paediatric population. Their results showed that BAI overestimated body fat values in this age group and a paediatric equation was necessary for this evaluation, namely the BAIp.
The predictive capacity observed in the present study possibly reflects the relationship of these indices with the methods of assessing the nutritional status, as confirmed by the literature. In a study with Brazilian adults aged 20–59 years, strong correlations were found between the %BF calculated by BAI and that determined by DXA, with values of 0·72 and 0·78 for men and women, respectively. On the other hand, the authors observed that BAI overestimated the %BF in males by 1·01 %, while it underestimated by 4·06 % in females( Reference Segheto, Coelho and Silva 28 ). Using Cronbach’s α and correlation analysis, Dias et al.( Reference Dias, Ávila and Damasceno 7 ) found a significant correlation between the %BF values estimated by BAI and DXA, but the association between the methods using Cronbach’s α analysis was only 39·3 %.
In French adolescents, BAI and BAIp overestimated body fat by more than 3·48 % and 4·62 % in relation to DXA, showing an intraclass correlation coefficient of 0·45 and 0·15, respectively( Reference Thivel, O’Malley and Pereira 29 ). Frignani et al.( Reference Frignani, Passos and Ferrari 30 ) also evaluated the effectiveness of BAI in evaluating adiposity in adolescents using skinfolds as a reference method. BAI presented associations of 0·71 and 0·68 for boys and girls, respectively, when compared with body fat values determined by skinfolds. In male adolescents, Souza et al.( Reference Souza, Grzelczak and Alarcón-Meza 31 ) found a correlation of 0·68 between the percentage of fat by BAI and the value estimated by skinfolds.
Similarly to our study, other authors who found correlation and association of BAI and BAIp with the methods considered as reference in the evaluation of body composition also found low agreement, always identifying an over- or underestimation( Reference Dias, Ávila and Damasceno 7 , Reference El Aarbaoui, Samouda and Zitouni 9 , Reference Segheto, Coelho and Silva 28 – Reference Colley, Cines and Current 32 ).
Dobashi et al.( Reference Dobashi, Takahashi and Nagahara 10 ) argued that BAIp is a better marker of overweight and body fat in obese children than BAI. One possible explanation for its excellent performance in late adolescence would be that the changes in anthropometric profile and body composition that occur until the end of adolescence are better captured by the equation developed for the paediatric population, which is marked by intense growth and different from the adult stage( Reference Dobashi, Takahashi and Nagahara 10 ).
Dias et al.( Reference Dias, Ávila and Damasceno 7 ) used the Bland–Altman residual score analysis and identified that BAI can either overestimate or underestimate the percentage of fat in young women. Colley et al.( Reference Colley, Cines and Current 32 ) analysed the BAI and BAIp equations in relation to the %BF obtained by DXA in adolescents aged 12–17 years with BMI-for-age values above the 95th percentile and found that both indices underestimated the fat values.
Souza et al.( Reference Souza, Grzelczak and Alarcón-Meza 31 ) found a good correlation between BAI and %BF using skinfolds, but the Bland–Altman agreement method again showed that the equation overestimated the values. This low agreement between the BAI and BAIp equations and the body fat values obtained by DXA and skinfolds shows that use of these indices in individuals who are obese or with a high %BF can lead to errors of over- or underestimation, and should be applied with caution.
We emphasize that the low agreement demonstrated in the Bland–Altman plot was based on the mean difference between measures being significant and the presence of proportional bias. These make it difficult to establish limits of agreement and the possibility of correction of measurements obtained by BAI and BAIp from the mean of differences( Reference Bland and Altman 25 , Reference Bland and Altman 33 ).
The cut-off points estimated in the present study resulted in higher %BF by BAI compared with BAIp, regardless of sex. The use of these cut-off points, especially at the outpatient level, should be carefully evaluated, since the positive predictive values were low in some age groups which could result in false positives; that is, diagnose children and adolescents as overweight who do not yet present such alteration in their nutritional status. Besides that, these cut-off points should be associated with other indicators already known and validated for the population, considering that a false diagnosis of overweight or excess body fat can negatively influence the social life of these children and adolescents and can generate unnecessary costs to the health system.
BAI and BAIp showed low agreement with DXA in the estimation of body fat in Brazilian children and adolescents and may lead to errors in the evaluation of %BF. Therefore, choosing a method for body composition assessment should be done with caution in the paediatric population, both individually and collectively, so that the accuracy of this evaluation can contribute to effective prevention and monitoring of obesity and co-associated morbidities in both current and future life stages. Further studies are needed to evaluate the predictive abilities of BAI and BAIp for excess body adiposity according to reference methods.
Acknowledgements
Acknowledgements: The authors thank the National Council for Scientific and Technological Development (CNPq) and the Foundation for Research Support of the State of Minas Gerais (FAPEMIG) for the financial support; the Coordination for the Improvement of Higher Education Personnel (CAPES) for granting a scholarship; and the children, adolescents, parents and guardians for participating in the study. Financial support: This work was supported by CNPq (grant numbers 485986/2011-6 and 478910/2013-4) and FAPEMIG (grant number APQ-01618-10). CNPq and FAPEMIG had no role in the design, analysis or writing of this article. Conflict of interest: The authors declare no conflict of interest. Authorship: M.S.F. assisted the conception and design of this work, assisted the data collection, analysis and interpretation of the data, conducted the literature search, as well as wrote the manuscript. R.S.C., E.R.F. and F.R.F. assisted the conception and design of this work, assisted the data collection, analysis and interpretation, as well as revised and approved the final version to be published. P.F.P. and A.Q.R. revised and approved the final version to be published. S.E.P. and J.F.N. designed the study including the data collection, coordinated and supervised and approved the final version to be published. Ethics of human subject participation: This study was conducted according to the guidelines laid down in the Declaration of Helsinki and all procedures involving human subjects were approved by the Ethics Committee on Human Research of the Federal University of Viçosa (case numbers 0140/2010 and 663.171/2014). Moreover, this project was presented to the Municipal Department of Education, the Regional Superintendent of Education and principals of schools. All participants, as well as their responsible adults, were informed about the objectives of the research and informed consent was obtained from all children’s parents/guardians.


