


Introduction
Surgical treatment of drug-resistant temporal lobe epilepsy (TLE) depends on proper identification of the seizure onset zone (SOZ) and on the differentiation of mesial, temporolimbic seizure onsets from temporal neocortical seizure onsets. This presents a challenge for noninvasive presurgical investigations using scalp electroencephalography (EEG) or magnetoencephalography (MEG), especially in mesial temporal lobe epilepsy (MTLE), where the anatomically and physiologically unique temporolimbic structures prone to seizure generation are situated deep in the brain, where epileptiform activity is often “invisible” to EEG and MEG.
The definitive gold standard for identification of the SOZ is intracranial EEG (iEEG), provided that the implanted electrodes are located in close proximity to the SOZ. In practice, intracranial and extracranial recording modalities can work together, with noninvasive source localization helping to guide iEEG electrode placement. In some cases, when source localization is concordant with clinical and neuroimaging information suggesting a discrete, focal seizure generator, iEEG can be bypassed and a patient may proceed directly to surgery. In such cases, a postsurgical seizure-free outcome is taken as evidence that the “epileptogenic zone” was correctly identified. The epileptogenic zone, by definition, includes the SOZ, but it is not necessarily limited to the SOZ, making it a less good standard against which to assess the accuracy of EEG or MEG ictal source localization. Nevertheless, a postsurgical seizure-free outcome, combined with a strong presurgical hypothesis on location of the SOZ, can serve as a reasonable surrogate for ground truth in the absence of iEEG.
Among many source localization methodologies, the equivalent current dipole (ECD) inverse modeling method, applied to interictal spikes, has been used most extensively for presurgical planning in TLE. Reference Merlet and Gotman1–Reference Wennberg and Cheyne3 However, interictal spikes may be dissociated from the SOZ, a situation especially common in MTLE. Reference Wennberg and Cheyne2–Reference Wennberg, Valiante and Cheyne4 Moreover, it is often the case in MTLE that more than one area in the temporal lobe produces independent interictal spikes, Reference Wennberg, Valiante and Cheyne4 limiting the utility of interictal spike source localization for determining whether a TLE patient’s seizures are of mesial or neocortical origin. Reference Wennberg5 For the localization of ictal events, the ECD model is limited in its application to seizures with sharp, discernible discharges, whereas most ictal events, as well as shorter “ictal-like” or polyspike events, show a multifrequency, oscillatory pattern. In a recent systematic review and meta-analysis of interictal and ictal EEG and MEG source imaging studies, it was found that various techniques demonstrated reasonably high accuracy in localizing epileptic foci, at least to a lobar or sublobar level; however, ictal MEG analyses, as performed to date, were noted to have the lowest specificity and accuracy. Reference Sharma, Seeck and Beniczky6
Notwithstanding, one would prefer to localize directly the seizure instead of the interictal spike, especially in MTLE. Reference Wennberg, Valiante and Cheyne4,Reference Wennberg5 Furthermore, for the purposes of presurgical planning in patients with drug-resistant epilepsy, discrete localization to a particular gyrus/sulcus is the desired ideal, rather than simple identification of the correct lobe or broad sublobar region. Reference Wennberg and Cheyne2 What is needed is a sufficiently robust method that can be applied to any pattern of temporal dynamics and that can also uncover ictal events occurring in deep structures. MEG is, in principle, a good candidate for capturing focal activity due to its low sensitivity to secondary currents; however, the ictal MEG literature is sparse.
Most ictal MEG studies have used the ECD model, alone or in addition to frequency-based methods, Reference Stefan, Schneider and Feistel7–Reference Medvedovsky, Taulu and Gaily14 including a large study of 23 patients with extratemporal epilepsy who underwent both iEEG and surgical resection of the presumptive epileptogenic zone, which reported 70%–75% accuracy for ictal localization at the level of lobar surface planes. Reference Medvedovsky, Taulu and Gaily14
A few studies have followed a different path, using distributed source models Reference Plummer, Vogrin, Woods, Murphy, Cook and Liley15–Reference Pellegrino, Hedrich and Chowdhury18 or beamforming Reference Badier, Bénar and Woodman19 to analyze ictal MEG recordings. Reference Hamandi, Routley, Koelewijn and Singh20 A very large study of 44 patients with neocortical epilepsy concluded that extended source minimum norm estimation on seizure-specific frequency bands was more suitable for localization of ictal rhythms than single-point (ECD) solutions, but that modeling of deeply seated foci presented a challenge. Reference Alkawadri, Burgess, Kakisaka, Mosher and Alexopoulos17 A study of 13 patients with neocortical epilepsy reported 90% sublobar concordance between the SOZ localized by wavelet-based maximum entropy on the mean analysis of ictal MEG and that identified by iEEG or suggested by MRI. Reference Pellegrino, Hedrich and Chowdhury18 Badier et al. Reference Badier, Bénar and Woodman19 used a beamforming technique, linearly constrained minimum variance (LCMV), to analyze rhythmic ictal MEG patterns in six patients (five extratemporal, one MTLE) and found LCMV superior to the ECD model in terms of concordance with iEEG findings, but unable to resolve the deep hippocampal SOZ in their MTLE patient.
The use of beamformers for the spatial analysis of cortical rhythms is pervasive in cognitive neuroscience; however, in the assessment of epileptic foci beamforming has been mainly restricted to the recovery of virtual channels, typically obtained via LCMV Reference Van Veen, Van Drongelen, Yuchtman and Suzuki21 or synthetic aperture magnetometry, Reference Vrba and Robinson22 aiming at some second step of feature evaluation. Most popular is the so-called kurtosis beamformer, Reference Vrba and Robinson22–Reference Wilenius, Lauronen, Kirveskari, Gaily, Metsähonkala and Paetau25 in which kurtosis is evaluated on the virtual channels across interictal periods. Considering the rhythmicity that characterizes ictal events it is perhaps surprising that little work has been done to investigate the use of a frequency domain beamformer, such as dynamic imaging of coherent sources (DICS), Reference Gross, Kujala, Hamalainen, Timmermann, Schnitzler and Salmelin26–Reference Gupta, Ossenblok and van Luijtelaar28 as a potential tool for noninvasive presurgical localization of the SOZ.
In this paper, we present a beamforming method applied to the MEG signal of ictal events recorded in a series of six TLE patients, three with neocortical epilepsy and three with MTLE. We have chosen to focus in detail on this small group of patients, drawn from a large pool of patients with temporal and extratemporal epilepsy in whom we have recorded ictal events using MEG, because of the unique neuroanatomical and neurophysiological characteristics of MTLE, which merit special consideration in studies of epilepsy surgery, Reference Wennberg, Valiante and Cheyne4,Reference Wennberg5 and because ground truth evidence of SOZ location is available for this group, against which the accuracy of the beamforming method can be directly compared.
Methods
Recording
MEG was acquired using an Elekta Neuromag TRIUX 306-channel system (Helsinki, Finland) with simultaneous 32-channel EEG. Patients were sleep-deprived prior to the 90-min recording. Sampling frequency was 1000 Hz; online filter bandwidth 0.1–330 Hz. Artifact suppression used the default parameters of the spatiotemporal signal space separation algorithm implemented within the Elekta Maxfilter system (10-s time window, subspace correlation 0.980).
Anatomy
Head position inside the MEG sensor array was determined using a head position indicator (HPI) with five coils attached to the scalp. A Polhemus 3D-Fastrak system (Colchester, USA) was used to digitize the head shape and HPI coil positions.
Individual T1-weighted anatomical MRI scans and the corresponding digitized head shapes were coregistered, initially manually, using anatomical landmarks, and then automatically, using an iterative closest point algorithm, as described previously. Reference Wennberg, Tarazi, Zumsteg and Garcia Dominguez29,Reference Swinkin, Lizárraga and Algarni30 The lead field was computed using a realistically shaped single-shell approximation. Reference Nolte31 The source space comprised a regular 3D grid, with 5 mm distance between adjacent nodes, inside the inner surface of the skull.
Signal Processing of Ictal Events
Ictal events were manually identified by a clinical neurophysiologist (RW) in the MEG–EEG recording and used to epoch the ictal MEG signal into trials, typically 1-s long, with 50% overlap. Baseline (interictal) periods were visually selected and epoched with the same duration. Baseline segments were chosen to ensure the subject was in the same state of sleep or wakefulness as during the ictal events to be modeled. An arbitrarily large number (n = 500) of these interictal epochs were randomly selected. Then, both ictal and interictal epochs were inspected for artifacts using different statistics such as variance, range, and kurtosis, and trials were removed if they were visually considered outliers for any of these statistics. A power spectrum per channel and per condition (i.e., ictal, baseline) is then calculated by averaging across trials. Subsequently, the ratio between the powers of the two conditions is evaluated for each channel. This ratio, for individual channels, is then visualized over schematic head diagrams (we will call them “topoplots”). In these plots, each pair of orthogonal planar gradiometers corresponding to the same sensor is averaged together. This is essential to enable detection of focal patterns in sensor space, which cannot be achieved by mapping the field from magnetometers.
Both elements, the relative power spectrum and the topoplots, help to determine the frequency of interest. Here, the goal is to identify not only the frequency with the largest signal-to-noise ratio but also one that displays a pattern that indicates focality, that is, high values restricted to a small neighborhood in sensor space. In some cases, the same focal pattern appears across all or a wide range of frequencies; in other cases, the pattern can morph over the frequency domain, displaying two or more distinct configurations. In the latter scenario, all of the main frequency peaks for the distinct patterns are analyzed independently.
We follow the principle of common filters where both sets of trials are pooled together in order to obtain a common beamformer filter. This filter is then applied independently to each set of trials. The end result is displayed as the contrast between both conditions, expressed as the relative change of power of ictal versus interictal periods over every node. In this report, we will refer to this unitless entity as “beamformer power contrast” (BPC). The actual implementation of the DICS and LCMV beamformers and the frequency analysis were done with the help of Fieldtrip. Reference Oostenveld, Fries, Maris and Schoffelen32 When evaluating the beamformer solution, there is sometimes more than one local BPC maximum. If this is the case, and if the additional maxima are relevant in terms of the magnitude of the BPC, then those locations are also reported.
This method places an emphasis on beamforming each prevalent ictal frequency using DICS and/or bandpassed LCMV. If no single dominant frequency is present, unfiltered LCMV is also used. It is to be stressed that, although the cases are processed within a single conceptual pipeline, the parameters of the computation are specific to how an individual seizure manifests in its frequency and spatial domains. For example, if a patient has more than one type of ictal, ictal-like, polyspike, or other rhythmic epileptiform activity, each characterized by a specific frequency, then those activities are modeled independently (based on their frequency), to check whether or not they are likely attributable to the same focus. In other words, the analysis method is the same for all subjects, except that the frequencies, bandpass, and temporal windows selected for each analysis are specific to each particular ictal event.
Source Localization of Interictal Spikes
Interictal spikes were manually identified (RW) in the MEG–EEG recording and electromagnetic source imaging (EMSI) of interictal spike foci performed using CURRY 6 (Compumedics, Abbotsford, Australia), as described previously. Reference Wennberg and Cheyne2,Reference Wennberg and Cheyne3,Reference Wennberg, Tarazi, Zumsteg and Garcia Dominguez29
Patients
Cases were selected from 312 consecutive MEG–EEG recordings performed between 2015 and 2021 at the Mitchell Goldhar MEG Unit, Toronto Western Hospital, as part of the presurgical investigation of patients with drug-resistant epilepsy, and included all patients with temporal lobe ictal events who also had iEEG or other ground truth SOZ localization. Among the 312 patients, 77 patients had ictal events recorded with MEG, either clinical or subclinical seizures or shorter, ictal-like, or polyspike bursts: 58 with extratemporal epilepsy and 19 with TLE. Ictal MEG beamformer localization in the extratemporal epilepsy group will be the subject of a different study. For this study, 13 of the TLE patients who had ictal events during their MEG–EEG recording were excluded from the case series presentation due to lack of definitive SOZ identification (i.e., neither iEEG nor clinical, MRI, and postsurgical outcome evidence of unilateral MTLE), leaving six patients who met inclusion criteria. The characteristics of the six included patients are presented in Table 1. The three patients with neocortical TLE all had iEEG recording. Of the three MTLE patients, only the patient with normal brain MRI underwent iEEG; for the other two patients, both with unilateral hippocampal sclerosis, a postsurgical seizure-free outcome served, along with the clinical and MRI information, as the ground truth.
Table 1: Patient characteristics and ictal beamformer localizations

NA = not applicable.
a Percentile of the beamformer power contrast at the location of the interictal dipole source solution. For example, 99% means that, at the location of the dipole, the beamformer power contrast is in the top 1% of its distribution.
b No iEEG recording.
c No interictal spikes.
d No surgical resection due to colocalization with eloquent language cortex.
e No valid interictal ECD source solution.
f No surgical resection (possible surgical approach under consideration).
g Estimate based on intraoperative photography.
Intracranial EEG
Stereotactic EEG (sEEG) and electrocorticography (ECoG) were acquired from multicontact depth or subdural electrodes, respectively, using standard clinical equipment and techniques. For sEEG, each electrode contact was mapped manually from the clinical computerized tomography/MRI reconstruction to the MRI scan in which the beamformer solution was originally obtained. For ECoG, electrode contact locations were reconstructed from intraoperative photographs.
Ground Truth Determination
The definitive gold standard for identification of the SOZ in noninvasive source localization studies is iEEG, Reference Wennberg and Cheyne2–Reference Wennberg, Valiante and Cheyne4 which, as described above, was not acquired in two patients, both of whom had unilateral MTLE based on clinical (video EEG, neuropsychological assessment) and MRI investigations, and a postsurgical seizure-free outcome after anteromesial temporal resection (AMTR). A seizure-free outcome after epilepsy surgery is taken as evidence for correct identification of the “epileptogenic zone,” which conceptually includes the SOZ, but is not limited to the SOZ, and is thus a less exacting standard for the determination of spatial accuracy in source localization studies. Nevertheless, for this study, we included the two patients without iEEG because their specific, syndromic form of epilepsy (unilateral MTLE with ipsilateral hippocampal sclerosis) is so typical, and so uniformly associated with ipsilateral temporolimbic seizure onsets, that the combination of their clinical, MRI, and surgical outcome data could be fairly considered to approximate a ground truth.
Results
Interictal Epileptiform Discharges
Five of the six patients had interictal spikes during their MEG–EEG recordings, and ECD EMSI was performed successfully in four cases. Patient 1 had 139 right inferior temporal spikes with a vertical dipolar distribution showing maximal electropositivity over the frontocentral midline and simultaneous electronegativity over the right greater than left subtemporal areas, with minimal representation at the standard international 10–20 system temporal electrode positions (Figure 1A), the topographic field compatible with a medial basal temporal neocortical source. Patient 2 had 64 “classical” right anterior temporal spikes with an oblique dipolar distribution indicative of an anterolateral temporal neocortical source (Figure 1B). Reference Wennberg and Cheyne2,Reference Wennberg and Cheyne3 Patient 3 had no definite interictal epileptiform activity. Patient 4 had 25 low amplitude left mid temporal spikes with a vertically oblique dipolar topography suggesting a lateral temporal neocortical source (Figure 1C). Patient 5 had 185 polymorphic spikes and spike and wave discharges over the right posterior, mid and anterior-mid temporal regions, with shifting electrical field maxima and an inconsistent temporal relation between EEG and MEG onset and peak from one spike to another, and inconsistent evidence of spike propagation from posterior and mid temporal regions to the anterior-mid temporal zone. The interictal spikes in this patient’s case were too complex for EMSI using the ECD model. Patient 6 had 227 high amplitude right posterior inferior temporal spikes with a vertical dipolar distribution compatible with a posterior basal temporal neocortical source (Figure 1D).

Figure 1: Interictal spike foci in patients 1 (A), 2 (B), 4 (C), and 6 (D). Each panel shows at left the ECD solution obtained from EMSI of averaged spikes (patient 1, n = 139; patient 2, n = 64; patient 4, n = 25; patient 6, n = 227; ball = dipole source maximum, tail = direction of current flow), and the MEG magnetometer flux (red = magnetic flux out of the head, blue = magnetic flux into the head) and EEG voltage (red = electropositive, blue = electronegative) field distributions. Each panel shows at right three representative interictal spikes in common average reference (top) and bipolar (bottom) montages. Filter bandpass for EEG examples = 1–70 Hz; bandpass for ECD modeling = 1–30 Hz.
Ictal Events
Patient 1
One of the patient’s typical seizures was recorded, marked by a sense of déjà-vu and panic, evident in EEG over the right anterior temporal region, lasting 46 s, not readily apparent to visual analysis in MEG (Supplementary Figure 1). MEG beamformer analysis showed two main ictal foci, one in the anterior hippocampus/parahippocampal gyrus and the other in the insula. Given normal brain MRI and the clinical and MEG features suggestive of insular involvement, unilateral sEEG was acquired from nine depth electrodes (Supplementary Figure 2), documenting ictal onsets in the anterior hippocampus and adjacent parahippocampal gyrus, with seizure propagation to the insula (Supplementary Figure 3). Figure 2A–E shows a segment of rhythmic ictal iEEG activity, location of the maximally involved sEEG contacts, the MEG topoplots, and the ictal beamformer solutions. The distance from the mesial temporal beamformer focus to the hippocampal and parahippocampal sEEG contacts was within 1.5 and 1 cm, respectively (Table 1). The distance from the insula focus to the insular sEEG contacts was farther, 2.5–3 cm, although the single insular depth electrode implantation limited sEEG contacts to record mainly in the region of the anterior insula, which may have been slightly forward of the maximal region of propagated ictal activity, judging from the sEEG pattern and the beamformer localization in the mid-posterior insula.

Figure 2: Beamformer localization of SOZ in MTLE patients. (A–E) Patient 1; (A) Ictal sEEG recording, late stage of seizure (see also Supplementary Figure 3). Electrode labeling indicates target of deepest contacts (lowest numbers): AM = amygdala, AHC = anterior hippocampus, PHG = parahippocampal gyrus, PHC = posterior hippocampus, AINS = anterior insula, OFC = orbitofrontal cortex, ACC = anterior cingulate cortex, MCC = mid cingulate cortex, SMA = supplementary motor area. (B) Most active sEEG contact locations. (C) Topoplots corresponding to the most active ictal MEG frequencies. (D) Beamformer solution in the right parahippocampal gyrus. (E) Secondary beamformer solution in the right insula. (F) Topoplots corresponding to the most active ictal MEG frequencies in patient 2. (G) Topoplots corresponding to the most active ictal MEG frequencies in patient 3. (H) Ictal beamformer solution in the right hippocampus/parahippocampal gyrus, patient 2. (I) Ictal beamformer solution in the left parahippocampal gyrus, patient 3.
Compared to the interictal spike source localization, the mesial temporal ictal beamformer focus was situated 1.2 cm away from the right parahippocampal interictal source maximum obtained with ECD EMSI (Table 1; Figures 1A and 2D). Comparing the ictal and interictal source solutions in a different fashion, one can assess how closely, at a percentile level, the interictal EMSI localization overlaps with the ictal BPC solution. In this case, the interictal EMSI solution was located within the top 1% of the ictal BPC distribution (Table 1).
A right AMTR resulted in a seizure-free outcome.
Patient 2
Seven of the patient’s typical right temporal seizures were recorded, with no clinical manifestations apart from arousal from sleep in some events (Supplementary Figure 4A). MEG beamformer analysis showed a right hippocampal/parahippocampal source (Figure 2H).
In this patient with “classical” anterior temporal interictal spikes, localized by ECD EMSI to anterolateral temporal neocortex (Figure 1B), the interictal ECD solution was far (4.3 cm) away from the mesial temporal ictal beamformer solution (Table 1; Figures 1B and 2H).
Given MRI evidence of unilateral right hippocampal sclerosis and the ictal MEG localization, and with the knowledge that distant anterolateral temporal neocortical spikes are a common finding in MTLE, Reference Wennberg and Cheyne2–Reference Wennberg, Valiante and Cheyne4 iEEG was not performed. A right AMTR resulted in seizure freedom.
Patient 3
Four subclinical electrographic seizures were recorded over the left temporal region, each lasting ∼20 s (Supplementary Figure 4B). The ictal MEG source reconstruction localized to the left parahippocampal gyrus using both DICS at 6 Hz and unfiltered LCMV (Figure 2I). DICS at 5 Hz was associated with a secondary area of activation in the ipsilateral insula. No definite interictal epileptiform activity was recorded.
Given MRI evidence of unilateral left hippocampal sclerosis and the ictal MEG localization, iEEG was not performed. A left AMTR resulted in seizure freedom.
Patient 4
Brief left temporal subclinical seizures and rhythmic ictal-like bursts were recorded with an EEG frequency of approximately 10 Hz. In addition, a single interictal spike focus was identified and modeled, with an EMSI ECD solution localized to the left superior temporal gyrus (Figure 1C). The MEG ictal topoplots suggested a very robust (same pattern across many frequencies) focal source, and the DICS beamformer solution at 10 Hz showed a nearly identical location to the interictal EMSI solution (Table 1; Figures 1C and 3D).
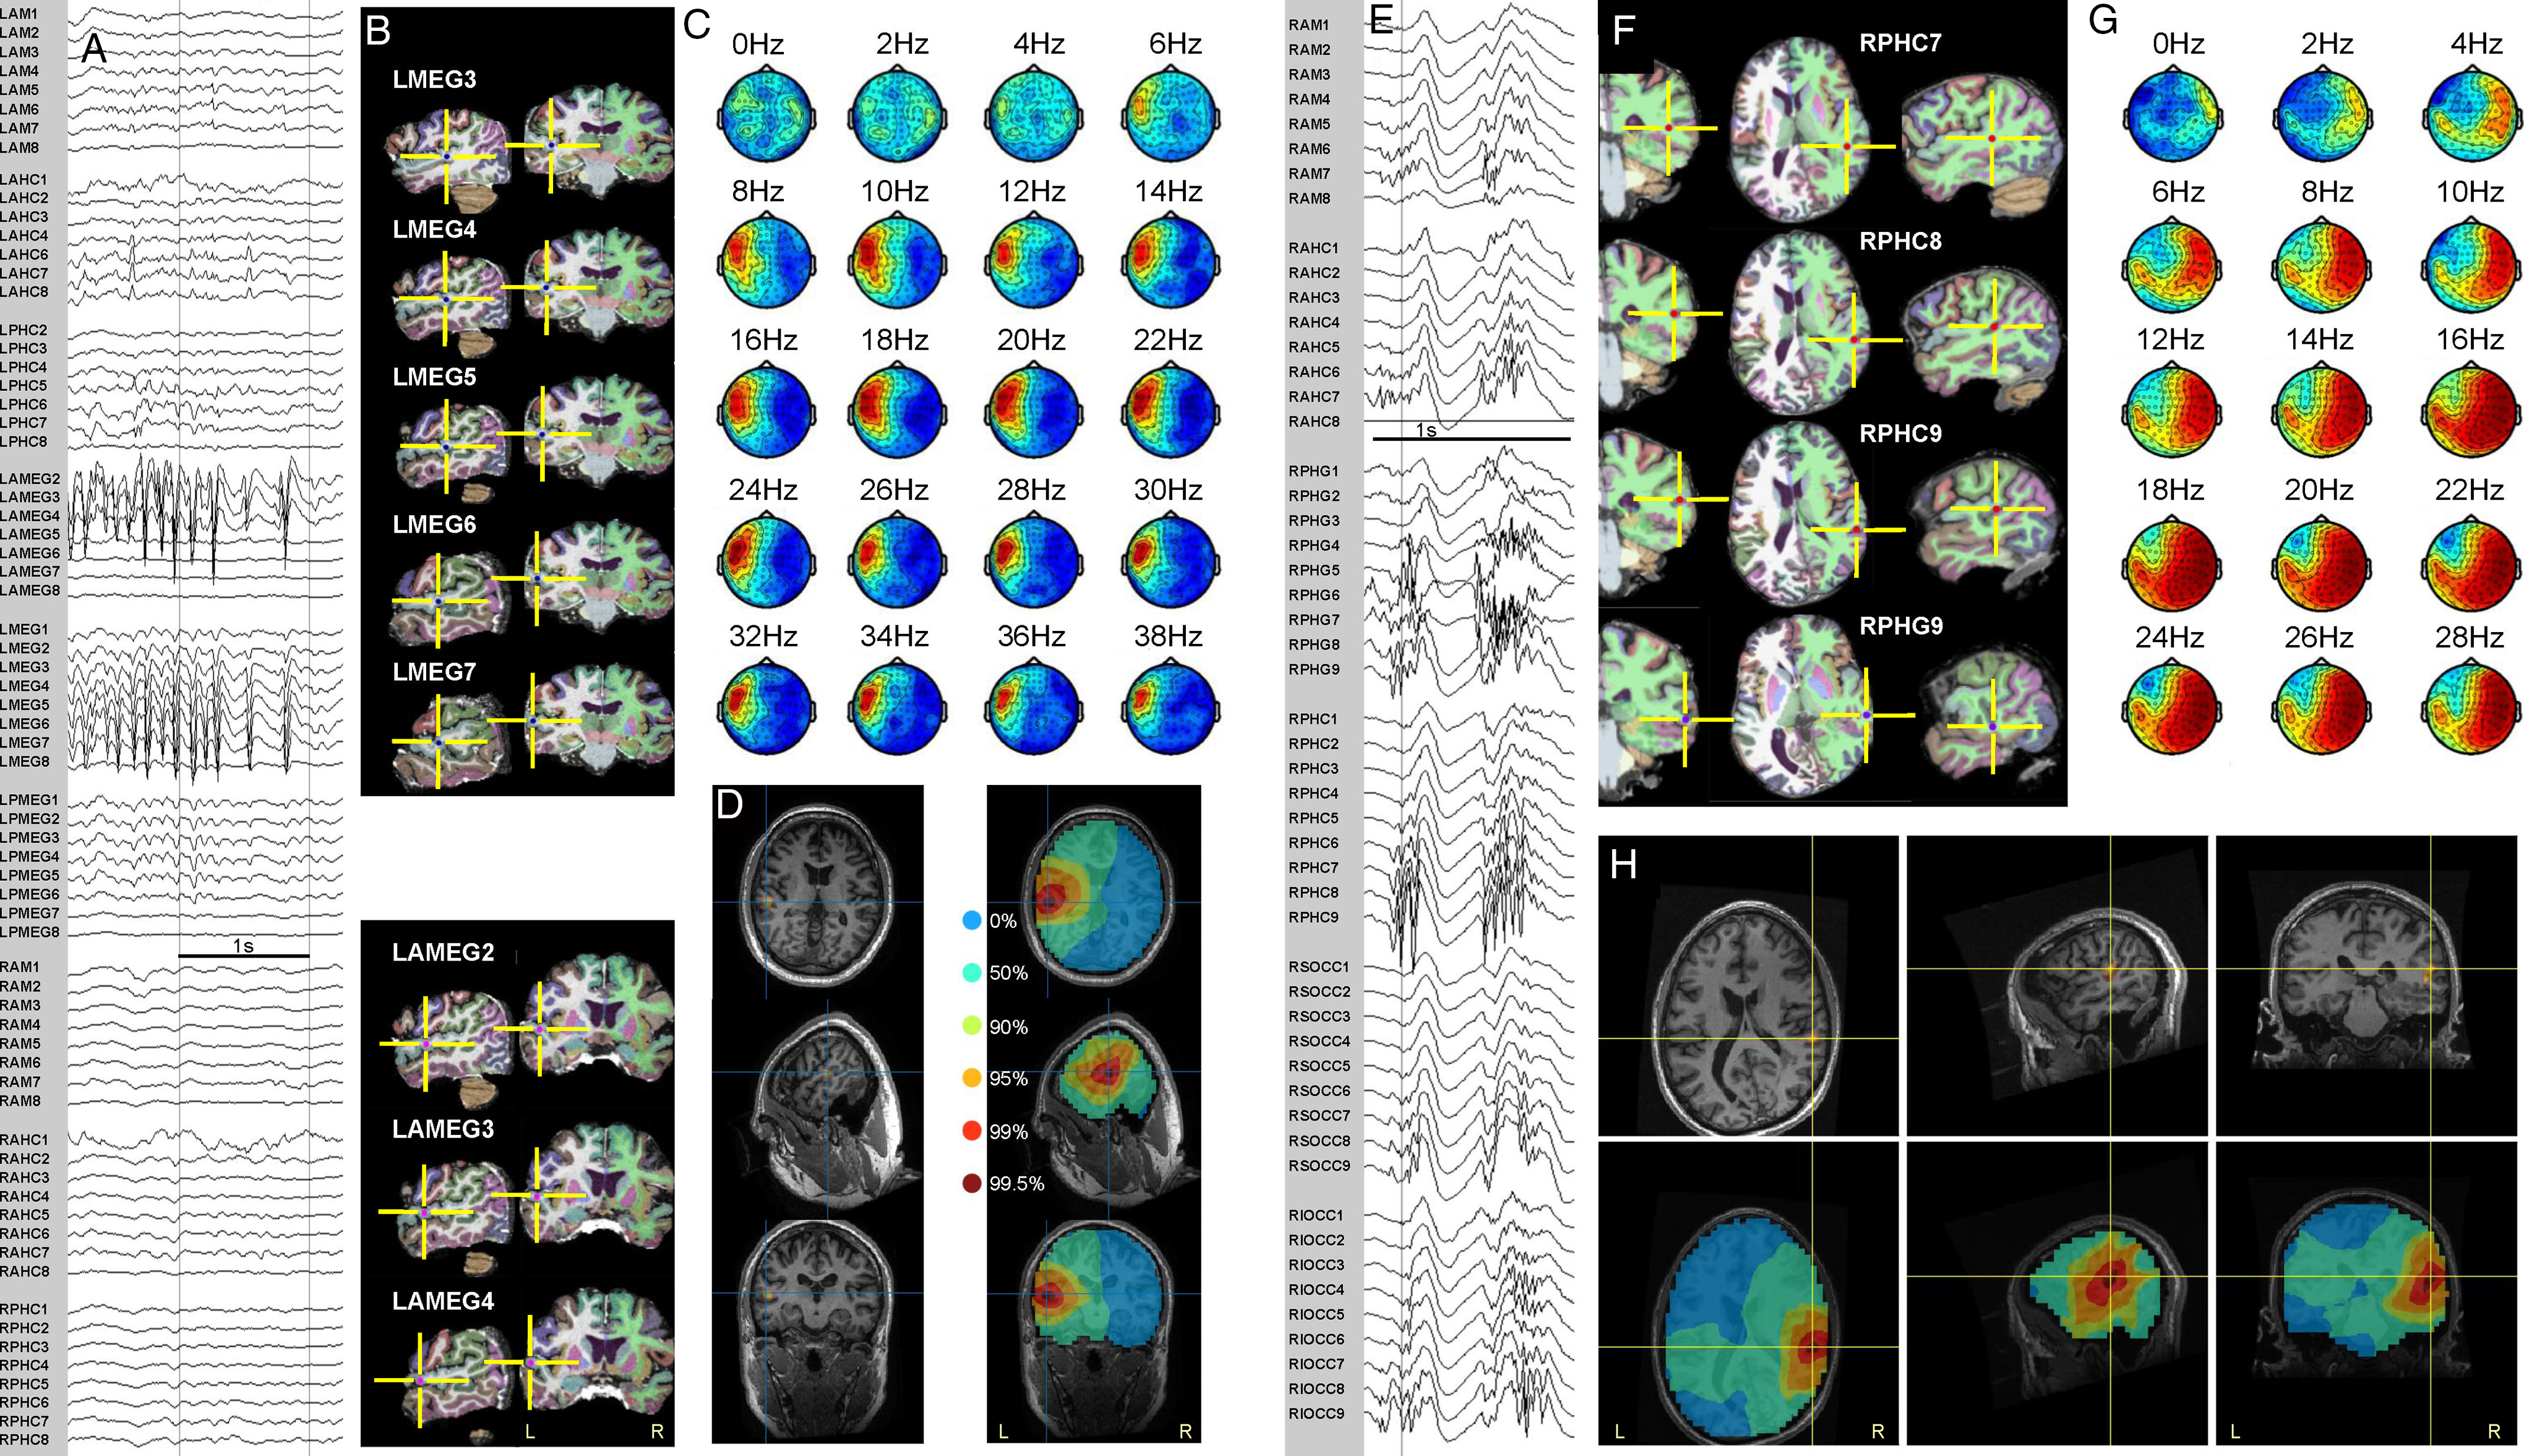
Figure 3: Ictal MEG beamformer localization and sEEG in temporal neocortical epilepsy patients. Patient 4 (A–D). Patient 5 (E–H). (A) Intracranial recording of a seizure. (B) Most active sEEG contact locations. (C) Topoplots corresponding to active ictal MEG frequencies. (D) Beamformer solution maximum in left superior temporal gyrus (left); unthresholded BPC by percentile levels (right). (E) Intracranial recording of a seizure. (F) Most active sEEG contact locations. (G) Topoplots corresponding to active ictal MEG frequencies. (H) Beamformer solution, thresholded (top) and unthresholded (bottom), in right middle temporal gyrus, superior to schizencephalic cleft. Intracranial electrode labeling, except for electrodes labeled MEG or OCC, indicates target of deepest contacts (lowest numbers): AM = amygdala, AHC = anterior hippocampus, PHG = parahippocampal gyrus, PHC = posterior hippocampus, AMEG = anterior MEG (targeting anterior to MEG beamformer solution), MEG = MEG beamformer solution (targeted directly), PMEG = posterior MEG (targeting posterior to MEG beamformer solution), OCC = occipital, S = superior, I = inferior, L = left, R = right.
The sEEG implantation was partially guided by the MEG/EMSI solutions but also included additional bitemporal coverage (Supplementary Figure 2). Ictal events were recorded maximally at sEEG contacts situated very close to the beamformer location (Figure 3A–D; Table 1).
Patient 5
Multiple brief polyspike bursts were recorded, 0.2–3.5 s in duration, typically with a 20–30 Hz beta maximum, occasionally evolving into a rhythmic ictal alpha frequency pattern maximal over the right posterior/basolateral temporal region. These rhythmic discharges were beamformed with DICS over the band 16–24 Hz. No valid ECD solution could be obtained from modeling the complex, propagating interictal spike focus in the same region. Fifty-two sEEG contacts were implanted in the right hemisphere (Supplementary Figure 2), partially guided by the ictal MEG solution. Particularly active sEEG contacts were located in the middle temporal gyrus, within 0.3–1.4 cm of the beamformer solution (Figure 3E–H; Table 1).
Patient 6
Abundant right posterior temporal rhythmic sharp wave activity was recorded. DICS and LCMV beamformer solutions using a variety of frequencies were quite robust, with occasional inferior mislocalizations ≤1 cm into the cerebellum. We selected the DICS at 8 Hz as a representative and plausible solution. Intraoperative ECoG confirmed that the beamformer solution was included in the area of the most active electrode contacts (Figure 4), and surgical resection of the area resulted in seizure freedom.
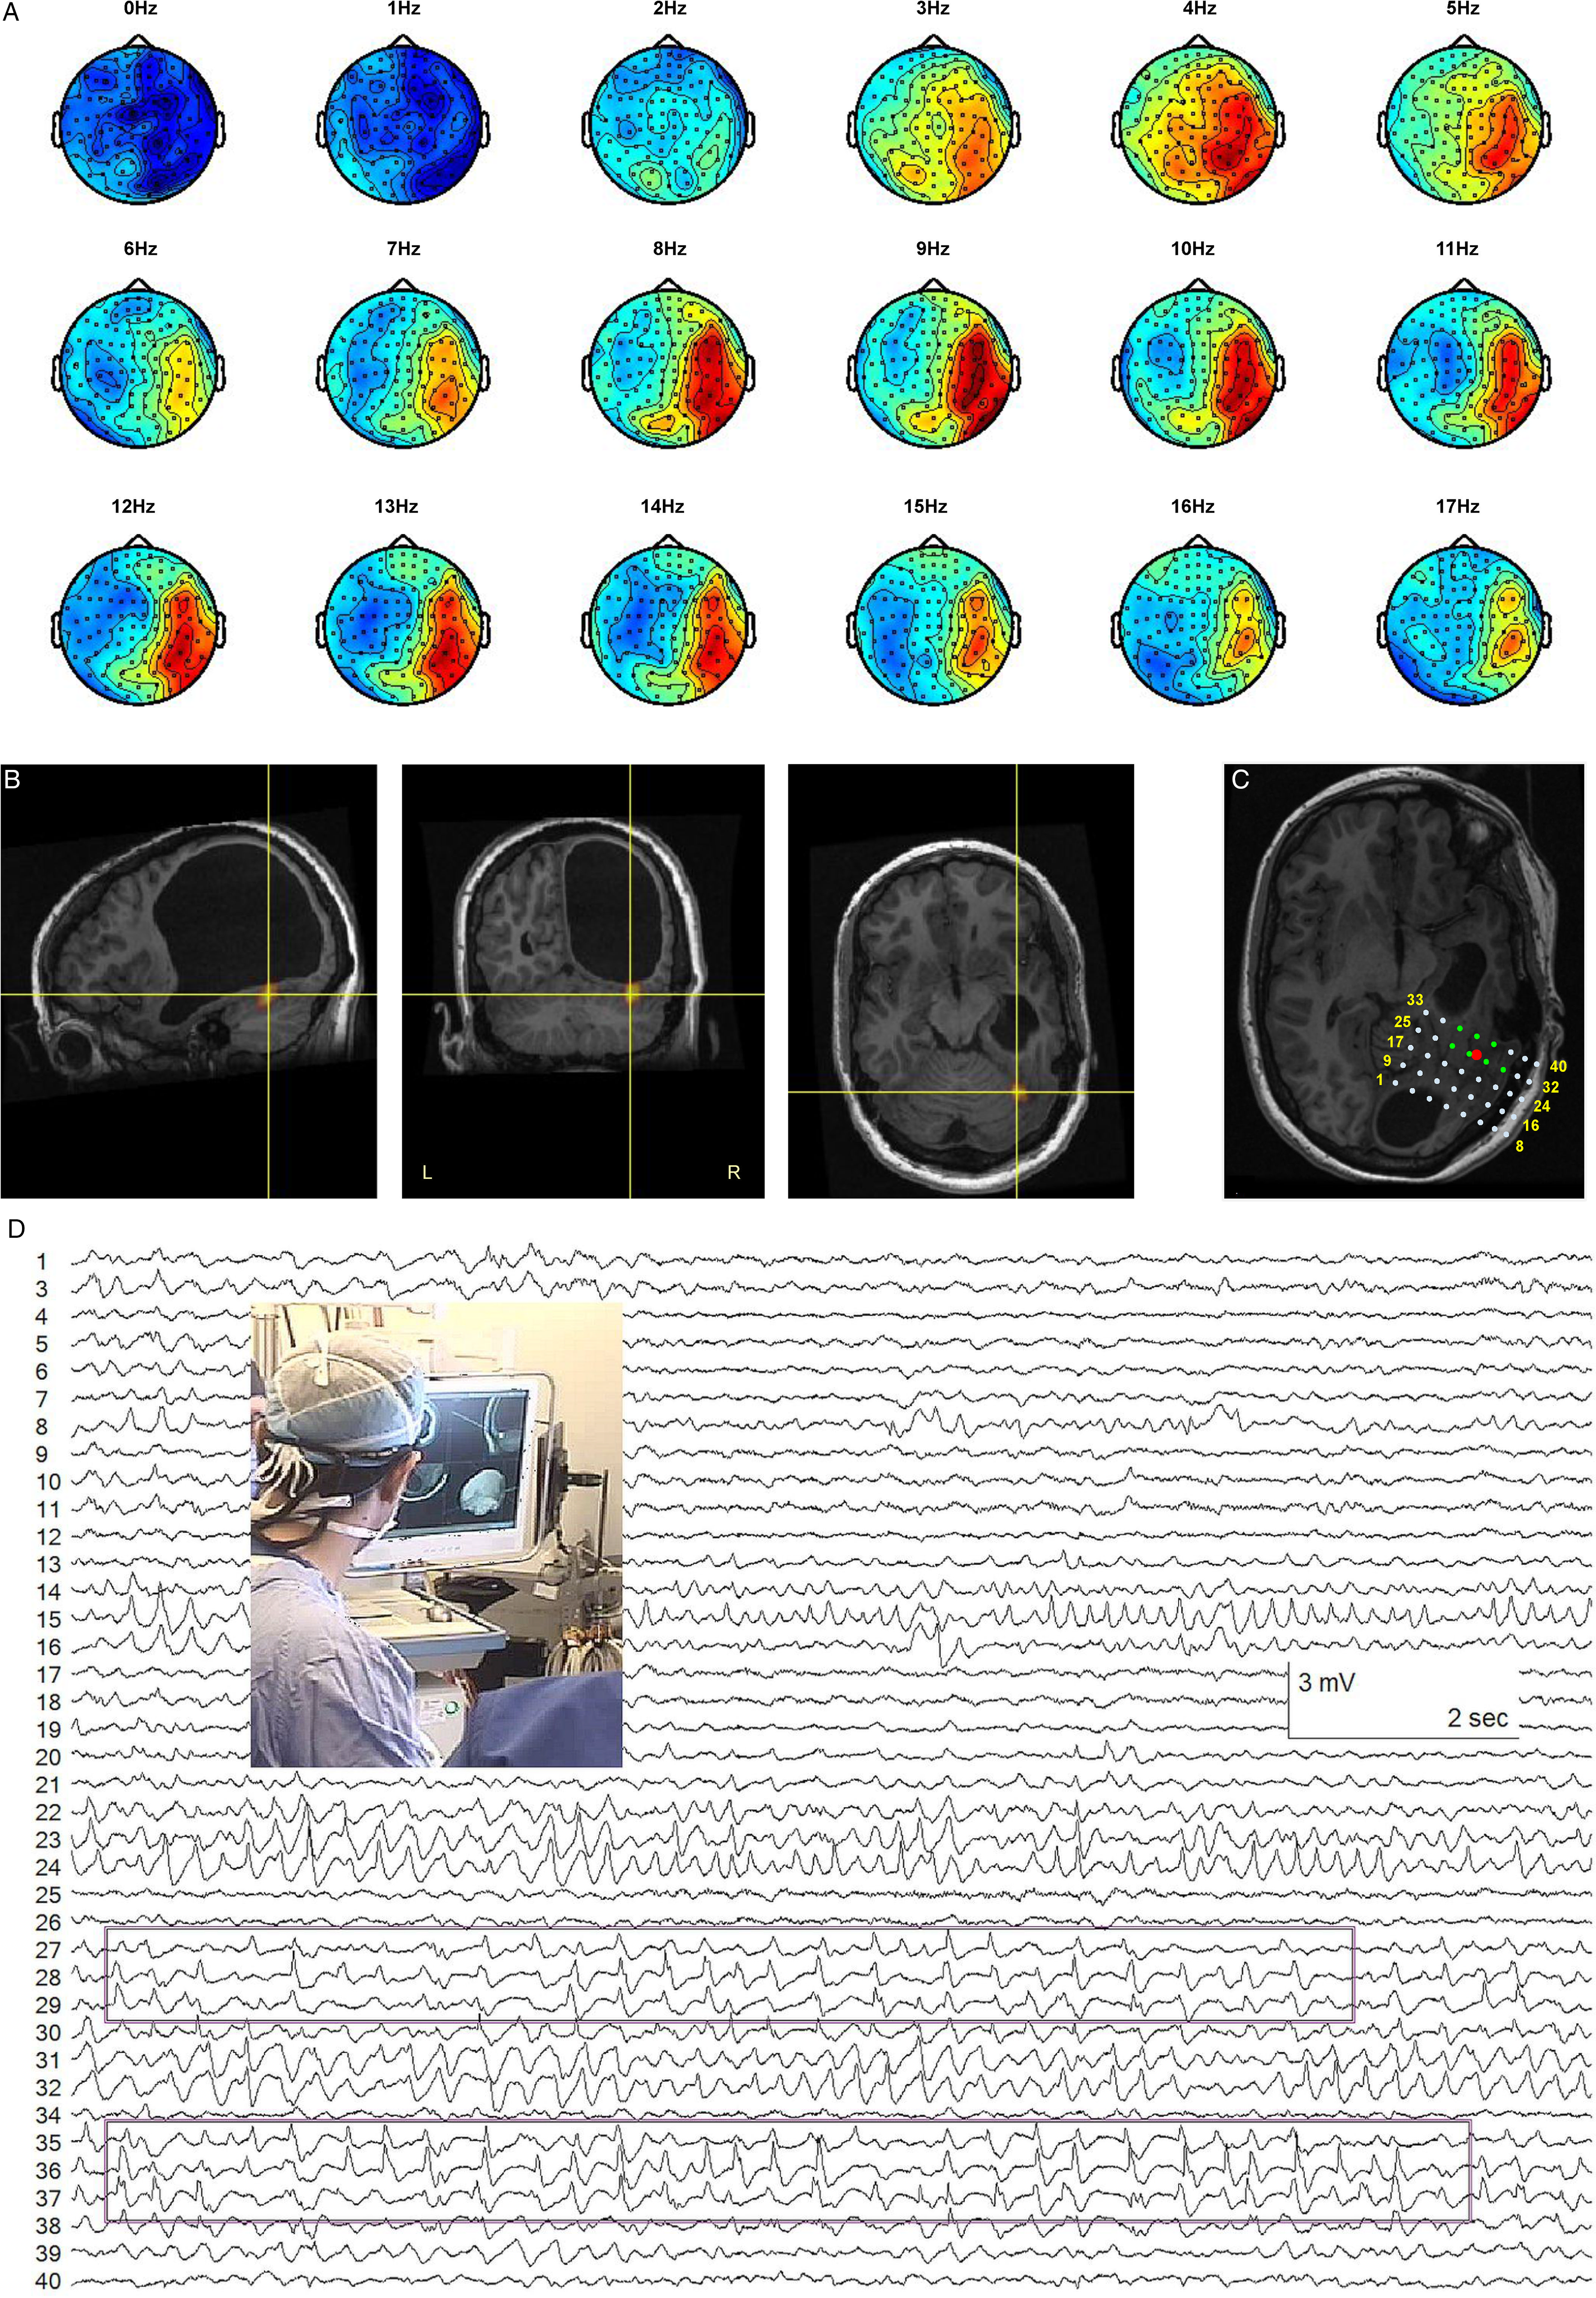
Figure 4: Ictal MEG beamformer localization and ECoG. Patient 6. (A) Topoplots corresponding to the rhythmic MEG sharp wave activity. (B) Beamformer source localization in basal temporal neocortex, below porencephalic cyst. (C) Representation of the position of the subdural ECoG grid. The contacts in green were most active during the intraoperative recording. The red dot is the position of the MEG beamformer solution. (D) Sample of ECoG recording with the most active contacts highlighted and a picture of the operating room setting where the beamformer solution is guiding the surgery.
In this case, EMSI of the patient’s interictal spikes returned an ECD solution 0.6 cm from the MEG ictal beamformer focus, at the 99.95 percentile level of the BPC solution (Table 1; Figures 1D and 4B).
Other Patients with Temporal Lobe Ictal Events
Among the 13 other patients with temporal lobe ictal events during their MEG-EEG recordings, 10 had neocortical ictal beamformer solutions in different gyri (seven unilateral, three bilateral independent), and two had hippocampal ictal beamformer solutions (one patient with ipsilateral hippocampal sclerosis, and one patient with an ipsilateral posterior orbitofrontal pleomorphic xanthoastrocytoma abutting the supraclinoid carotid, anterior and middle cerebral arteries). No beamformer solution could be obtained in one patient due to excessive head movement.
Discussion
This report demonstrates the suitability of presurgical MEG beamformer analysis of ictal events in TLE, which can supersede or complement traditional analysis of interictal spikes. Beamforming also extends the number of events for analysis to include rhythmic sharp waves, polyspikes, and small ictal-like bursts. Reference Wennberg, Tarazi, Zumsteg and Garcia Dominguez29,Reference Swinkin, Lizárraga and Algarni30 In our experience to date, we have been able to apply the beamforming method in a significant minority (approximately 25%) of our presurgical evaluation cases, extratemporal and temporal combined, usually with plausible results (based on localization around the site of structural lesions or previous resection margins, or localization concordant with focal clinical seizure semiology; see Supplementary Figure 5 for examples of left mid-posterior superior temporal gyrus localization in patients with early ictal aphasia), and/or with iEEG confirmation in a number of extratemporal cases.
Our goals in presenting just a small number of TLE cases selected from our overall pool of ictal MEG recordings were (a) to show only cases with definitive means of localization confirmation and (b) to present TLE patients apart from extratemporal patients, because of the neuroanatomical and neurophysiological distinctiveness of the temporolimbic system in epilepsy. With respect to the latter goal, the demonstration of robust seizure localization within deep structures in the MTLE patients is of particular relevance. The ability to localize discretely hippocampal and parahippocampal gyrus seizures using MEG is, to our knowledge, something that has not been convincingly demonstrated previously, and is of obvious clinical importance.
It has been shown that pathological interictal spikes limited entirely to the hippocampus in patients with TLE cannot be “seen” in the unaveraged extracranial EEG or MEG signal and that ECD modeling of visible extracranial EEG and MEG spikes may falsely localize an extended temporal neocortical source to a deep-seated location in or near the hippocampus. Reference Wennberg and Cheyne2–Reference Wennberg, Valiante and Cheyne4 A proviso in this regard is that benign hippocampal spikes with a longitudinally extended source generator may be detected extracranially with EEG or MEG, the different extent of the hippocampal source generators in the two conditions thought to be responsible for the extracranial differences in appearance of the volume-conducted far fields. Reference Wennberg, Tarazi, Zumsteg and Garcia Dominguez29 On a background of these interictal inverse modeling issues, it is reasonable to wonder whether the ictal MEG beamforming method could be similarly vulnerable to providing false, deep hippocampal source localizations for ictal activity generated in an extended, superficial region of temporal neocortex. Certainly, the prominent rhythmic ictal activity visible in the EEG plus or minus MEG signal in these patients, which allowed for identification of the ictal events, cannot easily be attributed to a deep, focal hippocampal ictal discharge, and most likely represents, at least in part, propagation of ictal activity to temporal neocortical areas. However, in comparison to interictal spikes, mesial temporal lobe seizure onsets have a much larger temporal and spatial extent, which should produce a much better signal-to-noise ratio. Moreover, mesial temporal lobe onset seizures recorded with iEEG typically remain of fastest frequency, highest amplitude, and greatest organization in temporolimbic structures even after propagation to overlying neocortical regions. The relative distribution of mesial versus neocortical ictal activity in seizures recorded with sEEG in patient 1 is demonstrated in Figure 5. The higher amplitude (and correspondingly higher power), and greater organization of the multiple ictal frequency components within the mesial temporal structures, as compared to the overlying temporal neocortex, is readily apparent. This ictal situation is very different from the intracranial amplitude distribution of classical anterior temporal lobe interictal spikes, where the spike amplitude maximum is located entirely within the anterolateral temporal neocortex, with only a low amplitude volume-conducted far field present in the underlying mesial temporal region (see references Reference Wennberg and Cheyne2,Reference Wennberg and Cheyne3 and figures therein).
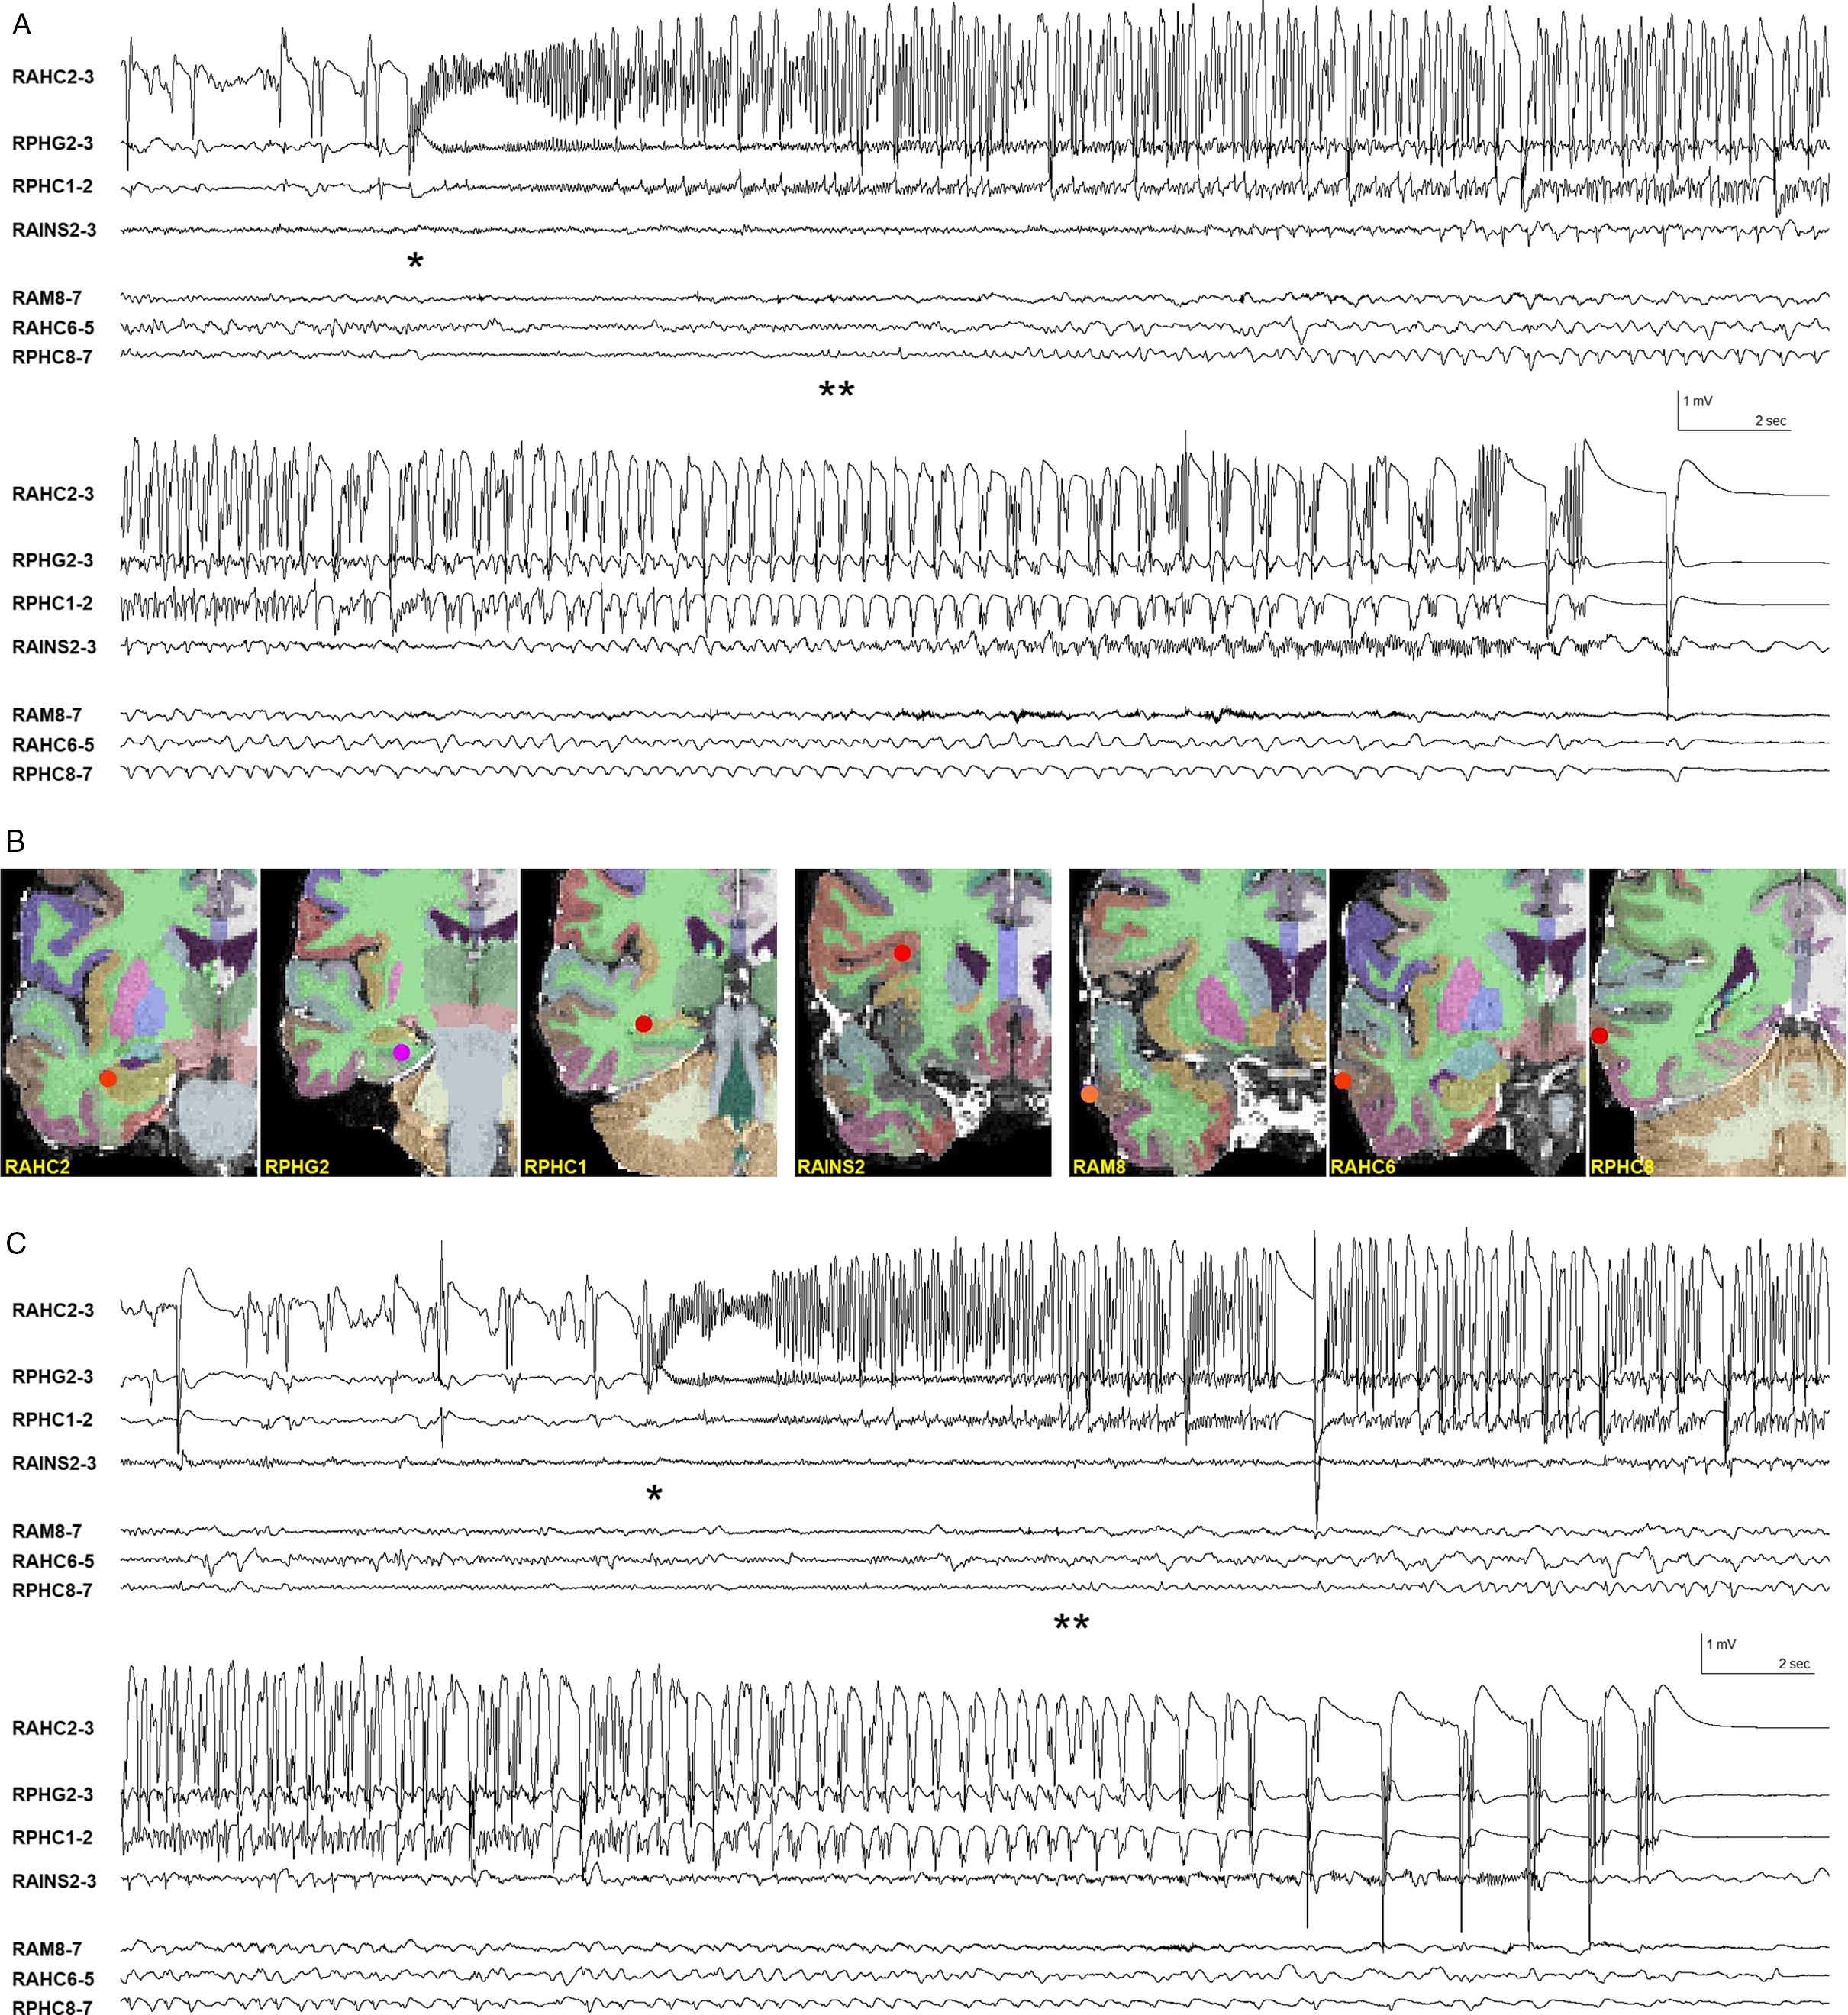
Figure 5: Mesial versus neocortical ictal activity in sEEG recordings in MTLE patient 1. (A) Mesial temporal ictal onset at *, later appearance of low amplitude rhythmic ictal activity in most involved temporal neocortical depth electrode contacts at **. Same seizure as shown in Supplementary Figure 3. (B) Location of relevant mesial and neocortical depth electrode contacts. Electrode labeling indicates target of deepest contacts (lowest numbers): AM = amygdala, AHC = anterior hippocampus, PHG = parahippocampal gyrus, PHC = posterior hippocampus, AINS = anterior insula. R = right. (C) Different seizure, next day. Mesial temporal ictal onset at *, later appearance of low amplitude rhythmic ictal activity in temporal neocortical depth electrode contacts at **. Bipolar derivations of adjacent sEEG depth electrode contacts. Filter bandpass = 1–50 Hz.
We speculate that the ictal MEG beamformer method detects the region of maximal BPC in mesial temporal SOZs due to their relatively extended spatiotemporal sources and the greater power of the rhythmic ictal activity in the mesial temporal structures, as shown in Figure 5. Among the 18 total patients with temporal lobe ictal events in whom we were able to successfully apply the beamformer method, only five showed mesial temporal ictal source localization, and the ictal results were either confirmed or plausible in all cases (in the two patients not in this case series, one had ipsilateral hippocampal sclerosis and the other a medially situated tumor abutting the anteromedial temporal region). That a majority of extracranially evident temporal lobe ictal events do not localize to the mesial temporal region using the MEG beamformer method provides indirect evidence against a general propensity of the method toward deep mislocalization. Supplementary Figure 5A shows an example of a high amplitude, low-frequency ictal discharge visible extracranially with a clinically plausible ictal beamformer solution within the neocortex of the superior temporal gyrus. Furthermore, we have not obtained ictal beamforming results localized medial to the mesial temporal structures, for example, in the brainstem, even though the source solution space includes deep medial, nonhemispheric structures in the grid. In contrast, deep mislocalizations to brainstem (or even contralateral hemisphere) are common when modeling individual temporal neocortical interictal spikes. Reference Wennberg and Cheyne2,Reference Wennberg and Cheyne3 Despite the above arguments, however, we acknowledge that more patients with mesial temporal ictal source solutions and iEEG confirmation are needed before we can feel totally confident that ictal beamforming using MEG is able to reliably detect mesial temporal SOZs.
The beamformer analysis method is proposed for use on any type of epileptiform activity, without any constraint on the activity’s temporal structure (unlike interictal spikes). As such, the ictal beamformer source reconstruction results may or may not localize to the same location as a patient’s interictal spike focus/foci. In MTLE, it is particularly common that the locations of interictal spike foci and a patient’s SOZ do not coincide. Reference Wennberg and Cheyne2–Reference Wennberg, Valiante and Cheyne4 In the series of patients presented here, we have shown instances where interictal and ictal analyses agreed in their localization, and one (MTLE) case where the interictal and ictal solutions were far apart. This is the nature of some epilepsies and the source localization results are in no way contradictory; instead, they simply represent the fact that the beamformer analysis is applied directly to ictal events. Another clear advantage of the method is in cases in which interictal spikes are absent in MEG–EEG recording, or too complex for traditional dipole or distributed source modeling (as in two of the patients in our series).
The ictal beamformer localizations showed good agreement with the gold standard iEEG. This is partly a consequence of surgical implantation planning having included the beamformer solutions; however, in all cases some of the most active iEEG contacts were located within 1 cm of the BPC peak, a correlation that would not be achieved if the solutions were inaccurate. Moreover, iEEG was not restricted to the beamformer solution areas and typically covered a large brain volume.
It is necessary to acknowledge that a known limitation of beamforming is that solutions can be inaccurate if multiple sources are simultaneously active and correlated to some degree. Reference Belardinelli, Ortiz and Braun33 Thus, in seizures suspected to be multifocal or widespread a note of caution should be added. In patient 1, two separate active foci were successfully discriminated, but this is not necessarily always possible.
In addition to the limitation in application to seizures that are focal in character (or multifocal with low correlation), there are assumptions regarding the spatiotemporal evolution of the ictal events that must be kept in mind. The method can miss the SOZ in cases with rapid ictal propagation to involve a larger area or multiple locations, Reference Badier, Bénar and Woodman19 something we have seen in a minority of extratemporal, frontal lobe cases similarly analyzed and contrasted with iEEG.
The natural trend in the development and application of diagnostic methods in epilepsy and EEG-MEG is toward an increased automatization and more independence from user input. However, in our proposal, and especially when intended for presurgical planning, it is key to integrate, rather than overlook, clinical expertise. Clinical guidance on a case-by-case basis is necessary from the initial phase of the analysis, when identifying and selecting events or identifying spatial and temporal differences in ictal features, to the last part of the analysis, evaluating the plausibility of the solution in the clinical context. The proposed beamforming method is not meant to reveal a patient’s SOZ in the absence of a clinical neurophysiologist’s rigorous investigation of the raw EEG and MEG signal. Instead, it is meant to supplement the clinical interpretation and provide a finer level of localization – to a particular gyrus or sulcus, or to temporolimbic structures – than could otherwise be achieved. In a majority of our ictal beamforming cases, temporal and extratemporal, MEG ictal source reconstruction results have seemed clinically plausible, correlating well with MRI abnormalities and/or focal semiological features. The detailed analyses of the TLE patients presented here, each with ground truth SOZ localizations, provide objective evidence to increase our confidence in ictal MEG source localization results acquired in the absence of ground truth. Nevertheless, although the beamformer tool we present is a valuable one, it is fallible, and its application is dependent on clinical supervision.
Supplementary Material
To view supplementary material for this article, please visit https://doi.org/10.1017/cjn.2022.1.
Acknowledgements
We are extremely grateful to Nat Shampur and his team of neurophysiology technologists for expert technical assistance. Victoria Barkley performed the intracranial electrode position reconstructions.
Conflict of Interest
The authors have no conflicts of interest to declare.
Statement of Authorship
LGD and RW conceived the study and wrote the manuscript. LGD, AT, and RW acquired and reviewed the EEG-MEG data and prepared the figures. LGD originated the ictal beamforming method and performed the beamforming analyses. Interictal EMSI analyses were done by RW. TV performed the iEEG electrode implantations and surgical resections. All authors critically reviewed the manuscript and approved the final version.


 Open access