


Introduction
In recent years, scholars have become increasingly interested in competition between the branches of the U.S. federal government, particularly between Congress and the president (Acs Reference Acs2019; Bailey, Kamoie, and Maltzman Reference Bailey, Kamoie and Maltzman2005; Canes-Wrone Reference Canes-Wrone2010; Chiou and Rothenberg Reference Chiou and Rothenberg2014; Christenson and Kriner Reference Christenson and Kriner2017; Clinton, Lewis, and Selin Reference Clinton, Lewis and Selin2014; Howell and Pevehouse Reference Howell and Pevehouse2005; Lewis Reference Lewis2004). While the U.S. federal government’s separation of powers into legislative, executive, and judicial branches generates interbranch competition over policy, few attempts have been devoted to examining the relative policymaking power of these branches or to which branch the agency is most responsive (Rosenbloom Reference Rosenbloom2000).Footnote 1 The constitutional separation of powers cannot be understood without considering the relative influences of the president and Congress. Independently from the appointment power, the federal rulemaking process provides all three branches with influence. Rulemaking offers an opportunity to uncover the relative influence of the president and Congress when the preferences of each are at odds and how that influence hinges on the significance of the matters under consideration.
Federal rulemaking is an important component of policymaking in the United States, and there is little Americans consume that is not regulated by federal agencies. According to the Federal Register, thousands of final rules are published each year, having general applicability and legal effect (U.S. Government Publishing Office 2019). For example, RIN 2060-AR33, known as the Clean Power Plan, was one of the core climate change policies of the Obama Administration (Hogan Reference Hogan2019; Plumer Reference Plumer2015). As presidents turn more attention to policymaking through rulemaking, the federal rulemaking process in the United States has become a matter of increasing concern to scholars (Acs Reference Acs2019; Nou Reference Nou2012; Potter Reference Potter2017; Yackee and Yackee Reference Yackee, Yackee, Provost and Teske2009b). Gaining a fuller understanding of contemporary U.S. government requires closer study of rulemaking as a form of agency policymaking, due to the extensive reach of these policies.
While final rules promulgated by agencies address diverse topics, the breadth of issues handled through the rulemaking process creates high variation in regulatory significance. In contrast with noteworthy rules like the Clean Power Plan, many other rules are routine in nature and minimally influence the economy or society. For example, 3052-AD07, a rule promulgated in October 2015, changed the official address of a Farm Credit Administration field office following a relocation, which is an administrative action of minimal policy significance (Farm Credit Administration 2015).
Scholars of bureaucratic rulemaking face a concern familiar to those studying lawmaking and executive orders. The political significance of rules must be identified so that noteworthy rules may be analyzed separately from regulations which have little influence outside the federal bureaucracy. This concern has long been recognized in analyses of individual rules conducted over the last two decades (e.g., Haeder and Yackee Reference Haeder and Yackee2015; O’Connell Reference O’Connell2008; Potter Reference Potter2017; Yackee and Yackee Reference Yackee, Yackee, Provost and Teske2009b). However, a single rater (typically a binary indicator) is usually employed to differentiate significant from nonsignificant rules.Footnote 2 Many other potential raters exist that can also signal rule significance but have been overlooked historically. How to systematically integrate “sensible” raters with statistical methods, produce a continuous, reliable measure of rule significance to distinguish various degrees of significance, and allow for periodical updating for future rules is an urgent task for the literature. The creation of integrated rule significance measures would create new opportunities and offer more leeway for the study of federal rulemaking, as well as facilitate closer examination of various theoretical and empirical questions. For example, political actors tend to face resource constraints and may act strategically, hinging on various conditions, such as rule significance. The availability of a reliable measure of rule significance will permit pursuit of such questions.
We build on an existing conceptual approach to the consideration of rule significance, and identify 15 raters of regulatory significance contributed by print media as well as indicators of general regulatory activity. We apply an item response model (IRT) to these raters to generate integrated measures of rule significance for a rules universe of nearly forty-thousand federal regulations considered by both independent and executive agencies which were assigned unique Rule Identification Numbers (henceforth referred to as RINs) in the Unified Agenda (UA) between Spring 1995 and Spring 2019. The resulting measures follow in the vein of Clinton and Lapinski (Reference Clinton and Lapinski2006) and Chiou and Rothenberg (Reference Chiou and Rothenberg2014). We then demonstrate the benefits of this measure over prior measurement efforts as well as the validity of our estimates.
To illustrate the usefulness of our new measure, we apply it to study how federal agency rulemaking productivity depends on the separation of powers and rule significance. Understanding the volume and duration of the rulemaking process has been highlighted as an important matter, with implications for how the federal bureaucracy may maximize democratic responsiveness, bureaucratic effort, and good public policy (Yackee Reference Yackee2019). A contemporary analysis examining all federal agency notices of proposed rulemaking (NPRMs) found that agencies issue fewer NPRMs in the first year of a presidential term and more in the last quarter of an administration (O’Connell Reference O’Connell2008). Additionally, party control, agency independence, and divided government have an impact on overall U.S. federal rulemaking productivity. Other uncovered predictors include Office of Information and Regulatory Affairs (OIRA) audit rates, congressional or presidential opposition, agency ideology, an agency’s relationship with the president and Congress, an agency’s capacity, and the scope of an agency’s mission (Acs and Cameron Reference Acs and Cameron2013; Nou Reference Nou2012; Potter and Shipan Reference Potter and Shipan2019; Yackee and Yackee Reference Yackee and Yackee2009a). Notably, these agency-level analyses exclusively focus on those rules designated as either “economically significant” or “other significant” by agencies or those determined as “major” rules by agencies, limiting the scope of their inferences to a single indicator of importance. Our new measure of rule significance will allow us to address this problem.
The determinants proposed to explain agency productivity tend to reflect the key role of agency ideology and the relationship between agencies and executive and legislative branches. However, we lack a coherent theoretical framework in investigating how these branches influence agency rulemaking and how the relative influence of each branch depends on rule significance.
To tackle these questions, we adopt Romer and Rosenthal’s (Reference Romer and Rosenthal1979) agenda-setting model and Tsebelis’s (Reference Tsebelis2002) theory of veto players as our theoretical framework to develop competing models to examine how institutional constraints function, mainly from the president and Congress.Footnote 3 The president and Congress possess tools to pressure agencies, although they may not always be effective. The president may impose costs on undesired agency activities by diverting funds from agency programs, packing and/or emptying agency leadership, issuing binding executive orders to the contrary, and forcing agencies to submit to OIRA review (Doherty, Lewis, and Limbocker Reference Doherty, Lewis and Limbocker2019; Haeder and Yackee Reference Haeder and Yackee2015; Reference Haeder and Yackee2018; Howell Reference Howell2003; Kinane Reference Kinane2021; Mayer Reference Mayer2002). The legislature has comparable powers to impose costs (Kerwin and Furlong Reference Kerwin and Furlong2018, 30) and can resort to several legislative means of punishing rebellious agencies, including budget cuts, limitation riders, oversight hearings, reduction of statutory authority, imposition of additional paperwork, and deadlines for action (Acs Reference Acs2019; Carpenter et al. Reference Carpenter, Chattopadhyay, Moffitt and Nall2012; Lowande and Potter Reference Lowande and Potter2021; MacDonald Reference MacDonald2010).
Building on this theoretical foundation, we propose three competing models, in which the executive (the president) and legislative branches (the House and Senate medians) can each constitute the only veto players or jointly constitute veto players for a proposed rule, and we examine these models at various thresholds of rule significance. We find that the model in which the president serves as the only veto pivot best explains agency productivity for regulations laying below the political radar, while Congress has a dominant impact on rulemaking for highly significant rules. These findings identify a novel finding in the study of rulemaking which would otherwise go unnoticed, establishing that this integrated rule significance measure provides researchers with a powerful tool for investigating the processes of bureaucratic rulemaking and uncovering novel insights about interbranch competition.
Rules and Significance
What makes a policy proposal significant? This question has long been considered by scholars studying significant legislation, and those answers offer conceptual terra firma for measuring regulatory significance. Mayhew’s landmark study of congressional productivity of important legislation defined significant legislation as “innovative and consequential —or if viewed from the time of passage, thought likely to be consequential” (Reference Mayhew1991, 37). The definition of significance as a contemporaneous or retrospective judgement of consequence has been adopted and refined by later scholars (Clinton and Lapinski Reference Clinton and Lapinski2006; Edwards III, Barrett, and Peake Reference Edwards, Barrett and Peake1997; Howell et al. Reference Howell, Adler, Cameron and Riemann2000). For instance, Howell et al. (Reference Howell, Adler, Cameron and Riemann2000) stress focusing on contemporaneous evaluations because these more closely reflect the judgements of political actors when a bill was being contemplated. This establishes reliance on contemporaneous media coverage. Clinton and Lapinski (Reference Clinton and Lapinski2006, 237), building on these developments (and Mayhew’s [Reference Mayhew1991] interchangeable use of “notable” with “significant”), argue that a piece of legislation is significant “if it has been identified as noteworthy by a reputable chronicler of the legislative session.” As a result, multiple sources, including information on general bill activity in the process of estimating legislative significance (e.g., the number of substitutes for a bill), were statistically integrated into measuring legislative significance through developing an IRT.
Drawing from this approach, we consider regulations significant if identified as noteworthy by contemporaries of the regulation’s development (as noteworthiness is correlated with consequence). Based on this concept, we propose an IRT model for both dichotomous and count outcomes. This requires assembling various contemporaneous chroniclers or raters for rule significance, including print media coverage of regulations, attention paid by the public or lobbying groups, and data provided by regulatory agencies, which offer reputable assessments of noteworthiness contemporary to the development of a rule based on general regulatory activity. In particular, the federal government has created several indicators of rule significance and agencies are required to report this information in the UA. Relying on these sources, extant scholarly measures of rule significance have employed a single indicator or combined several for their measures, as detailed below (O’Connell Reference O’Connell2008; Potter Reference Potter2017; Potter and Shipan Reference Potter and Shipan2019; Yackee and Yackee Reference Yackee and Yackee2009a). With our adapted conceptual framework of rule significance, our approach subsumes existing rule significance measures as one or a subset of our raters, and expands on other potential raters. It also statistically integrates them by estimating the degree to which each rater discriminates among levels of the underlying concept and weights the raters accordingly. As a result, we provide an integrated, reliable measure of significance.
Rules Universe and Raters
Specifically, our IRT approach synthesizes 15 raters to generate significance measures for a rules universe of 39,311 federal regulations published in the Unified Agenda of Federal Regulatory and Deregulatory Actions between Spring 1995 and Spring 2019, inclusive (Chiou and Klingler Reference Chiou and Klingler2023).Footnote 4 Pursuing the argument and practice of O’Connell (Reference O’Connell2008) and Potter (Reference Potter2017), we use data from an RIN’s final UA entry for our measure as we agree that data captured at promulgation (or the end of development) best characterize the noteworthiness of the entire package represented by an RIN during its development.Footnote 5 Our justification for using this data source and additional information on our rules universe may be found in Appendix A of the Supplementary Material.
The scope of this rules universe substantially expands on prior efforts (e.g., Carey Reference Carey2019; Haeder and Yackee Reference Haeder and Yackee2015; O’Connell Reference O’Connell2008; Reference O’Connell2011; Potter Reference Potter2017; Yackee and Yackee Reference Yackee and Yackee2009a) by incorporating all rules considered by both executive and independent agencies, including rules with or without NPRMs. “Rules without NPRMs” refers to rules for which a proposed rule was never published, as well as direct final rules, and interim final rules.Footnote 6
As mentioned above, we propose 15 raters for rule significance. Drawing from and substantially expanding on previous efforts for measuring legislative and rule significance, we collected data for many more raters. We employed only the most theoretically and empirically justifiable raters related to the concept of rule significance defined above, safeguarding that the uncovered latent variable reflects that concept. In addition, we omitted raters that could reflect potential veto players’ reactions to agency rulemaking activities. These criteria facilitate interpretation of our estimates and allow our measure to be invaluable to other scholars seeking to apply them to address theoretical and empirical questions. The rest of this subsection is devoted to describing our justifications for each of these raters, leaving the discussion of how each rater is coded in Appendix B of the Supplementary Material.
Rule mentions in major newspapers reflect judgments of rule consequence and noteworthiness by contemporary chroniclers, and we count such mentions in The New York Times (NYT) and The Washington Post. NYT indicates whether an RIN was published as a proposed rule and covered in the NYT’s “National Desk” section. These data were used in Potter (Reference Potter2017) and were furnished by the author. We create the Washington Post Total rater with a Washington Post ProQuest search through a count of articles discussing an RIN during its development reported and shown in the UA. We measure editorial priorities by counting front page mentions of rules in The Washington Post to create Washington Post Front Page, following the same procedure as Washington Post Total. The length of each rule’s development varies, and journalists tend to be aware of rules while they appear in the UA. Thus, a rule with a longer development period may receive more news coverage than an equally notable rule which was developed quickly. To account for this confounder, we incorporate the number of UA issues including a rule as a control variable for these two raters.
Unfortunately, media resources are too constrained to cover the thousands of rules on the UA. As reported in Table A.5 in Appendix B of the Supplementary Material, there are, in total, fewer than two-thousand rules covered by these three newspaper raters, occupying less than 5% of the rule universe. Relying on media raters alone would lead us to fail to distinguish the significance of the rest of the rules. Building on prior efforts on legislative significance (Clinton and Lapinski Reference Clinton and Lapinski2006), we incorporate data on general regulatory activity in order to further refine highly significant rules and differentiate between moderately significant rules.
Regulatory agencies generate copious data on rules under development, reporting biannually on considered rules in the UA. UA entries identify RINs classified as “major”—judged by agencies to have an annual economic effect of $100 million or more, or to meet other criteria set by the Congressional Review Act. O’Connell (Reference O’Connell2008) uses this dichotomous indicator to determine a significant rule. We label this rater as Major. Further actions reveal agency beliefs that a rule is notable to the public. NPRMs are required by the Administrative Procedure Act to allow public comment on rules (with exceptions). Furthermore, advance notices of proposed rulemaking (ANPRMs) may be issued to gauge public opinion at earlier stages at agency discretion. The number of ANPRMs and NPRMs published for an RIN were included through the raters ANPRM Count and NPRM Count, and Hearing indicates a hearing/meeting was held on the rule.
Agencies report a rule’s priority, influenced by the RIN’s economic impact, but also determined by whether agency leaders seek action on an RIN. We identify if an RIN’s reported priority category in the UA was either “Economically Significant” or “Other Significant” as an indicator for significant rules.Footnote 7 Yackee and Yackee (Reference Yackee, Yackee, Provost and Teske2009b), Lavertu and Yackee (Reference Lavertu and Yackee2014), and Potter and Shipan (Reference Potter and Shipan2019) employ this binary indicator to determine which rule is significant.Footnote 8 Agencies also report an RIN’s inclusion in an agency’s Regulatory Plan, reflecting the most important regulatory actions expected to be proposed by an agency in a fiscal year. We label these raters as Priority and Regulatory Plan, respectively.Footnote 9
A rulemaking project’s noteworthiness may manifest itself in the legal or anticipated public response to the text of the regulation. We capture this in two ways, starting with regulation length, which arguably captures the noteworthiness of a rule through the agency’s preemptive defense of the policy. Page Count is the count of pages used by the first NPRM, direct final rule, or interim final rule published in the Federal Register for each RIN.Footnote 10 Assuming texts with the force of law which are cited more often in scholarly research are more likely to be substantively important (see Haeder and Yackee Reference Haeder and Yackee2022; Yackee and Yackee Reference Yackee and Yackee2016), we include Legal Citations, which captures the number of times an RIN is cited as visible in Hein Online’s Law Journal Library search.Footnote 11
Demands from the legislative and judicial branch for an agency to act in a policy area provide a signal of noteworthiness for a rulemaking project before it begins. We incorporate whether congressional statute set a deadline for regulatory action on the RIN (i.e., indicating somewhat urgent or intensive attention to a policy) as the rater Statutory Deadline (Lavertu and Yackee Reference Lavertu and Yackee2014). We leverage analogous information from the UA on the presence of a court-imposed deadline for action as the rater Judicial Deadline.
Finally, the procedures of notice-and-comment rulemaking generate data from the public and interest groups which captures the significance of regulations. OMB Lobbying captures the number of recorded lobbying meetings with OMB officials on the subject of a rule, as required by EO 12866. Our final rater, Public Comments, is a count variable measuring the total number of public comments attached to a rule’s docket on Regulations.gov. Table A.5 in Appendix B of the Supplementary Material provides descriptive statistics on these seven dichotomous and eight count raters. Footnote 12
New Measurement and Validation
Having introduced the raters for measuring rule significance, we will turn to present our estimates of rule significance, with the model and its estimation detailed in Appendix C of the Supplementary Material. All of the raters included in our model can discriminate rule significance, to a varying degree. The discrimination parameter of each rater is far away from zero, as displayed in Table 1. Among the raters with binary outcomes (i.e., the first seven raters in Table 1), the rater of Major performs the best, followed by the raters of Priority and Regulatory. NYT can also discriminate significance well. However, it only mentions 122 rules and covers only rules with NPRMs that were issued by executive agencies up to 2014, limiting its discriminate power. Among the raters with count outcomes, the discrimination parameters of OMB Lobbying and Washington Post Front Page are the largest.Footnote 13 The mean of these raters is not particularly larger or smaller among count raters, suggesting that these two raters are responsive to the underlying latent significance.Footnote 14
Table 1. Raters’ Discrimination and Difficulty Parameter Estimates

For a broad overview of regulatory significance across agencies, Figure 1 displays the distribution of all significance scores, and Figure 2 displays the distribution of significance scores for each of the various agencies in the dataset. There is substantial variation in the median significance across agencies as well as in the number and variation in significance scores. For example, the Department of Health and Human Services and the Department of Labor tend to work on rules which are rather noteworthy, with median significance scores of 0.419 and 0.426 (respectively), whereas the National Credit Union Administration and NASA tend to work on rules which are less significant, with median regulatory significance scores of−0.441 and−0.441. Beyond agency structure, agencies which propose fewer rules or whose regulations pertain to management practices out of public view (such as NASA) appear less likely to produce highly significant regulations.

Figure 1. Significance Distribution of Rules, 1995–2019
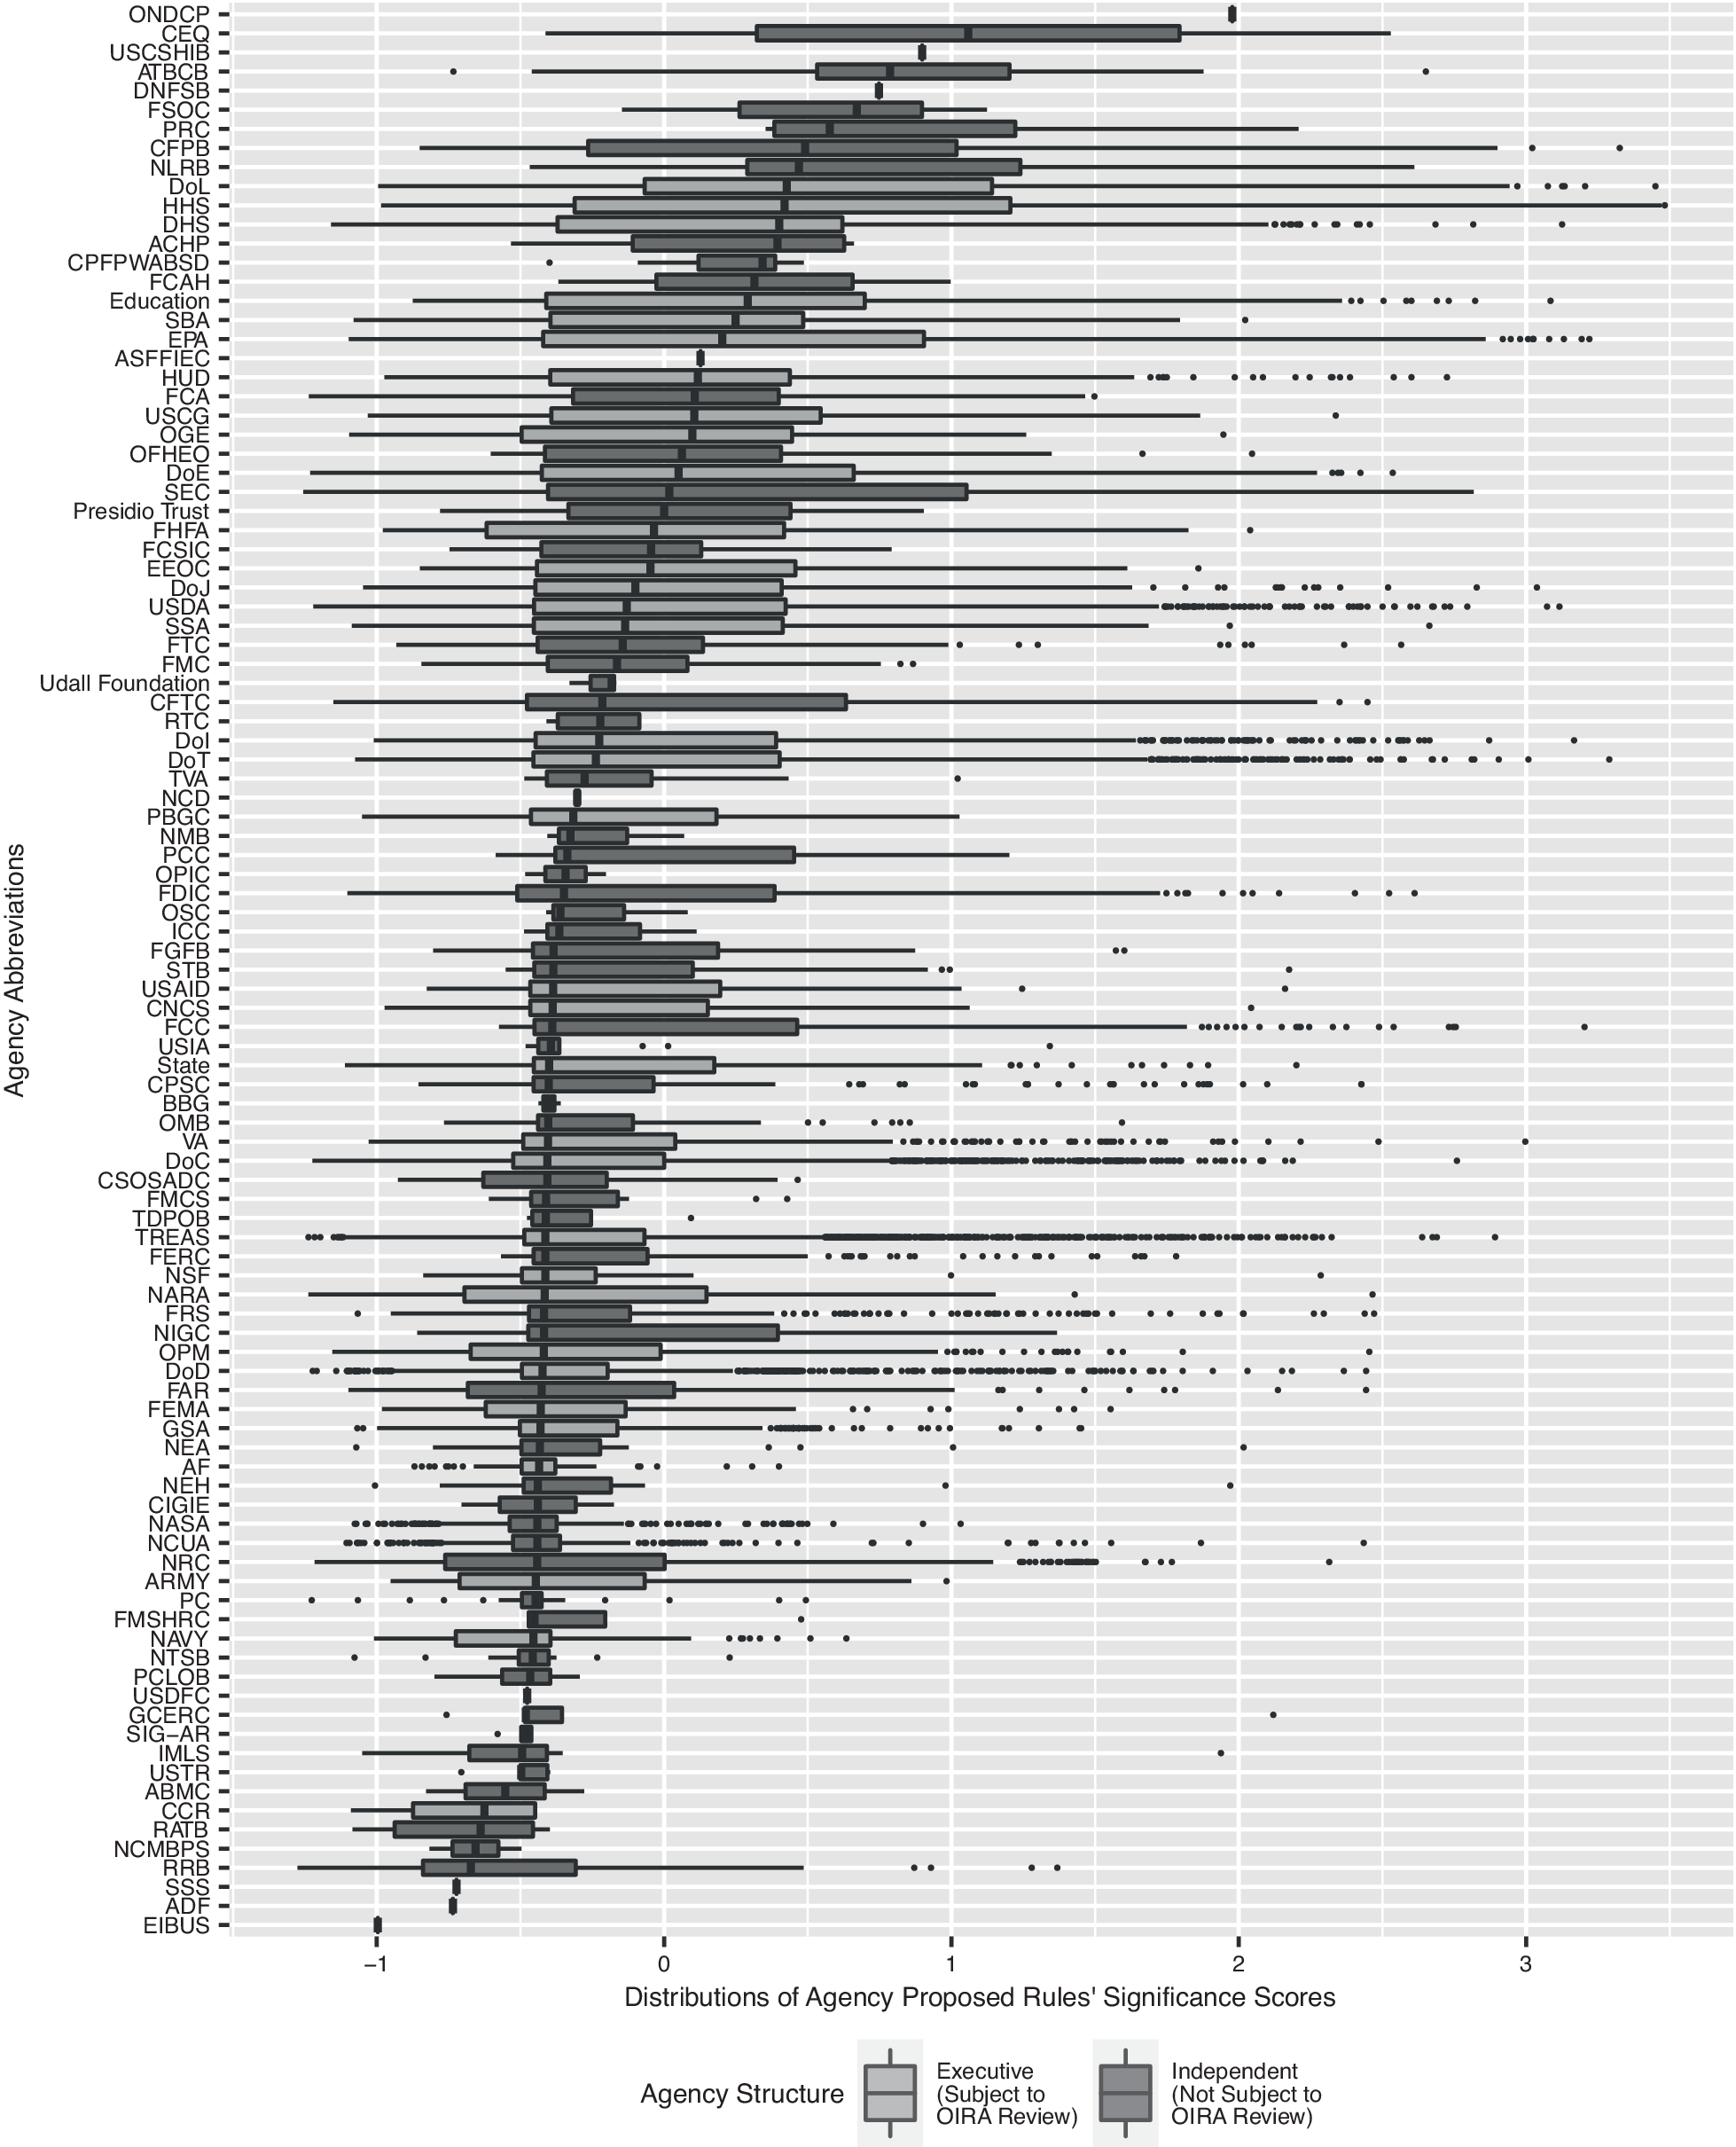
Figure 2. Distribution of Agency Significance Scores
Notes: Boxplots describe the distribution of significance scores for each agency in the dataset, sorted by median. The bounds of the box are defined by the interquartile range, and the whiskers extend from the ends of the IQR on both sides to 1.5x the IQR, or the maximum/minimum, whichever is closer. All points extending beyond 1.5x the IQR from the ends of the IQR are outliers depicted as dots. Agency abbreviations may be referenced in Table A.3 in Appendix A of the Supplementary Material.
O’Connell (Reference O’Connell2008) suggests that there may be some differences in the significance of the rules produced by independent and executive agencies. Figure 2 illustrates the distribution of regulatory significance across both executive and independent agencies. A two-tailed t-test of agency median significance during the study period by agency type reveals that the difference is not significant.
Our validity checks on our measure start with examining the correlation between our measure and existing ones. Our significance scores are particularly correlated with each agency’s reporting whether a rule is major or is rated as a priority (i.e., with a status of “Economically Significant” or “Other Significant”), with the correlation coefficients of 0.544 and 0.671, respectively.Footnote 15 When a rule is determined to be major or a priority, this does not guarantee that this rule would have high-significance scores unless some other raters simultaneously mention it or have a higher number. For example, as displayed in Figure A.1 in Appendix C of the Supplementary Material, when a rule is rated as a priority, which is employed by Yackee and Yackee (Reference Yackee, Yackee, Provost and Teske2009b) and Potter and Shipan (Reference Potter and Shipan2019) as the only indicator to determine a significant rule, our estimated significance can range from −0.435 to 3.483. This implies that when a rule is rated as a priority, we can further differentiate its significance. On the other hand, a rule not rated to be a priority can be assigned virtually any significance score.Footnote 16
Likewise, our scores are correlated with Potter’s (Reference Potter2017) impact scores by 0.487. This is not surprising, as her impact scores are obtained from four raters, two of which are incorporated into our IRT model. Our measure seems to improve on hers as the former further distinguishes rules with impact scores less than 0.6. These occupy approximately 99% of the rules included in her measure, as shown in Figure A.2 in Appendix C of the Supplementary Material. For instance, rules with impact scores around 0.3 are now stretched and can have significance scores ranging from 0 to 0.9, with evidence of clustering between 0 and 0.5.Footnote 17
In Appendix C of the Supplementary Material, we consider the most and least significant rules in our dataset, building on the convergent construct validity established in this section to provide substantial confidence in the validity of our rule significance measures.
Empirical Application
We now apply our measures to examine regulatory productivity across an array of agencies and rule significance thresholds. We first articulate a simple agenda-setting theory of agency rulemaking productivity, as motivated and justified in in the “Introduction” section, to generate a hypothesis for predicting agency rulemaking volume. We show that the supported model is dependent on the significance threshold, contributing to our understanding of how the de facto veto powers of the president and Congress apply differently based on a rule’s significance.
Theoretical Model and Hypothesis
As mentioned, we adapt Romer and Rosenthal’s (Reference Romer and Rosenthal1979) and Tsebelis’s (Reference Tsebelis2002) theoretical work to generate competing models of rulemaking. We first describe common elements in these models. Under our theoretical framework, a game is composed of one agenda setter and one or more veto players. A government agency serves as the agenda setter (A) and proposes a rule $ {y}_j\in R $
to possibly alter the status quo
$ {y}_j\in R $
to possibly alter the status quo $ {q}_j\in R $
in a unidimensional policy space (if
$ {q}_j\in R $
in a unidimensional policy space (if $ {y}_j={q}_j $
, that means that A decides not to change the status quo), subject to a vetoing decision sequentially made by each of veto players,
$ {y}_j={q}_j $
, that means that A decides not to change the status quo), subject to a vetoing decision sequentially made by each of veto players, $ {V}_1,\dots, {V}_N, $
where N is a positive integer.Footnote
18 Each player has symmetric, single-peaked preferences. The agenda setter and veto players, respectively, have ideal points of
$ {V}_1,\dots, {V}_N, $
where N is a positive integer.Footnote
18 Each player has symmetric, single-peaked preferences. The agenda setter and veto players, respectively, have ideal points of $ {x}_A\in R $
and
$ {x}_A\in R $
and $ {x}_1,\dots, {x}_N\in R $
. Denote
$ {x}_1,\dots, {x}_N\in R $
. Denote $ {x}_V=\{{x}_1,\dots, {x}_N\} $
. A proposed rule (
$ {x}_V=\{{x}_1,\dots, {x}_N\} $
. A proposed rule ( $ {y}_j\ne {q}_j $
) will be finalized and replace
$ {y}_j\ne {q}_j $
) will be finalized and replace $ {q}_j $
if none of the veto players blocks the proposed rule. Otherwise,
$ {q}_j $
if none of the veto players blocks the proposed rule. Otherwise, $ {q}_j $
will be sustained.
$ {q}_j $
will be sustained.
To examine the relative influence of the two branches in rulemaking processes, we generate three competing models (they differ only in the set of veto players) from this theoretical framework as follows:Footnote 19
-
1. Congress (i.e., the medians of the House and Senate) acts as the only veto players (labeled as Model C).Footnote 20
-
2. The president constitutes the only veto player (Model P).
-
3. Congress and the president jointly function as the only veto players (Model CP).
For each status quo j, we solve for its subgame perfection equilibrium under each of the three models. Assume that $ {q}_j $
is drawn from a continuous distribution with the support large enough to cover the ideal points of the most conservative and liberal players. Denoting
$ {q}_j $
is drawn from a continuous distribution with the support large enough to cover the ideal points of the most conservative and liberal players. Denoting $ {y}_j^{*}({x}_V,{x}_A,{q}_j) $
as the policy in equilibrium, we can define the set of status quos that will be sustained in equilibrium as follows.
$ {y}_j^{*}({x}_V,{x}_A,{q}_j) $
as the policy in equilibrium, we can define the set of status quos that will be sustained in equilibrium as follows.
Definition 1. The agency gridlock interval (AGI) is $ \{{q}_j\in R|{y}_j^{*}({x}_V,{x}_A,{q}_j)={q}_j\} $
.
$ \{{q}_j\in R|{y}_j^{*}({x}_V,{x}_A,{q}_j)={q}_j\} $
.
With the assumptions and definition above, we can obtain our main theoretical result laid out in the following proposition.
Proposition 1. The AGI is between $ min\{{x}_V,{x}_A\} $
and
$ min\{{x}_V,{x}_A\} $
and $ max\{{x}_V,{x}_A\} $
.Footnote
21
$ max\{{x}_V,{x}_A\} $
.Footnote
21
This proposition crucially implies that more veto players do not necessarily expand the boundaries of the agency gridlock set, a well-established result from Tsebelis (Reference Tsebelis2002). Another implication is that the boundaries depend on the relative location of the agenda setters and veto players (Krehbiel Reference Krehbiel1998).
These implications are illustrated in Figure 3, where the president is assumed to be a Democrat and the median of Congress is more conservative than the president. Unicameralism is assumed in this figure for the purpose of illustration, but we remind the reader that in our empirical analysis, we consistently assume that each chamber constitutes a veto pivot. There are three scenarios for the agency’s preferences to discuss in this simplified illustration: (i) the agency is even more liberal than the president; (ii) the agency is moderate; and (iii) the agency is an outlier and even more conservative than the median of Congress. Under the first scenario, the agency is closest to and more extreme than the president, compared with the two veto players, making the AGI of Model P shortest among the three competing models. The AGI of Models C and CP is identical and larger, although the latter model has an additional veto player. When the agency is moderate (i.e., scenario (ii) in the figure), the AGI of Model C shrinks, whereas that of the other models remains similar. Under scenario (iii), where the agency is located to the right of Congress and an outlier to the president and Congress, the AGI of Model P is expanded and has the same length as Model CP. Overall, the shift in the ideology of the agency may or may not alter the AGI of a model, depending both on the set of its veto players and on their relative locations.
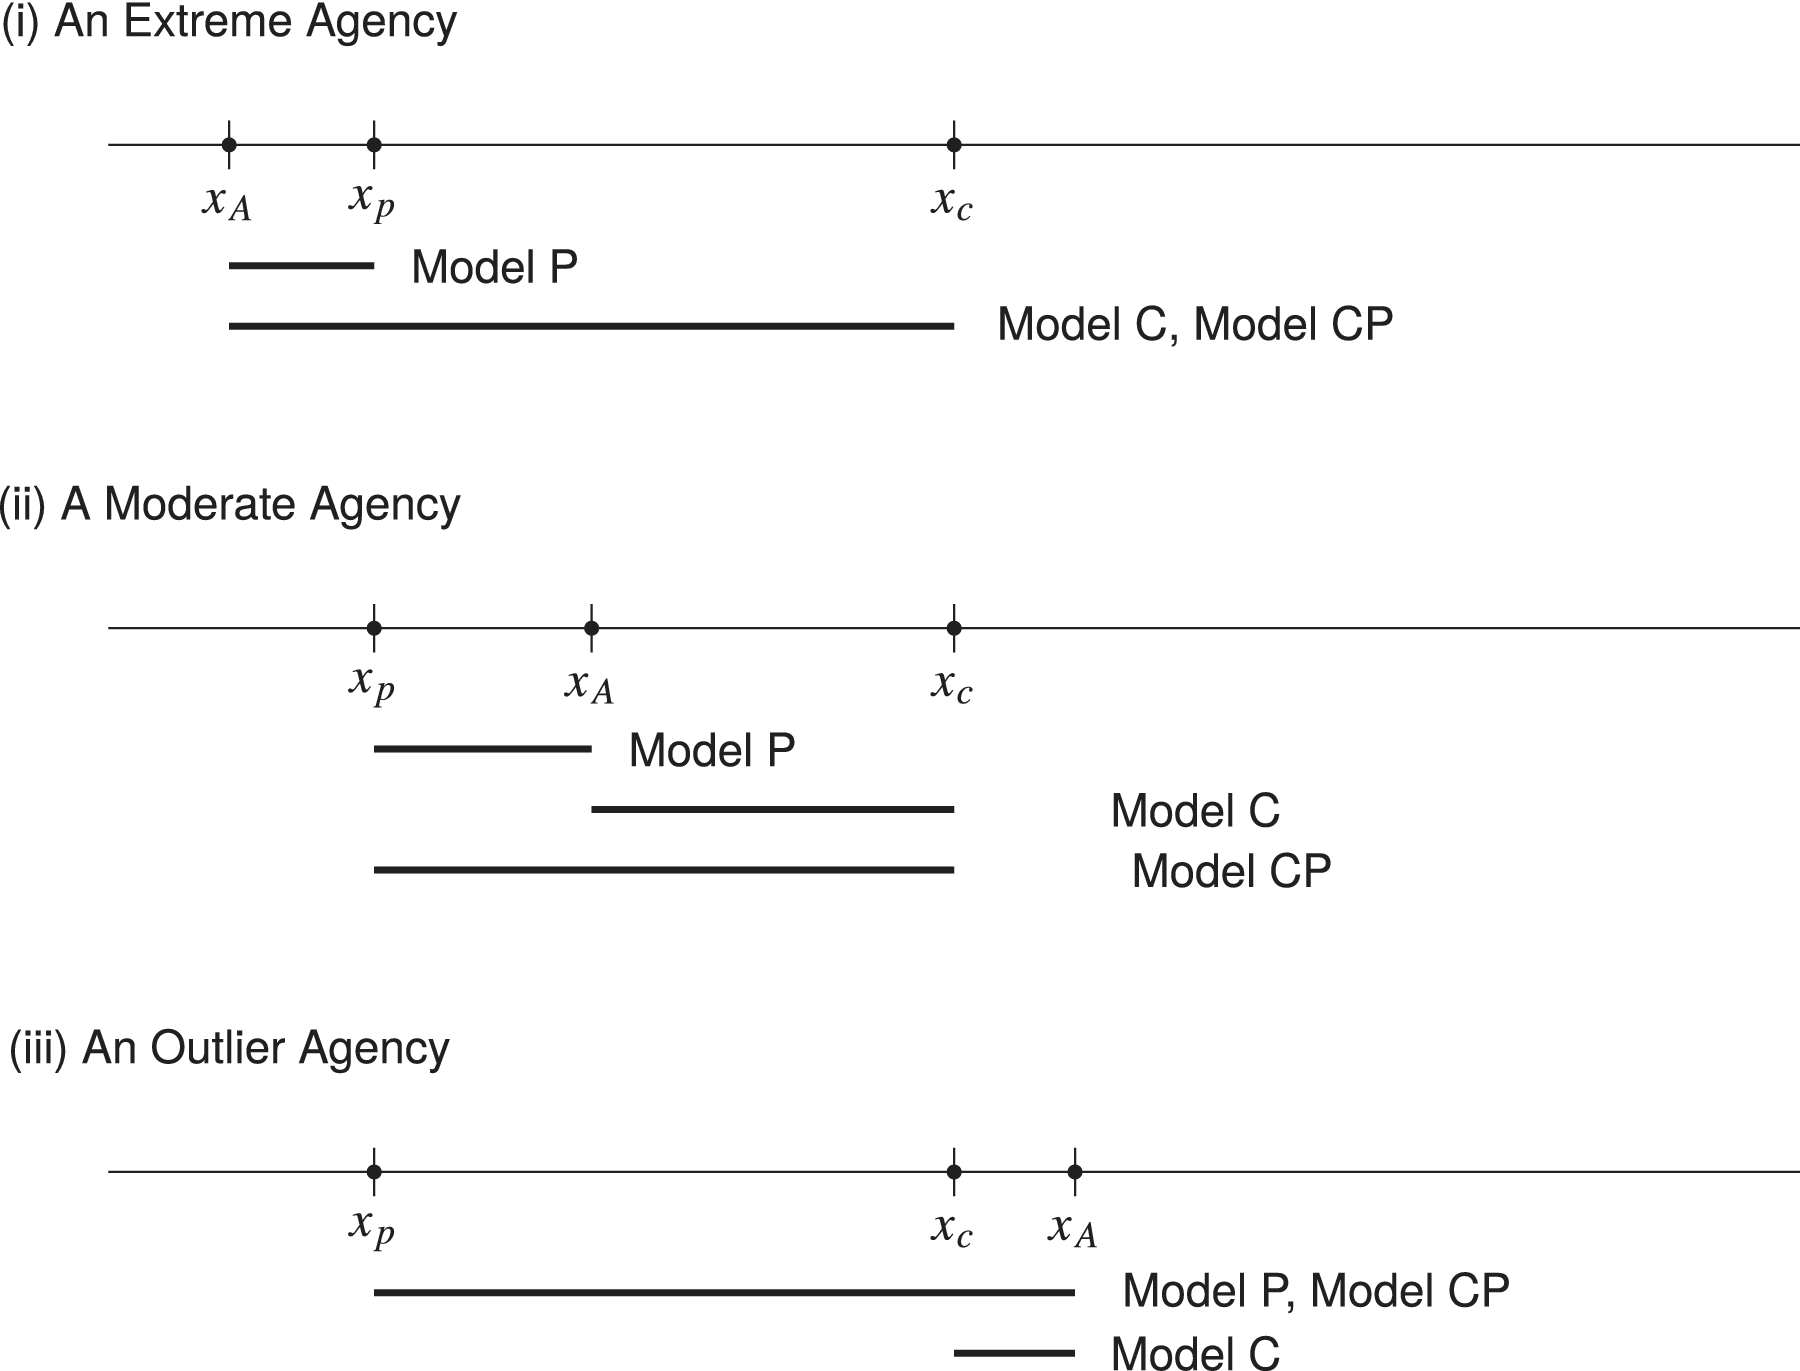
Figure 3. The Illustration of Agency Gridlock Interval (AGI) for Each of the Competing Models Under Different Preference Configurations
Notes: The bolded line to the left of a model label indicates the model’s AGI.
It is important to note that our theoretical framework does not require the control exercised by these veto players to be zero-sum. In a wide variety of preference configurations, action taken by one branch to constrain an agency may also benefit another branch. For example, in Model CP, a right-leaning Congress and President would be both better off by preventing a left-leaning agency from promulgating rules which would move policy further away from them. Additionally, there are a wide array of process controls (reporting mandates, impact analyses, and other procedural requirements) which may be imposed by a branch on agencies without forcing in a substantive change in policy (Rosenbloom, Newbold, and Doughty Reference Rosenbloom, Newbold and Doughty2018).
Like previous studies on legislative productivity and unilateral action (e.g., Chiou and Rothenberg Reference Chiou and Rothenberg2014; Howell Reference Howell2003; Krehbiel Reference Krehbiel1998), we assume that status quos are uniformly distributed.Footnote 22 This assumption implies that an agency facing political environment entailing a more lengthy AGI will be less productive in a Congress (i.e., the lengthier the AGI, the less productive the agency). We will concentrate our empirical analysis on this hypothesis.
These competing models are related to hypotheses proposed by previous studies in several ways. For example, Potter and Shipan (Reference Potter and Shipan2019) hypothesize that an agency is more productive when it is ideologically aligned with the president, which is quite consistent with Model P. Additionally, their congressional influence hypothesis (i.e., agency productivity would be lower when Congress is an agency’s strong opponent) can be derived from Model C.Footnote 23 On the other hand, the hypothesis proposed by Yackee and Yackee (Reference Yackee and Yackee2009a) on divided government cannot be derived from any of these models. These hypotheses assume that implicit vetoes are exercised by both Congress and the president. One of the important advantages from our theoretical framework is that we more systematically and explicitly evaluate potential models and improve theoretical clarity.
Method and Data
We examine the hypothesis derived from Proposition 1 using a dataset of 442 parent agency-Congress observations, covering 55 parent agencies (hereafter referred to as agencies) from 1995 to 2012, as detailed in Appendix A of the Supplementary Material. Our analysis focuses on this period and these agencies because agency ideal point estimates comparable with those of veto players we employ are available only for this period and these agencies. The unit of observation was tied to a 2-year Congress rather than alternatives such as quarters or months, which have been used by other studies (Potter and Shipan Reference Potter and Shipan2019; Yackee and Yackee Reference Yackee and Yackee2009a). We make this choice because each agency and corresponding veto players, including Congress and the president, have constant measured preferences (i.e., common-space scores) within a Congress, and a Congress captures the period between which the elected branches may act without clear signals of public preferences. Put differently, our key theoretical predictor, AGI, varies little for an agency within a Congress during the period, justifying our unit of analysis. This periodicity also follows convention in well-developed literature on legislative productivity (Binder Reference Binder1999; Krehbiel Reference Krehbiel1998) and executive orders (Chiou and Rothenberg Reference Chiou and Rothenberg2014; Howell Reference Howell2003).
Calculating agency productivity by focusing on promulgation of RINs from our rules universe for which an NPRM was published requires several noticeable choices worth highlighting and defending. We exclude interim final rules and final rules with statutory or judicial deadlines, consistent with Potter and Shipan (Reference Potter and Shipan2019), because the former types of final rules are intended to have only a temporary impact on public policy and are not consistent with our theoretical model. Similarly, Congress or the courts act as the agenda setter under the latter types of final rules. Although our theoretical model does not depend on whether or not an NPRM was issued for a rule before it was finalized, we focus on rules with NPRMs in our primary analysis to be consistent with prior scholarship on regulatory productivity (Potter and Shipan Reference Potter and Shipan2019; Yackee and Yackee Reference Yackee and Yackee2009a). Later, we extend our empirical analysis by including these final rules without NPRMs.
To examine agency rule productivity, our dependent variables are the number of final rules with at least one NPRM whose significance scores are at least as high as a given significance threshold and promulgated by an agency in a Congress. For each agency-Congress observation, data on agency regulatory productivity in that biennium were drawn from our rules universe (described in Appendix A of the Supplementary Material). Given that estimated scores of rule significance range from −1.276 to 3.483, as shown in Figure 1, that rules with NPRMs share this range of scores, and that rules without mentions of all raters tend to have scores between −1.276 and −0.3, we start our minimum significance threshold at −0.25 and incrementally increase the threshold of 0.25 until 2.25, as Chiou and Rothenberg (Reference Chiou and Rothenberg2014) conduct.Footnote 24 In other words, there are 11 dependent variables, each of which corresponds to a significance threshold. In addition, the number of all of the final rules with NPRMs promulgated by an agency within a Congress is included as the 12th dependent variable, allowing us to examine rule productivity without holding any significance thresholds. Accounting for the nature of count data (e.g., overdispersion) and the importance of controlling for idiosyncratic characteristics of individual agencies for regulatory affairs productivity, we follow Potter and Shipan (Reference Potter and Shipan2019) decision of employing a negative binomial regression model with random effects at the agency level and standard errors clustered on the agency.Footnote 25
In order to test our hypotheses, our primary independent variable of interest is AGI. According to the theoretical results of the “Theoretical Model and Hypothesis” section, AGI characterizes the location of the rule promulgating agency in relation to the relevant political actors in policy space.Footnote 26 As a starting point, for each agency in the dataset, we use the ideal points estimated by Chen and Johnson (Reference Chen and Johnson2015) to place the agency in Common Space with the president and members of Congress (McCarty, Poole, and Rosenthal Reference McCarty, Poole and Rosenthal2006).Footnote 27 The agency ideal points generated by Chen and Johnson (Reference Chen and Johnson2015) are estimated for 79 agencies using the political contribution data of individuals identified as working for the agency in those data.Footnote 28 The AGI for each of the three models is calculated according to Proposition 1, the interval bounded by the ideal point of an agency and the veto players stipulated in each of the three competing models in the last subsection. For instance, an agency’s gridlock interval of model CP for a Congress is the distance between ideal points of this agency, the chamber medians of the House and Senate, and the president during this given Congress. For each of the three models, we calculate the AGI for each Congress from the 104th to 112th.
We also include several control variables to account for important predictors already identified in the literature, or expected to be theoretically relevant. Prior research has suggested that divided government may pose additional barriers to agency productivity in the form of conflicting demands (Yackee and Yackee Reference Yackee and Yackee2009a). In order to account for this possibility, we include a dummy variable for Divided Government, which is coded 1 for agency-Congress observations for which the president and at least one house of Congress were controlled by different parties the majority of the time, and 0 otherwise.
We control for the workload capacity of agencies with Employment, the logged average yearly number of employees at each agency, as this influences productivity (Potter Reference Potter2017). Prior scholars have suggested that independent agencies may be less productive (Potter and Shipan Reference Potter and Shipan2019), so we include an indicator variable for Independent Agency. Footnote 29 We include a time trend variable in the form of Congress and Congress Squared following the approaches of Carter and Signorino (Reference Carter and Signorino2010).Footnote 30
Empirical Results
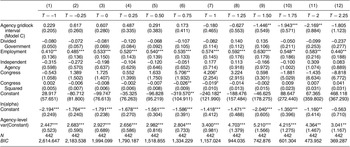
We present our empirical results from testing our hypotheses for our three competing models. We start with our results from testing Model P, where the president constitutes the only veto player. As displayed in Table 2, the dependent variable of the first equation is the total number of final rules with NPRMs promulgated by an agency within a Congress. The dependent variable of the second equation is the total number of final rules with NPRMs and significance scores at least as high as $ -0.25 $
. The last equation has the total number of final rules with NPRMs and scores equal to or higher than
$ -0.25 $
. The last equation has the total number of final rules with NPRMs and scores equal to or higher than $ 2.25 $
as the dependent variable. As shown in this table, the coefficient of the AGI, our key independent variable, is negative, as predicted, and statistically significant under a wide range of significance thresholds, that is, from 1 to 1.75. The average marginal effect of this variable is
$ 2.25 $
as the dependent variable. As shown in this table, the coefficient of the AGI, our key independent variable, is negative, as predicted, and statistically significant under a wide range of significance thresholds, that is, from 1 to 1.75. The average marginal effect of this variable is $ -1.858,-2.122,-1.445 $
, and
$ -1.858,-2.122,-1.445 $
, and $ -0.626 $
under each of these four significance thresholds, respectively. The substantive importance of the AGI effect is evident, given the mean of the associated dependent variables (see Table A.8 in Appendix D of the Supplementary Material). These results suggest that the empirical support for Model P is obtained under moderate- or high-significance thresholds.
$ -0.626 $
under each of these four significance thresholds, respectively. The substantive importance of the AGI effect is evident, given the mean of the associated dependent variables (see Table A.8 in Appendix D of the Supplementary Material). These results suggest that the empirical support for Model P is obtained under moderate- or high-significance thresholds.
Table 2. The President as the Only Veto Player (Lowest to High Thresholds)

Note: Standard errors are in parentheses. Each model’s dependent variable is the number of eligible final rules with NPRMs and a significance score of at least T (defined in the column labels), promulgated by an agency within a Congress. Models include agency-level random effects and agency-clustered SEs. BIC = Bayesian information criterion. One-tailed test: $ {}^{*}p<0.05 $
,
$ {}^{*}p<0.05 $
, $ {}^{**}p<0.01 $
,
$ {}^{**}p<0.01 $
, $ {}^{***}p<0.001 $
.
$ {}^{***}p<0.001 $
.
The results for testing Model C (Congress functions as the only veto player) are shown in Table 3. The results for our key independent variable diverge: the AGI is negative and statistically significant only under the thresholds equaling to 1.50 or higher. The average marginal effect of this variable is $ -3.912,-2.008 $
, and
$ -3.912,-2.008 $
, and $ -1.346 $
under the thresholds of 1.50, 1.75, and 2. These are pronounced and even stronger than under Model P, given the mean of the dependent variable under these thresholds. Likewise, the coefficient of the AGI of Model CP is statistically significant under the thresholds of 1, 1.25, 1.50, 1.75, and 2, with the average marginal effect of
$ -1.346 $
under the thresholds of 1.50, 1.75, and 2. These are pronounced and even stronger than under Model P, given the mean of the dependent variable under these thresholds. Likewise, the coefficient of the AGI of Model CP is statistically significant under the thresholds of 1, 1.25, 1.50, 1.75, and 2, with the average marginal effect of $ -1.788,-2.852,-2.758,-1.265 $
, and
$ -1.788,-2.852,-2.758,-1.265 $
, and $ -0.470 $
(see Appendix F of the Supplementary Material).
$ -0.470 $
(see Appendix F of the Supplementary Material).
Table 3. Congress as the Only Veto Player (Lowest to High Thresholds)

Note: Standard errors are in parentheses. Each model’s dependent variable is the number of eligible final rules with NPRMs and a significance score of at least T (defined in the column labels), promulgated by an agency within a Congress. Models include agency-level random effects and agency-clustered SEs. BIC = Bayesian information criterion. One-tailed test: $ {}^{*}p<0.05 $
,
$ {}^{*}p<0.05 $
, $ {}^{**}p<0.01 $
,
$ {}^{**}p<0.01 $
, $ {}^{***}p<0.001 $
.
$ {}^{***}p<0.001 $
.
While previous studies tend to find the effect of divided government is negative and statistically significant, we uncover more systematic evidence for this effect only with very low-significance thresholds under Model CP.Footnote 31 This implies that agencies do not produce a lower number of moderately or highly significant final rules under divided government.Footnote 32 However, consistent with previous findings, the effect of agency employment size is always positive and statistically significant under various significance thresholds. Furthermore, rule productivity does not hinge on whether an agency is an executive or independent one, regardless of the thresholds. We also find an upward trend (i.e., more final rules with NPRMs were promulgated during Bush’s second term and Obama’s first term) under moderate or high-significance thresholds.Footnote 33
As summarized in Table 4, when the significance threshold is less than 1, none of the three models receive empirical support. With the thresholds of $ 1 $
and
$ 1 $
and $ 1.25 $
, the main hypothesis is supported for Models P and CP. The Bayesian information criterion (BIC) of these two models are about the same, so it is difficult to use the BIC to distinguish which performs the best. Following the principle of theoretical parsimony, however, Model P appears superior, as adding more veto players does not improve model fit. The AGIs of Models P, C, and CP all receive empirical support with the threshold of 1.50, but the second model has slightly lower BIC. When the threshold is 1.75, Models C and CP perform similarly and clearly outperform Model P. With the significance threshold of
$ 1.25 $
, the main hypothesis is supported for Models P and CP. The Bayesian information criterion (BIC) of these two models are about the same, so it is difficult to use the BIC to distinguish which performs the best. Following the principle of theoretical parsimony, however, Model P appears superior, as adding more veto players does not improve model fit. The AGIs of Models P, C, and CP all receive empirical support with the threshold of 1.50, but the second model has slightly lower BIC. When the threshold is 1.75, Models C and CP perform similarly and clearly outperform Model P. With the significance threshold of $ 2 $
, the AGI coefficients of Models C and CP are both significant, but the BIC of the former is clearly smaller than that of the latter.
$ 2 $
, the AGI coefficients of Models C and CP are both significant, but the BIC of the former is clearly smaller than that of the latter.
Table 4. Model Comparison: Rules Only with NPRMs

Note: The blank cells indicate that a particular model found no significant relationship between agency gridlock interval (AGI) and rule productivity using a one-tailed test for $ \alpha =0.05 $
, drawing from a rules universe with only RINs scoring above the row’s listed significance threshold. If the coefficient on AGI is significant for a model (with expected sign) under a significance threshold, the Bayesian information criterion of the model is listed.
$ \alpha =0.05 $
, drawing from a rules universe with only RINs scoring above the row’s listed significance threshold. If the coefficient on AGI is significant for a model (with expected sign) under a significance threshold, the Bayesian information criterion of the model is listed.
We conduct several robustness checks (and extensions of our analysis). First, we explore alternative actors in Congress that may play a crucial role in constraining agency rulemaking activities. Although chamber medians are considered the most critical actors by nonpartisan (Krehbiel Reference Krehbiel1992) and partisan theories (Cox and McCubbins Reference Cox and McCubbins2005), we examine majority party medians and leaders to examine whether partisan force is an essential element in rulemaking productivity. For majority medians, we evaluate three competing models: (1) majority medians constitute the only veto players; (2) the president and majority medians act as veto players; and (3) majority medians, chamber medians, and the president are veto players. We do not find strong support for the first model (the coefficient of AGI is at best marginally significant under high-significance thresholds), but the results for the second and third models are qualitatively akin to those of our Model CP (see Table 4), with slightly higher BIC scores.Footnote 34 However, the models where chamber medians act as veto players always perform better than those models where we do not alter the set of veto players, except that we replace chamber medians with majority medians. Since the ideologies of majority medians and majority party leaders are highly correlated, unsurprisingly, our results for majority party leaders are almost qualitatively identical to those for majority medians.Footnote 35 This suggests that chamber medians are the most important actors in Congress and that their role cannot be replaced by majority medians or leaders. Our conclusions drawn from our results in Table 4 are robust.
In addition, we examine whether our primary results still hold up if we add final rules without NPRMs (excluding interim final rules and rules with legal deadlines). There exists a sizable number of rules which are finalized without being designated by an agency as a direct final rule or generating an NPRM (see Appendix A of the Supplementary Material). As displayed in Table 5, the overall results continue to hold. This means that the president and Congress seem to exercise influence over rules with or without NPRMs similarly. Moreover, the implicit veto held by the two branches over a rule is not mediated by the formal procedures of the standard notice-and-comment process.
Table 5. Model Comparison: Final Rules With or Without NPRMs

Note: The blank cells indicate that a particular model found no significant relationship between agency gridlock interval (AGI) and rule productivity using a one-tailed test for $ \alpha =0.05 $
, drawing from a rules universe with only RINs scoring above the row’s listed significance threshold. If the coefficient on AGI is significant for a model (with expected sign) under a significance threshold, the Bayesian information criterion of the model is listed.
$ \alpha =0.05 $
, drawing from a rules universe with only RINs scoring above the row’s listed significance threshold. If the coefficient on AGI is significant for a model (with expected sign) under a significance threshold, the Bayesian information criterion of the model is listed.
Conclusion
Rulemaking plays an increasingly central role in the crafting of policy in the United States, as the complexity of modern life drives delegation to bureaucrats. Prior scholarship on regulation has focused on whether the president or Congress dominates federal agencies, including independent regulatory commissions. This paper contributes to the resolution of this debate while demonstrating the conceptual and methodological advancements made by the field in several ways. First, this paper introduces an unprecedentedly comprehensive dataset on federal rulemaking which includes all rules on the federal regulatory agenda from Spring 1995 to Spring 2019, totaling 39,311 rules. Novel data on newspaper mentions and general rulemaking activities are collected for each of these rules and employed to generate a statistically integrated and continuous measure of rule significance which differentiates rules to a substantially improved degree over alternatives. These data and our estimates for nearly forty-thousand regulations are publicly available in the hope it will be of use to others. The ability to identify noteworthy regulations at many different thresholds empowers scholars to consider a critical aspect of rule content (significance), and “compare apples with apples” when assessing agency output.
Second, as an example, our integrated measure facilitates examination of policy significance as a determinant of legislative and executive influence in rulemaking. Notably, AGIs including the president alone predict rulemaking output for moderately significant regulations. Yet, for the most significant regulations, AGIs including only the House and Senate medians are predictive. We find not only that legislative and executive influence depends on the rule significance thresholds adopted to define the set of significant rules, but the effects of divided government, which previous studies focus on, hinge on significance thresholds. This finding addresses puzzling claims from the literature about whether or when the president or Congress has the upper hand over agency control. Furthermore, it highlights the need for scholars to consider the significance of policy proposals when studying both rulemaking and policymaking generally. In addition, our findings call for the need to take policy significance into account in examining interbranch competition in topics of recent interest, including, but not limited to, implicit legislative veto power over administrative activity (Acs Reference Acs2019), bureaucratic assessments of presidential and legislative influence among federal executives (Clinton, Lewis, and Selin Reference Clinton, Lewis and Selin2014), and public challenges by Congress to unilateral actions (Christenson and Kriner Reference Christenson and Kriner2017).
These findings also suggest new avenues for exploration. Natural experiments like exogenous shocks to AGIs through median-shifting Congressional resignations/deaths could be exploited to better explore the relationship between the preferences of political actors and agency productivity. There is a particular opportunity for theoretical development in understanding constraints placed on finalizing low-significance regulations. Our analysis of regulatory productivity also suggests that effective congressional participation depends on regulatory significance and controversiality. Nonetheless, theories of rulemaking do not address why and how this happens, calling for a major revision of those theories. Future theoretical advancements can be accomplished by explaining the results discovered in this paper. As the elected branches further empower experts, these findings will be increasingly relevant to the evolving policymaking influence of Congress and the presidency.
Supplementary Material
To view supplementary material for this article, please visit https://doi.org/10.7910/DVN/JTGHQD.
Data Availability Statement
Research documentation and data that support the findings of this study are openly available in the APSR Dataverse at https://doi.org/10.7910/DVN/JTGHQD.
Acknowledgments
The authors thank David Lewis, Robert Lowry, Tim Johnson, Rachel Potter, Susan Yackee, and the participants of the 2020 APSA panel, Regulation and Rulemaking. They also acknowledge Kyle Griffin, Paula Perez Romero, Virgemarie Salazar, and Gina Song for their help in data collection and coding for this project.
Funding Statement
This research was funded by Taiwan’s Ministry of Science and Technology, MOST 105-2628-H-001-002-MY3 (Research Grant) and Academia Sinica, AS-IA-105-H02 (Investigator Award).
Conflict of Interest
The authors declare no ethical issues or conflicts of interest in this research.
Ethical Standards
The authors affirm this research did not involve human subjects.


 Open access
Comments
No Comments have been published for this article.